. 2020 Jul;52(7):701-708.
doi: 10.1038/s41588-020-0628-z. Epub 2020 May 18.

Multi-cancer analysis of clonality and the timing of systemic spread in paired primary tumors and metastases

Affiliations

Multi-cancer analysis of clonality and the timing of systemic spread in paired primary tumors and metastases

Zheng Hu et al. Nat Genet. 2020 Jul.

Abstract

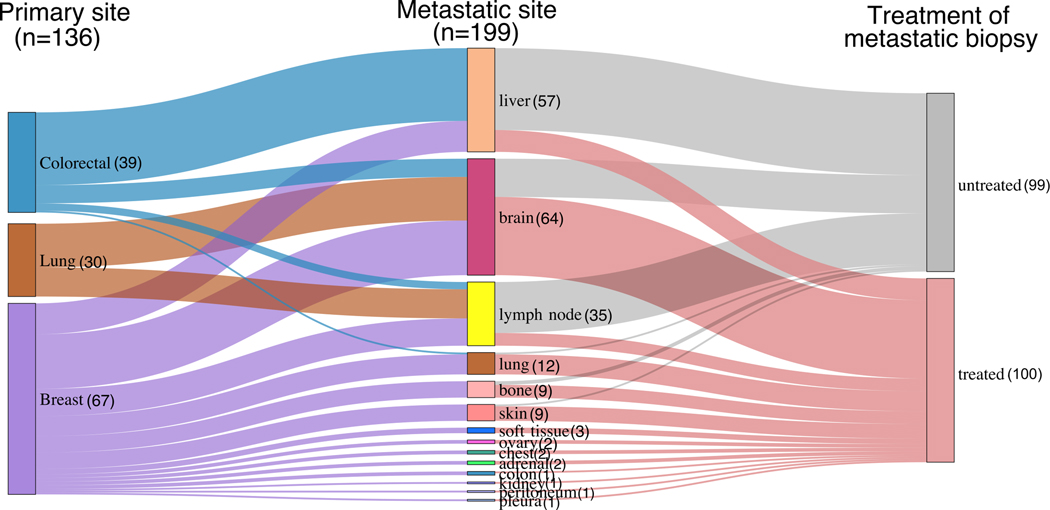
Metastasis is the primary cause of cancer-related deaths, but the natural history, clonal evolution and impact of treatment are poorly understood. We analyzed whole-exome sequencing (WES) data from 457 paired primary tumor and metastatic samples from 136 patients with breast, colorectal and lung cancer, including untreated (n = 99) and treated (n = 100) metastases. Treated metastases often harbored private 'driver' mutations, whereas untreated metastases did not, suggesting that treatment promotes clonal evolution. Polyclonal seeding was common in untreated lymph node metastases (n = 17 out of 29, 59%) and distant metastases (n = 20 out of 70, 29%), but less frequent in treated distant metastases (n = 9 out of 94, 10%). The low number of metastasis-private clonal mutations is consistent with early metastatic seeding, which we estimated occurred 2-4 years before diagnosis across these cancers. Furthermore, these data suggest that the natural course of metastasis is selectively relaxed relative to early tumorigenesis and that metastasis-private mutations are not drivers of cancer spread but instead associated with drug resistance.


Conflict of interest statement

Competing interests

C.C. is a scientific advisor to GRAIL and reports stock options as well as consulting for GRAIL and Genentech. Z.H., Z.L., Z.M. have no conflicts of interest to report.

Figures

Extended Data Fig. 1
Extended Data Fig. 1. Sankey diagram of patient cohorts with paired primary tumors and metastases
In total, 136 primary tumors and 199 matched metastases from colorectal, lung and breast cancers were included. Treatment status is indicated.
Extended Data Fig. 2
Extended Data Fig. 2. Concordance of mutation burden in paired primary tumors (P) and metastasis (M)
Concordance amongst a, Clonal SSNVs; b, Subclonal SSNVs and c, SCNAs are indicated. Spearman’s correlation (rho) is reported. Line indicates the linear regression and gray shading indicates the 95% confidence interval (CI) of the regression. The mean mutation burden across samples is reported for samples with multi-region sequencing data.
Extended Data Fig. 3
Extended Data Fig. 3. The ratio of nonsynonymous to synonymous mutations, dN/dS
The dN/dS ratios of missense mutations (left panel) or nonsense mutations (right panel) relative to synonymous mutations are shown (on log2 scale). The dN/dS ratios for putative driver genes and passengers were computed separately. The driver gene list was obtained by merging TCGA pan-cancer drivers and COSMIC Cancer Gene Census (Methods). Circles and vertical lines correspond to the mean and 95% CI of the dN/dS ratio, respectively.
Extended Data Fig. 4
Extended Data Fig. 4. The frequency of somatic copy number alterations (SCNAs) for primary tumors and metastases across three cancer types
The frequency of amplifications or deletions across 1Mb genomic bins is shown for primary tumors and metastases.
Extended Data Fig. 5
Extended Data Fig. 5. The frequency of somatic copy number alterations (SCNAs) in putative driver genes in paired primary tumors (P) and metastases (M)
Left panel, amplifications (AMP) where oncogenes with an increased frequency (≥15%) in the metastasis (M) versus primary (P) are labeled. Right panel, deletions (DEL) where tumor suppressor genes with increased frequency (≥15%) in the metastasis (M) versus primary (P) are labeled.
Extended Data Fig. 6
Extended Data Fig. 6. Schematic illustration of a 3-D spatial-agent based model of tumor growth and metastasis
Tumor growth is simulated via the expansion of deme subpopulations (mimicking the glandular structures often found in epithelial tumors and metastases) within a defined 3-D cubic lattice according to explicit rules dictated by spatial constraints, where cells within each deme are well-mixed and grow via a stochastic branching (birth-death) process (Methods). To model monoclonal seeding, a single cell at the tumor periphery was randomly sampled as the metastasis founder cell. To model polyclonal seeding, a cluster of cells (n=10) was randomly sampled from the whole tumor in order to maximize the clonal diversity within the metastasis founder cells. Metastatic growth follows the same spatial-constraints as the primary and starts from the metastasis founder cell or cell cluster. The final sizes of both the primary tumor and metastasis is ~109 cells (~2×10⁵ demes). Clonal selection is modeled by assuming a constant beneficial mutation rate that alters the cell birth/death probability according to the selection coefficient (denoted s). By simulating the acquisition of random mutations (neutral or beneficial), tracing the mutational genealogy of each cell as the tumor expands and subsequently spatially sampling (~106 cells in each sample) and sequencing the ‘final’ virtual tumor as is done experimentally after resection or biopsy, we obtain the variant allele frequencies (VAF) and cancer cell fraction (CCF) in both primary tumor and metastasis.
Extended Data Fig. 7
Extended Data Fig. 7. Lm, Lp and Ws values in tumors simulated under monoclonal versus polyclonal seeding
The number of SSNVs in each of the three categories (M-private clonal or Lm, P-private clonal or Lp, P/M shared subclonal or Ws) in the simulated data generated by modeling monoclonal seeding or polyclonal seeding within an agent-based model (Methods) where one sample (~106 cells) was biopsied from each primary tumor and metastasis. We employed a mutation rate u=0.6 per cell division in exonic regions (corresponding to 10−8 per site per cell division in the 60Mb diploid coding regions). In order to account for varying scenarios of tumor growth dynamics, selection and timing of metastatic dissemination, the birth probability b of founding cells, selection coefficient s and primary tumor size at dissemination Nd was randomly sampled from a uniform distribution, b~U(0.55, 0.65), log10(s)~U(−3,−1) and log10(Nd)~U(4,8), respectively. A total of n=500 virtual P/M pairs were simulated under monoclonal seeding and polyclonal seeding by randomly sampling these three parameters. Bar, median; box, 25th to 75th percentile (interquartile range, IQR); vertical line, data within 1.5 times the IQR.
Extended Data Fig. 8
Extended Data Fig. 8. Jaccard similarity index (JSI) values in lymph node and distant metastases and the percentage of polyclonal seeding across metastatic sites
a, Lymph node metastases (LNM; n=35) showed significantly higher JSI than distant metastases (n=164). Among distant metastases, untreated metastasis showed higher JSI than treated metastasis although this was not statistically significant. However, using a cutoff of JSI=0.3 to classify polyclonal (JSI ≥ 0.3) versus monoclonal seeding (JSI<0.3), untreated distant metastases showed a significantly higher percentage of polyclonal seeding than treated distant metastases (Fig. 2e). P-value, Wilcoxon Rank-Sum Test (two-sided). Bar, median; box, 25th to 75th percentile (interquartile range, IQR); vertical line, data within 1.5 times the IQR. b, The percentage of polyclonal seeding among all LNM (lymph node metastasis), LiM (liver metastasis), BM (brain metastasis) and LuM (lung metastasis) (left panel) and stratified by treatment (right panel). P-value, Fisher’s exact test (two sided).
Extended Data Fig. 9
Extended Data Fig. 9. A mathematical method to quantify the chronology of metastatic seeding, ts
a, Schematic of the parameters used to quantify metastatic timing ts (number of years prior to primary tumor diagnosis). We assume metastatic spread occurs at tm following the emergence of malignant founder of primary carcinoma (denoted t=0). Let T be the time from emergence of malignant founder to diagnosis of the primary tumor, thus ts=Ttm. Let Lp and Lm be the number of private clonal SSNVs in a bulk sample from primary tumor and metastasis, respectively. Lp represents the number of SSNVs that occurred from emergence of the primary tumor founder to the most recent common ancestor (pMRCA) of cell lineages in a bulk sample. This time span is denoted as tp. Similarly, Lm denotes the number of SSNVs occurred from the emergence of primary tumor founder to the MRCA in a bulk sample from the metastasis (denoted mMRCA). Lm includes the number of M-private clonal mutations that occur: (i) within the primary tumor (Lm1) and (ii) after cells have disseminated from the primary tumor (Lm2), thus Lm = Lm1 + Lm2. b, Estimation of α by simulating an agent-based model of tumor evolution (Methods). The mean α and standard deviation from 1000 simulated tumors are shown.
Extended Data Fig. 10
Extended Data Fig. 10. Later metastatic seeding is associated with higher genomic divergence in matched primary tumors
a, The number of primary (P)-private clonal SSNVs and metastasis (M)-private clonal SSNVs in synchronous (distant and monoclonal, n=41) and metachronous (distant and monoclonal, n=80) metastases, respectively. b, The number of P-to-M altered SCNAs in synchronous and metachronous metastases, respectively; P-values, two-sided Wilcoxon Rank-Sum Test. Bar, median; box, 25th to 75th percentile (interquartile range, IQR); vertical line, data within 1.5 times the IQR.
Fig. 1 |
Fig. 1 |. Landscape of driver mutations in paired primary tumors (P) and metastases (M).
a, Oncoprint of functional driver mutations in shared, P-private or M-private drivers. Genes mutated in at least three patients are shown. White circles indicate genes with multiple mutations in an individual patient. b, Ternary plot of mutation counts in driver genes, comparing P-private (left, green), M-private (right, red), and shared (top, blue). The size represents their overall count in the corresponding cancer type. c, The proportion of different classes of clonal and subclonal mutations in each of the three cancer types. d, The ratio of shared clonal to M-private clonal mutations for all non-silent or driver mutations. A down-sampling procedure was performed to derive the ratio (Methods). P-value, Wilcoxon Rank-Sum Test (two-sided). Bar, median; box, 25th to 75th percentile (interquartile range, IQR); vertical line, data within 1.5 times the IQR. e, The proportion of metastases harboring at least one private clonal driver mutation in all, untreated or treated metastases. P-value, Fisher’s exact test (two-sided). f-g, Schematic of the major clone model where metastasis originates from the major driver clone in the primary tumor (f) leading to driver homogeneity between paired P and M biopsies or of the minor clonal model where the metastasis originates from a minor driver clone in the primary tumor (g). Due to the inability to detect low frequency mutations by bulk sequencing, the minor clone model leads to driver heterogeneity between P and M biopsies.
Fig. 2 |
Fig. 2 |. The clonality of metastatic seeding.
a, Schematic of monoclonal versus polyclonal seeding of a metastasis. Polyclonal seeding occurs either through a cell cluster or multiple monoclonal dissemination events. b, Distinct patterns of seeding are evident based on the cancer cell fraction (CCF) of SSNVs between primary (P)/metastatic (M) pairs, where representative patients are shown: monoclonal (colon cancer V402); polyclonal (lung cancer TH6). c, Classification of monoclonal versus polyclonal seeding based on the JSI. Top, JSI values in 1000 virtual P/M tumor pairs. Middle, classification accuracy by varying the cutoff of JSI from 0–1 based on simulation data. Bottom, JSI values in patient data (n=199 P/M pairs) where the 0.3 cutoff was used to identify monoclonal (n=151) or polyclonal seeding (n=48). d, Lm, Lp, Ws values in patient data. e, The number of P-to-M altered SCNAs for monoclonal (n=151) and polyclonal (n=48) metastases. P-value, Wilcoxon Rank-Sum Test (two-sided). f, Positive correlation between Lm and the number of P-to-M altered SCNAs. n=199 P/M pairs; Spearman’s correlation (rho) and P-value are reported. g, Polyclonal seeding is common in LNM and untreated distant metastases relative to treated distant metastases. h, Schematic of how treatment can promote monoclonality as a result of selection for a resistant subclone, despite initial seeding by polyclonal disseminated cells. Box plots: bar, median; box, 25th to 75th percentile (interquartile range, IQR); vertical/horizontal line across box, data within 1.5 times the IQR. Jaccard similarity index, JSI; brain metastasis, BM; lymph node metastasis; LNM.
Fig. 3 |
Fig. 3 |. Tumor sample phylogenies based on multi-region sequencing data.
The maximum parsimony method was used to reconstruct multi-sample trees for each patient based on the presence or absence SSNVs/indels amongst the samples. For each primary(P)/metastatic(M) sample pair, the Jaccard similarity index (JSI) was computed according to Eq. (4) based on the numbers of M-private clonal, P-private clonal and P-M shared subclonal SSNVs. High JSI values (≥0.3) indicates polyclonal seeding while low JSI values (<0.3) indicates monoclonal seeding. Monoclonal seeding gives rise to monophyletic tree structures (pink shading indicates metastatic samples within a single phylogenetic clade), whereas polyclonal seeding gives rise to a polyphyletic structure (blue shading indicates metastatic samples within multiple phylogenetic clades) in the metastasis samples. P, primary tumor; OvM, ovarian metastasis; LNM, lymph node metastasis; SkM, skin metastasis; LiM, liver metastasis. Additional patient data are shown in Supplementary Fig. 8.
Fig. 4 |
Fig. 4 |. Chronology of metastatic seeding.
a, Schematic for the timing of metastatic seeding prior to diagnosis of the primary tumor in number of years, ts. T denotes the total time of primary tumor expansion from emergence of the malignant founder cell to diagnosis while tp denotes the time from emergence of the malignant founder cell to the most recent common ancestor (MRCA) of cells in a bulk sample from primary tumor (denoted pMRCA). mMRCA denotes the MRCA of cells in a bulk sample from metastasis. ts can be estimated by Eq.(1). Dx, diagnosis. b, Estimation of the average T with a Gompertzian growth model is 5.2 (interquartile range or IQR, 4.3−7.7), 4.3 (IQR, 2.7−4.4) and 4.6 (IQR, 3.2−6.6) years for colorectal, lung and breast cancer, respectively. c, Estimation of the time of metastatic seeding (ts) for individual distant metastases (monoclonal metastases) in each cancer type. The median ts and IQR are shown. Negative ts indicates that the metastasis was seeded after the diagnosis of primary tumor. d, The distribution of ts in synchronous metastases (n=41) and metachronous metastases (n=80). P-value, Wilcoxon Rank-Sum Test (two-sided). Bar, median; box, 25th to 75th percentile (IQR); vertical line, data within 1.5 times the IQR. e, Correlation between ts and the time span from diagnosis of primary tumor to metastasis. Spearman’s correlation (rho) and P-value are reported. Line indicates the linear regression and gray shading indicates the 95% confidence interval (CI) of the regression.
Fig. 5 |
Fig. 5 |. Schematic model of metastatic spread and the impact of therapy
a, Schematic illustration of early versus late metastatic seeding leading to synchronous and metachronous metastases. Metastatic seeding occurs quickly following the emergence of the founding carcinoma cell. Synchronous metastases, which exhibit low genomic divergence from the primary tumor, is seeded early by the major/founding clone in the primary tumor. Metachronous metastases, exhibit higher genomic divergence relative to the primary tumor and often emerge after adjuvant therapy. Metachronous metastases with specific driver mutations that confer resistance can be selected leading to high genomic divergence between the primary tumor and treated metastasis. b, Treatment (adjuvant therapy), remodels the clonal architecture of metastasis. Dissemination and metastatic seeding (monoclonal or polyclonal) initially give rise to undetectable micrometastases. While treatment may eliminate drug-sensitive micrometastatic lesions, those that are resistant grow out. Metastatic relapse following adjuvant treatment may be delayed by adjuvant treatment, but this may result in a more aggressive, resistant lesion. DTCs, disseminated tumor cells. Dx, diagnosis; Tx, treatment.

References

    1. Talmadge JE, Wolman SR & Fidler IJ Evidence for the clonal origin of spontaneous metastases. Science 217, 361–3 (1982). - PubMed
    1. Yamamoto N. et al. Determination of clonality of metastasis by cell-specific color-coded fluorescent-protein imaging. Cancer Res 63, 7785–90 (2003). - PubMed
    1. Liu W. et al. Copy number analysis indicates monoclonal origin of lethal metastatic prostate cancer. Nat Med 15, 559–65 (2009). - PMC - PubMed
    1. Huang Y. et al. Multilayered molecular profiling supported the monoclonal origin of metastatic renal cell carcinoma. Int J Cancer 135, 78–87 (2014). - PubMed
    1. Gundem G. et al. The evolutionary history of lethal metastatic prostate cancer. Nature 520, 353–357 (2015). - PMC - PubMed

Methods-only references

    1. Li H. & Durbin R. Fast and accurate short read alignment with Burrows-Wheeler transform. Bioinformatics 25, 1754–60 (2009). - PMC - PubMed
    1. Cibulskis K. et al. Sensitive detection of somatic point mutations in impure and heterogeneous cancer samples. Nat Biotechnol 31, 213–9 (2013). - PMC - PubMed
    1. Koboldt DC et al. VarScan 2: somatic mutation and copy number alteration discovery in cancer by exome sequencing. Genome Res 22, 568–76 (2012). - PMC - PubMed
    1. Costello M. et al. Discovery and characterization of artifactual mutations in deep coverage targeted capture sequencing data due to oxidative DNA damage during sample preparation. Nucleic Acids Res 41, e67 (2013). - PMC - PubMed
    1. Li H. et al. The Sequence Alignment/Map format and SAMtools. Bioinformatics 25, 2078–9 (2009). - PMC - PubMed

Publication types