. 2020 Jun;52(6):634-639.
doi: 10.1038/s41588-020-0621-6. Epub 2020 May 18.

Scalable generalized linear mixed model for region-based association tests in large biobanks and cohorts

Affiliations

Scalable generalized linear mixed model for region-based association tests in large biobanks and cohorts

Wei Zhou et al. Nat Genet. 2020 Jun.

Abstract

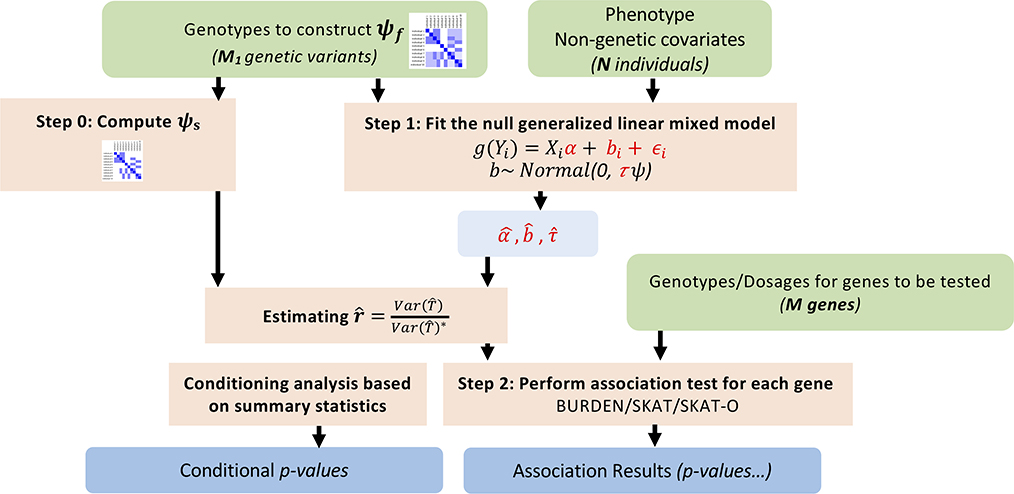
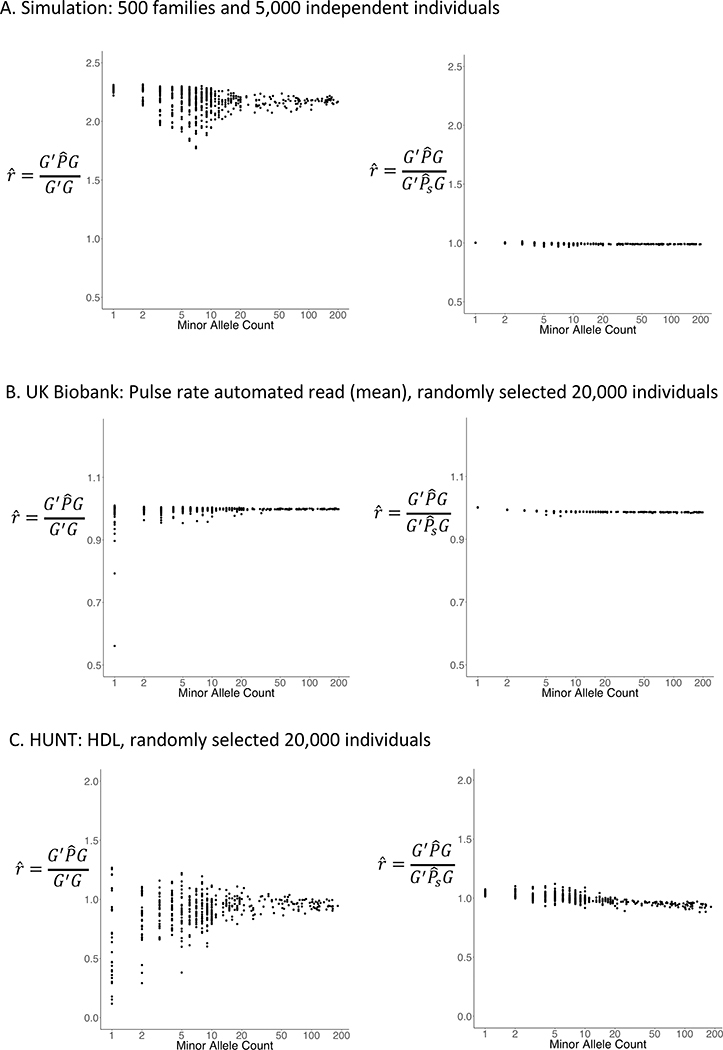
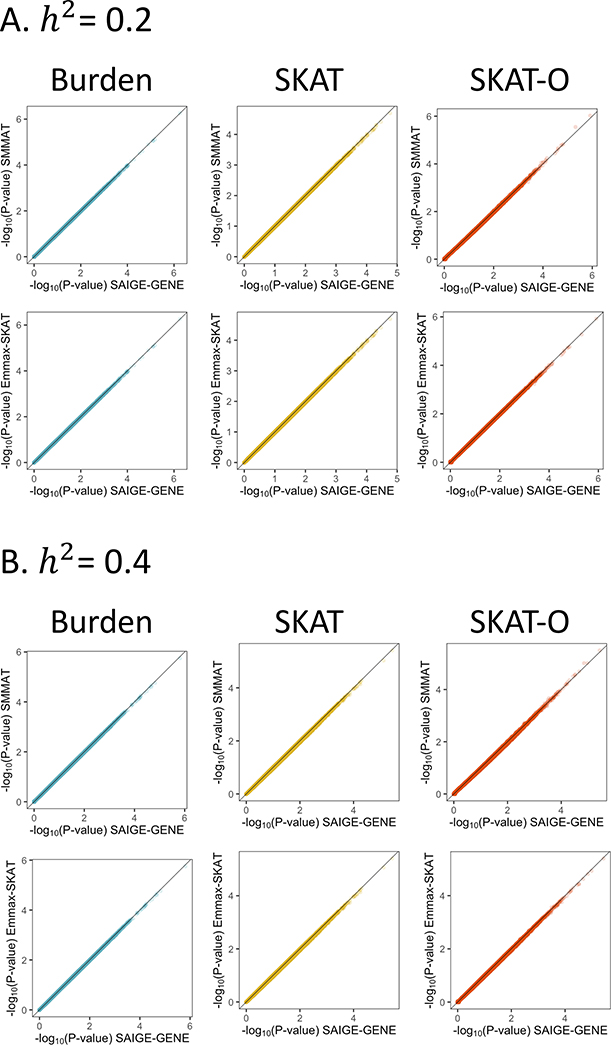
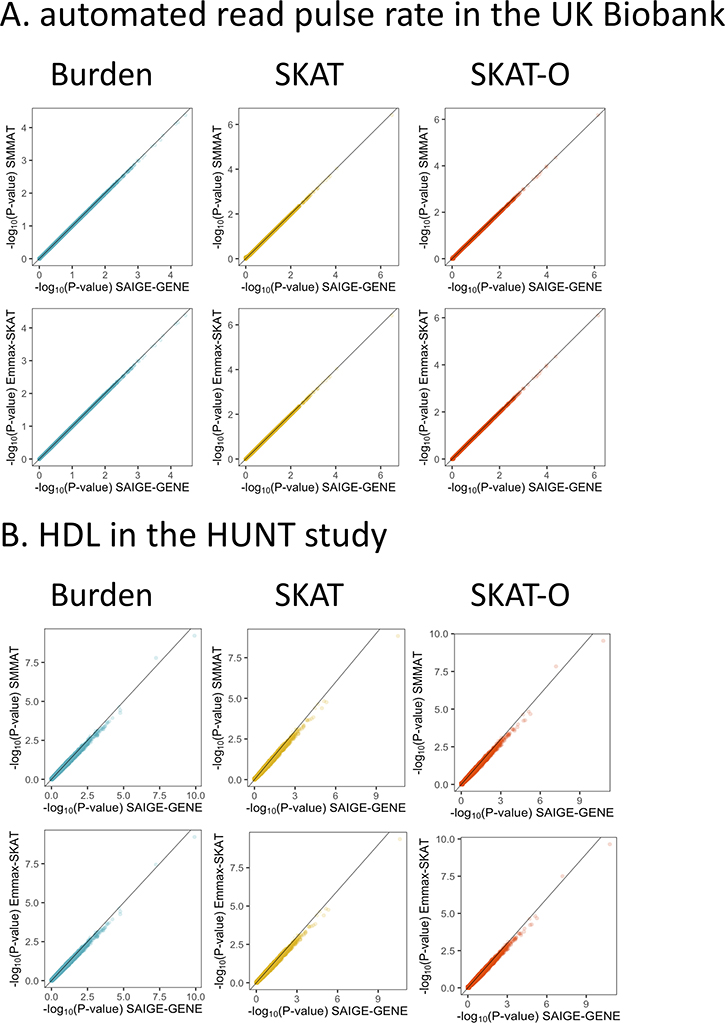
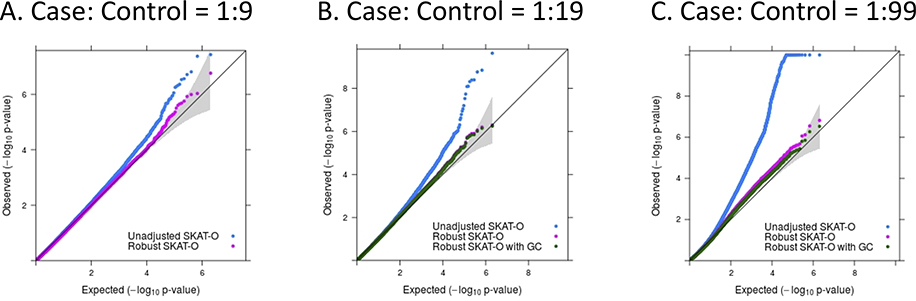
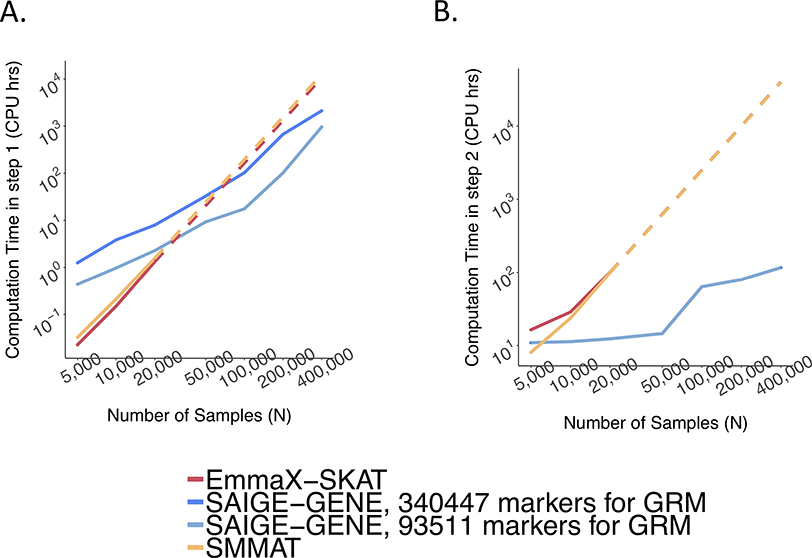
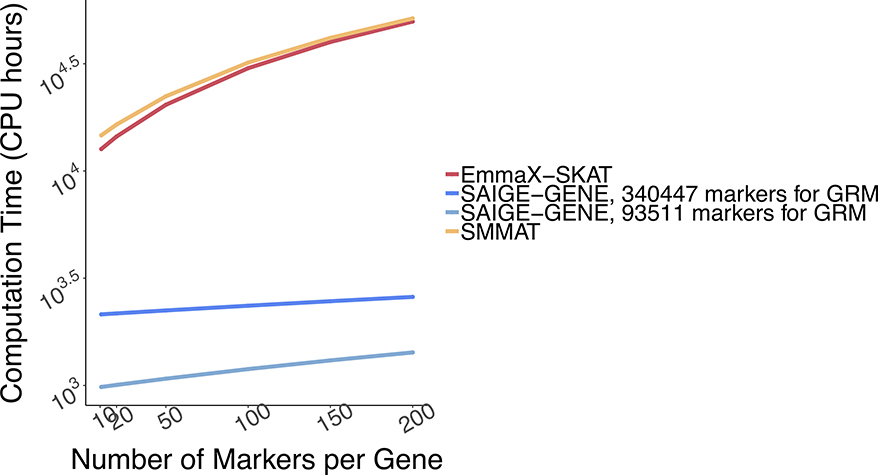
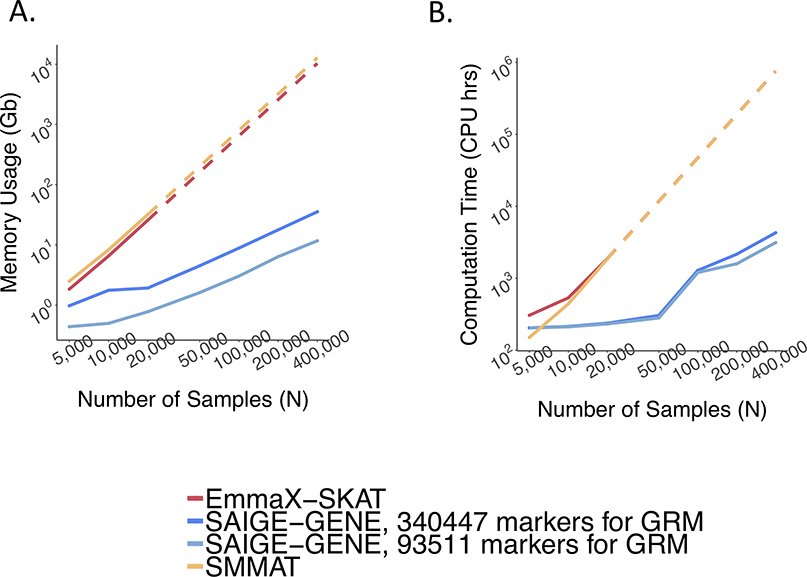
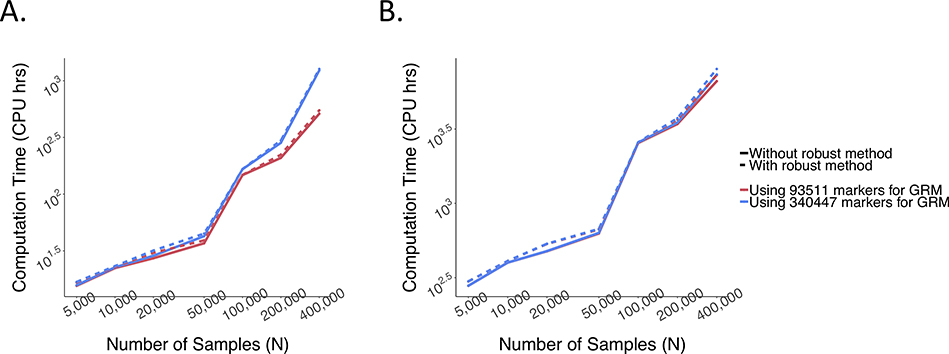
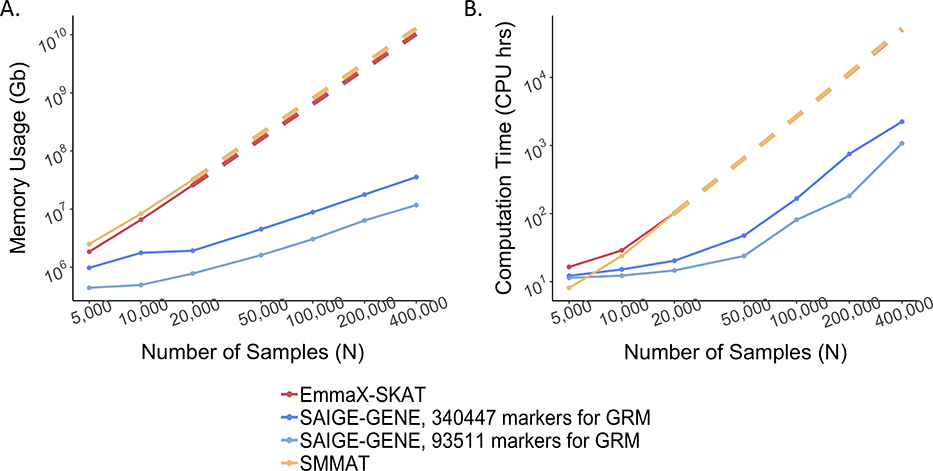
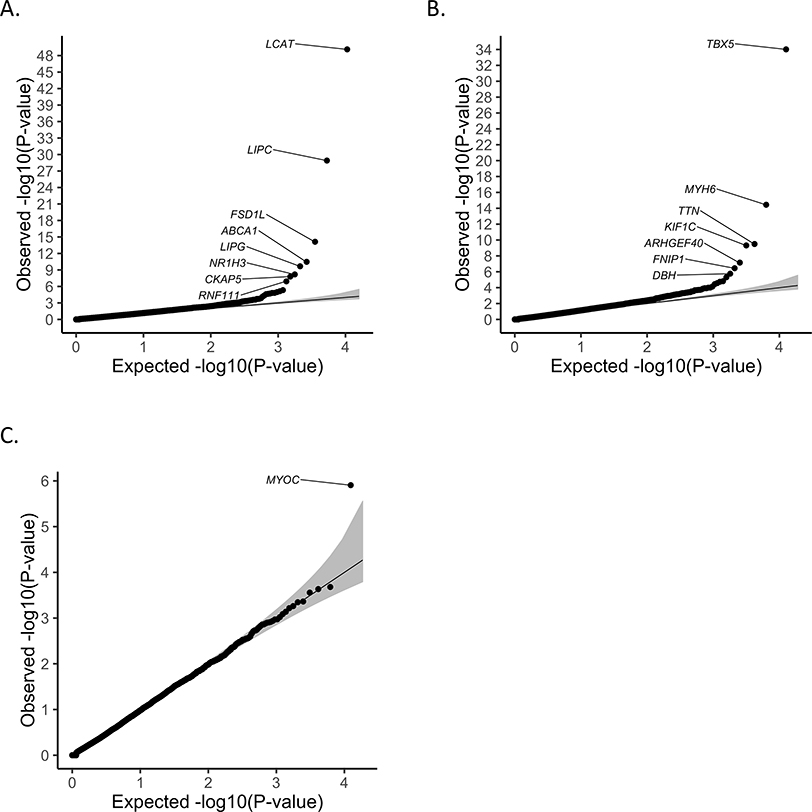
With very large sample sizes, biobanks provide an exciting opportunity to identify genetic components of complex traits. To analyze rare variants, region-based multiple-variant aggregate tests are commonly used to increase power for association tests. However, because of the substantial computational cost, existing region-based tests cannot analyze hundreds of thousands of samples while accounting for confounders such as population stratification and sample relatedness. Here we propose a scalable generalized mixed-model region-based association test, SAIGE-GENE, that is applicable to exome-wide and genome-wide region-based analysis for hundreds of thousands of samples and can account for unbalanced case-control ratios for binary traits. Through extensive simulation studies and analysis of the HUNT study with 69,716 Norwegian samples and the UK Biobank data with 408,910 White British samples, we show that SAIGE-GENE can efficiently analyze large-sample data (N > 400,000) with type I error rates well controlled.


Conflict of interest statement

COMPETING FINANCIAL INTERESTS STATEMENT

G.R.A. is an employee of Regeneron Pharmaceuticals. He owns stock and stock options for Regeneron Pharmaceuticals. B.N. is a member of Deep Genomics Scientific Advisory Board, has received travel expenses from Illumina, and also serves as a consultant for Avanir and Trigeminal solutions.

Figures

Extended Data Fig. 1
Extended Data Fig. 1. Workflow of SAIGE-GENE.
SAIGE-GENE consists of two steps: (1) Fitting the null generalized linear mixed model (GLMM) to estimate variance components and other model parameters; (2) Testing for association between each genetic variant set, such as a gene or a region, and the phenotype.
Extended Data Fig. 2
Extended Data Fig. 2. Plots of the variance ratio of the score statistics by MAC for rare variants with and without the full GRM for sample relatedness (left) and with the full GRM and a sparse GRM for closely related samples (right).
a, Genotypes were simulated for 500 families and 5,000 independent individuals based on the pedigree structure shown in Supplementary Fig. 1 and the null model was fitted for the simulated quantitative trait with h2 = 0.2. The sparse GRM was constructed using a coefficient of relatedness cutoff 0.2. b, 20,000 samples with White British ancestry were randomly selected from the UK Biobank and the null model was fitted for the automated read pulse rate. The sparse GRM was constructed using a coefficient of relatedness cutoff 0.125. c, 20,000 samples were randomly selected form the HUNT study and the null model was fitted for HDL. The sparse GRM was constructed using a coefficient of relatedness cutoff 0.125.
Extended Data Fig. 3
Extended Data Fig. 3. Scatter plots of association P-values from SAIGE-GENE versus SMMAT and EmmaX-SKAT for the Burden, SKAT, and SKAT-O tests based on simulation data on the −log10 scale.
1,000,000 genes were tested with 1,000 families, each having 10 members, as shown in the Supplementary Fig. 1. The Pearson’s correlation coefficients r2 > 0.99 for −log10(P-values) between SAIGE and SMMAT and between SAIGE and EmmaX-SKAT. a, h2 = 0.2. b, h2 = 0.4.
Extended Data Fig. 4
Extended Data Fig. 4. Scatter plots of association P-values from SAIGE-GENE versus SMMAT and EmmaX-SKAT for the Burden, SKAT, and SKAT-O tests based on real data analysis on the −log10 scale.
a,b, 12,000 genes were tested for automated read pulse rate on 20,000 randomly selected white British samples in the HRC-imputed UK Biobank (a) and for HDL on 20,000 randomly selected samples in HUNT (b). Missense and stop-gain variants with MAF ≤ 1% were included. The Pearson’s correlation coefficients r2 > 0.99 for −log10(P-values) between SAIGE and SMMAT and between SAIGE and EmmaX-SKAT.
Extended Data Fig. 5
Extended Data Fig. 5. Scatter plots of association P-values on the −log10 scale from SAIGE-GENE with two sample relatedness cutoffs for the sparse GRM, 0.125 and 0.2. 15,338 genes were tested for automated read pulse rate in white British samples in the HRC-imputed UK Biobank (N = 385,365).
N, sample size. Missense and stop-gain variants with MAF ≤ 1% were included. a, Burden. b, SKAT. c, SKAT-O.
Extended Data Fig. 6
Extended Data Fig. 6. Quantile-quantile plots of association P-values for 10 million variant sets from the simulation study for phenotypes with various case-control ratios (N = 100,000).
a, Case:Control = 1:9. b, Case:Control = 1:19. c, Case:Control = 1:99. N, sample size.
Extended Data Fig. 7
Extended Data Fig. 7. Empirical computation time.
a,b, Step 1 for fitting a null mixed model (a) and Step 2 for association tests (b), respectively, by sample sizes (N) for gene-based tests for 15,342 genes, each containing 50 rare variants. Benchmarking was performed on randomly sub-sampled UK Biobank data with 408,144 White British participants for waist-to-hip ratio. The reported run time was median of five runs with samples randomly selected from the full sample set using different sampling seeds. The reported computation time for EmmaX-SKAT and SMMAT was projected when N > 20,000. As the number of tested markers varies by sample sizes, the computation time was projected for 50 markers per gene for plotting. Numerical data are provided in Supplementary Table 1.
Extended Data Fig. 8
Extended Data Fig. 8. Log-log plot of the estimated run time as a function of number of markers per gene.
Benchmarking was performed on randomly sub-sampled 400,000 UK Biobank data with 408,144 white British participants for waist-to-hip ratio on 15,342 genes. The plotted run time was median of five runs with samples randomly selected from the full sample set using different sampling seeds. The computation time for other different number of markers per gene was projected based on the benchmarked time.
Extended Data Fig. 9
Extended Data Fig. 9. Log-log plots of the estimated run time and memory usage as a function of sample size (N) for genome-wide tests for 286,000 chunks.
a, Run time. b, Memory usage. Each chunk contains 50 variants on average, given that there are 14.3 million markers in the HRC-imputed UK Biobank with MAF ≤ 1% and imputation info score ≥ 0.8. Numerical data are provided in Supplementary Table 1. Benchmarking was performed on randomly sub-sampled UK Biobank data with 408,144 white British participants for waist-to-hip ratio. The plotted run time and memory were medians of five runs with samples randomly selected from the full sample set using different sampling seeds.
Extended Data Fig. 10
Extended Data Fig. 10. Log-log plots of the estimated run time for as a function of sample size (N) for SAIGE-GENE with and without using the robust adjustment.
a, Exome-wide gene-based tests for 15,871 genes. b, Genome-wide tests for 286,000 chunks. Each gene or chunk contains 50 variants on average. Benchmarking was performed on randomly sub-sampled UK Biobank data with 402,163 white British participants tested for glaucoma (PheCode: 365, 4,462 cases and 397,701 controls). The case-control ratio remained the same in subsampled data sets. The reported run time was median of five runs with samples randomly selected from the full sample set using different sampling seeds. As the number of tested markers varies by sample sizes, the computation time was projected for 50 markers per gene for plotting. Numerical data are provided in Supplementary Table 2.
Figure 1.
Figure 1.
Estimated and projected computation cost by sample sizes (N) for gene-based tests for 15,342 genes, each containing 50 rare variants. Benchmarking was performed on randomly sub-sampled UK Biobank data with 408,144 White British participants for waist-to-hip ratio. The reported run times and memory are medians of five runs with samples randomly selected from the full sample set using different sampling seeds. The reported computation time and memory for EmmaX-SKAT and SMMAT is the projected computation time when N > 20,000. A. Log-log plots of the memory usage as a function of sample size (N) B. Log-log plots of the run time as a function of sample size (N). Numerical data are provided in Supplementary Table 1.
Figure 2.
Figure 2.
Quantile-quantile plots of exome-wide gene-based association results. A. Results for high-density lipoprotein (HDL) in the HUNT study (N = 69,214). SKAT-O test in SAIGE-GENE was performed for 13,416 genes with stop-gain and missense variants with MAF ≤ 1%, of which 10,600 having at least two variants are plotted. B. Results for automated read pulse rate in the UK Biobank (N = 385,365). The SKAT-O test in SAIGE-GENE was performed for 15,338 genes with stop-gain and missense variants with MAF ≤ 1%, of which 12,636 having at least two variants are plotting. C. Results for glaucoma in the UK Biobank (N cases = 4,462; N controls = 397,761). SKAT-O approach in SAIGE-GENE was performed for 15,338 genes with stop-gain and missense variants with MAF ≤ 1%, of which 12,638 having at least two variants are plotting. N: sample size.

References

    1. Taliun D et al. Sequencing of 53,831 diverse genomes from the NHLBI TOPMed Program. bioRxiv (2019). - PMC - PubMed
    1. Bycroft C et al. The UK Biobank resource with deep phenotyping and genomic data. Nature 562, 203–209, doi:10.1038/s41586-018-0579-z (2018). - DOI - PMC - PubMed
    1. Lee S, Abecasis GR, Boehnke M & Lin X Rare-variant association analysis: study designs and statistical tests. Am J Hum Genet 95, 5–23, doi:10.1016/j.ajhg.2014.06.009 (2014). - DOI - PMC - PubMed
    1. Wu MC et al. Rare-variant association testing for sequencing data with the sequence kernel association test. Am J Hum Genet 89, 82–93, doi:10.1016/j.ajhg.2011.05.029 (2011). - DOI - PMC - PubMed
    1. Lee S, Wu MC & Lin X Optimal tests for rare variant effects in sequencing association studies. Biostatistics 13, 762–775, doi:10.1093/biostatistics/kxs014 (2012). - DOI - PMC - PubMed

METHODS-ONLY REFERENCES

    1. Chen H et al. Control for Population Structure and Relatedness for Binary Traits in Genetic Association Studies via Logistic Mixed Models. Am J Hum Genet 98, 653–666, doi:10.1016/j.ajhg.2016.02.012 (2016). - DOI - PMC - PubMed
    1. Lee SH & van der Werf JH An efficient variance component approach implementing an average information REML suitable for combined LD and linkage mapping with a general complex pedigree. Genet Sel Evol 38, 25–43, doi:10.1051/gse:2005025 (2006). - DOI - PMC - PubMed
    1. Gilmour AR, Thompson R & Cullis BR Average Information REML: An Efficient Algorithm for Variance Parameter Estimation in Linear Mixed Models. Biometrics 51, 1440–1450, doi:10.2307/2533274 (1995). - DOI
    1. Lee S, Teslovich TM, Boehnke M & Lin X General framework for meta-analysis of rare variants in sequencing association studies. Am J Hum Genet 93, 42–53, doi:10.1016/j.ajhg.2013.05.010 (2013). - DOI - PMC - PubMed
    1. Davis TA Direct Methods for Sparse Linear Systems (Fundamentals of Algorithms 2). (Society for Industrial and Applied Mathematics, 2006).

Publication types