. 2020 Jun;21(6):649-659.
doi: 10.1038/s41590-020-0672-y. Epub 2020 May 18.

Remodeling of light and dark zone follicular dendritic cells governs germinal center responses

Affiliations

Remodeling of light and dark zone follicular dendritic cells governs germinal center responses

Natalia B Pikor et al. Nat Immunol. 2020 Jun.

Abstract

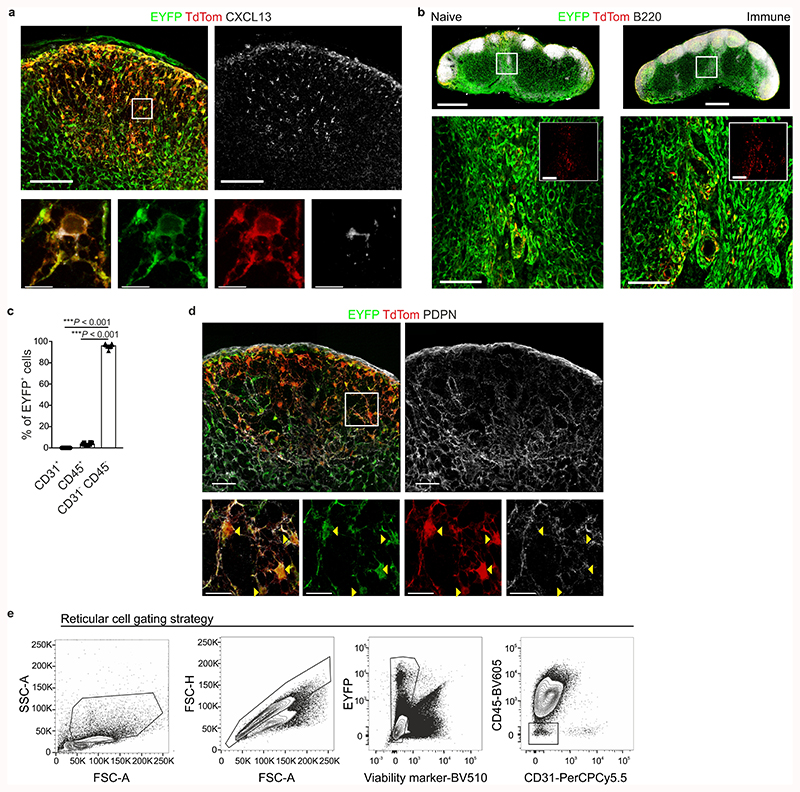
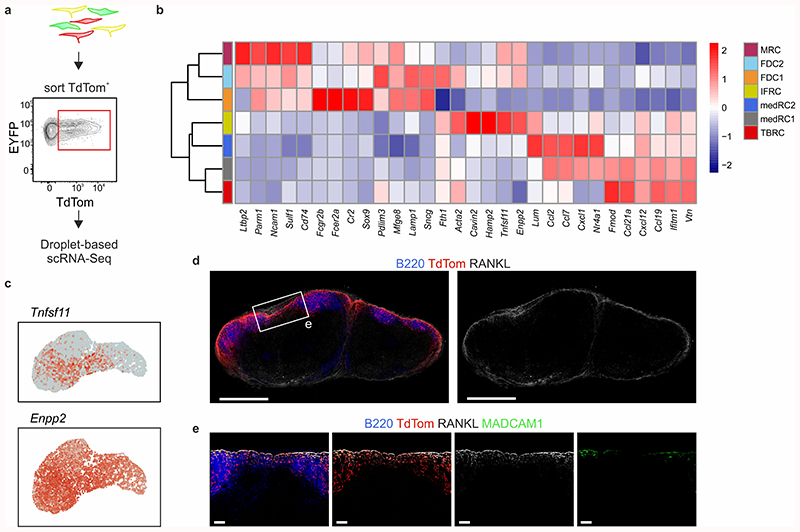
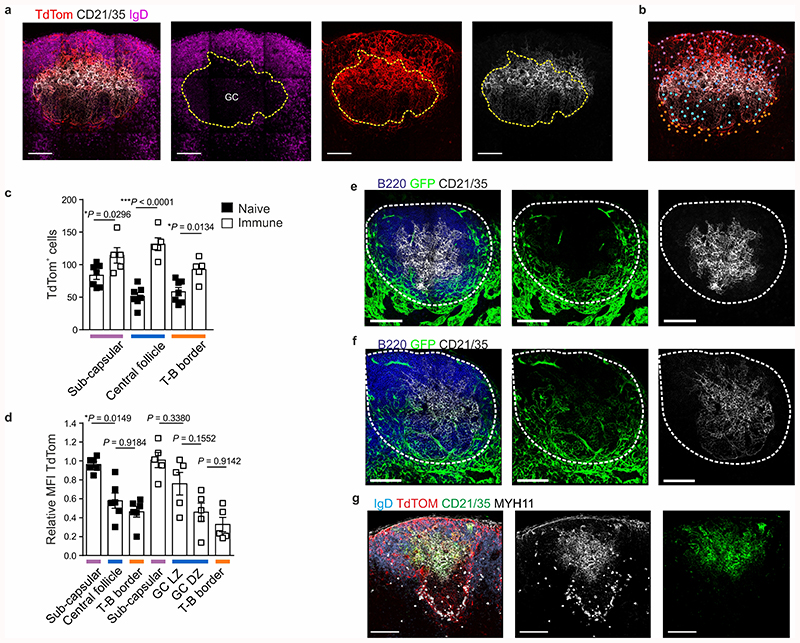
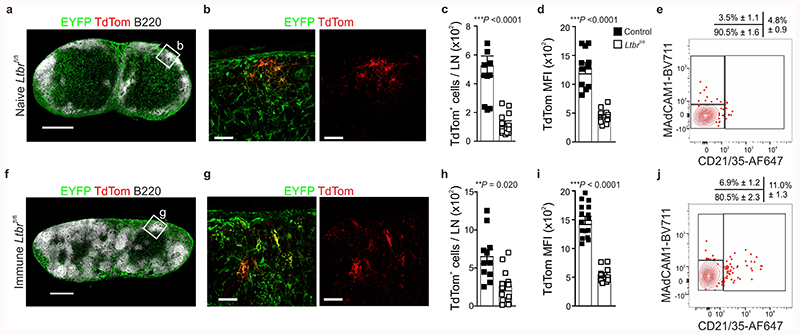
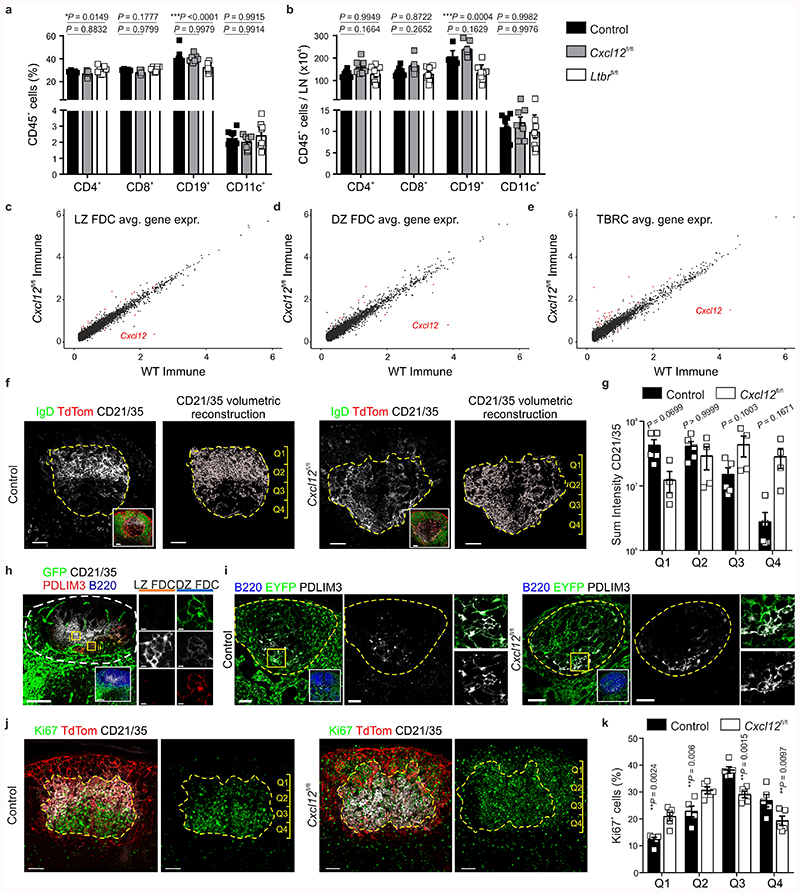
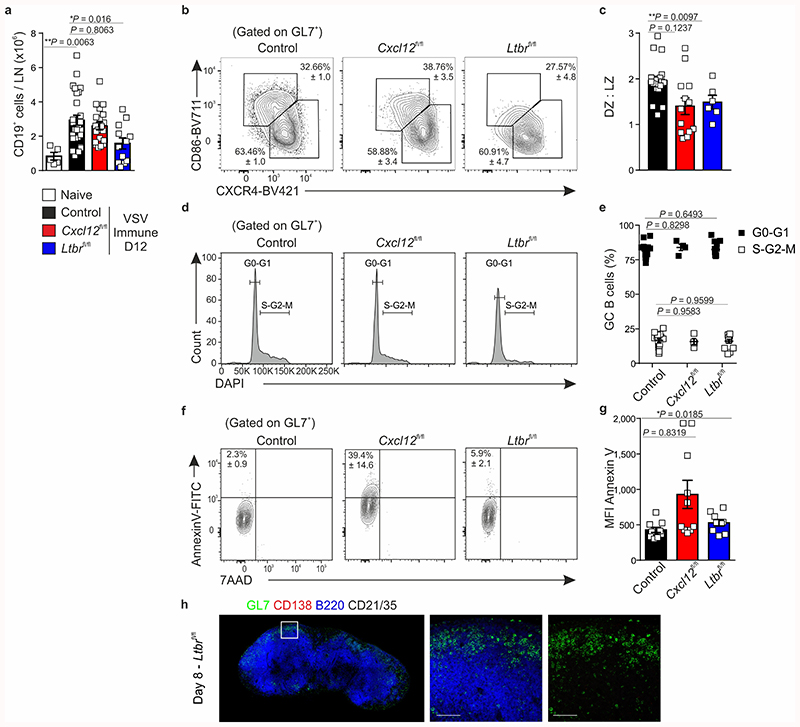
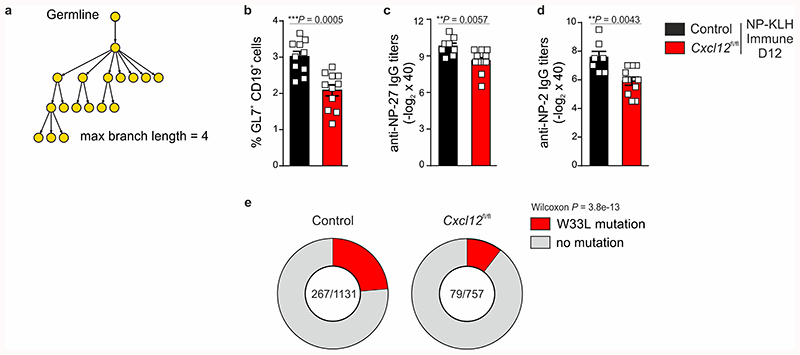
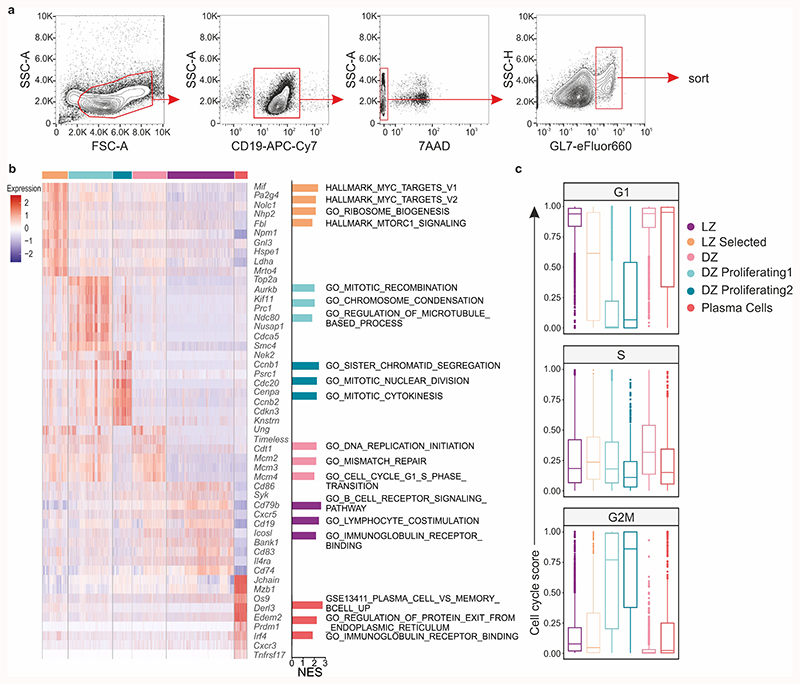
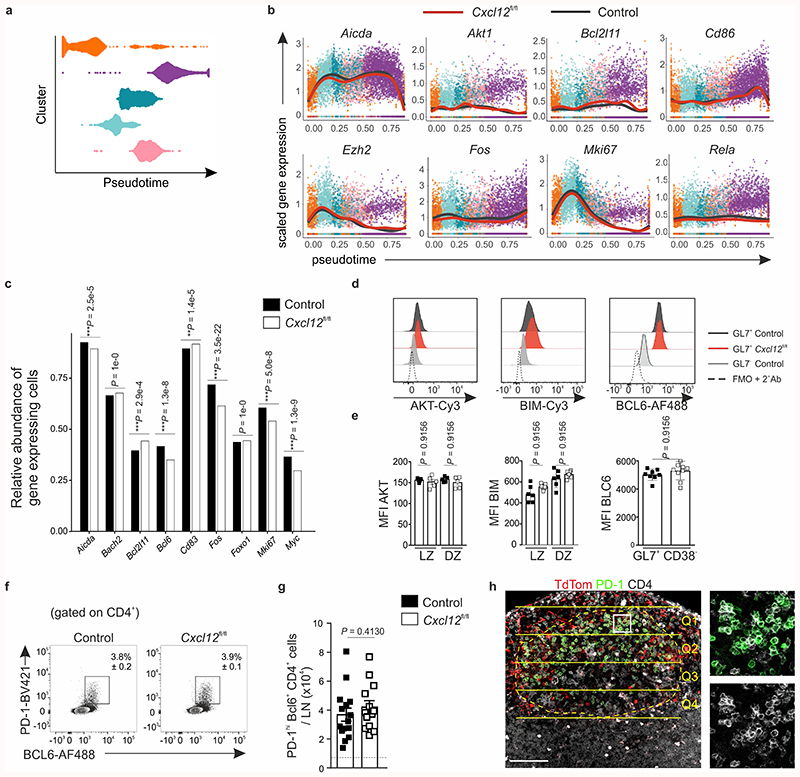
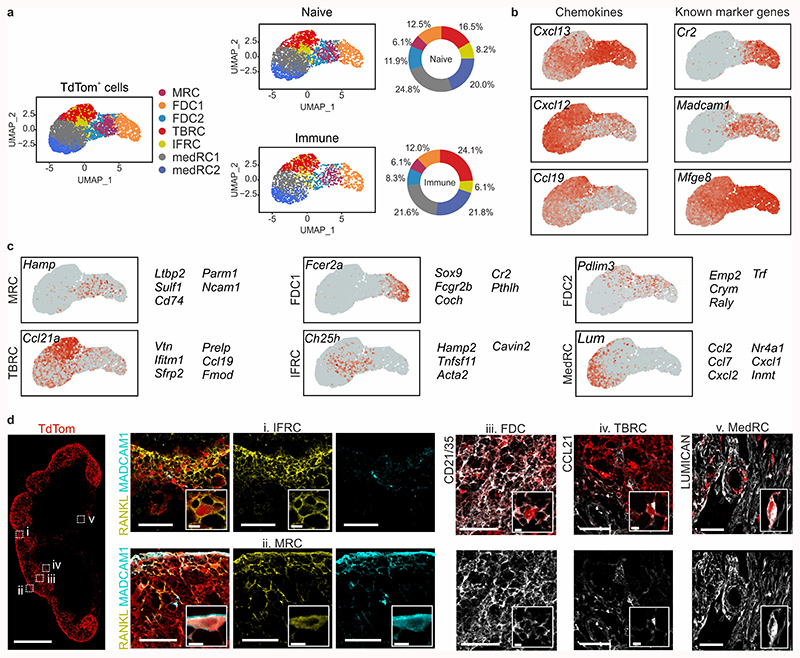
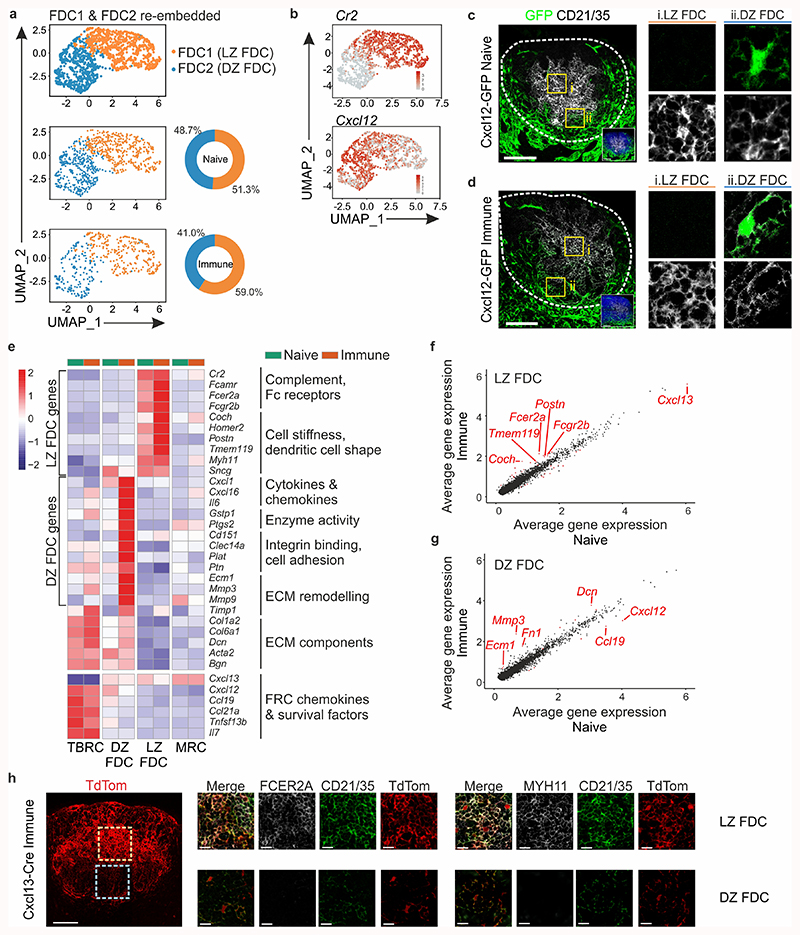
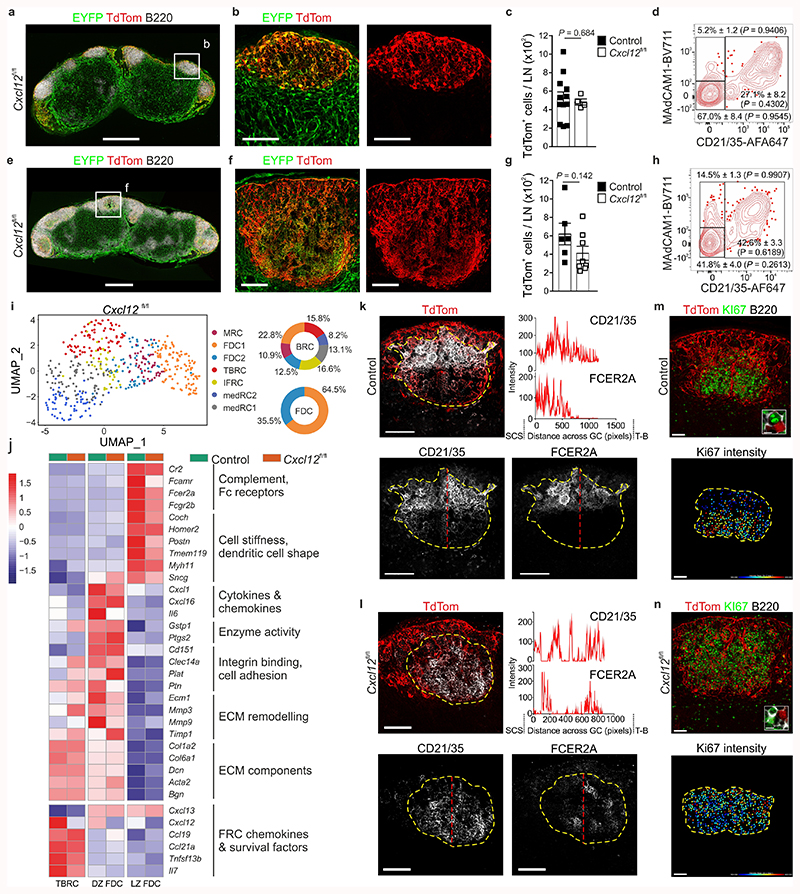
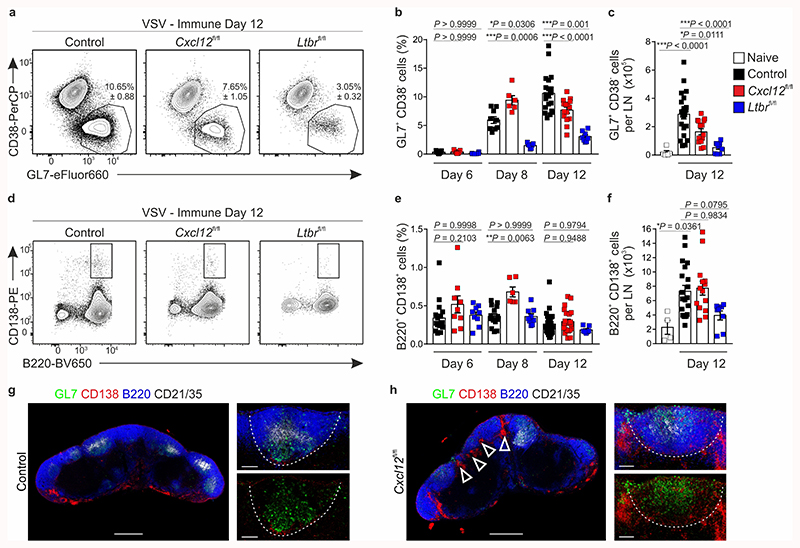
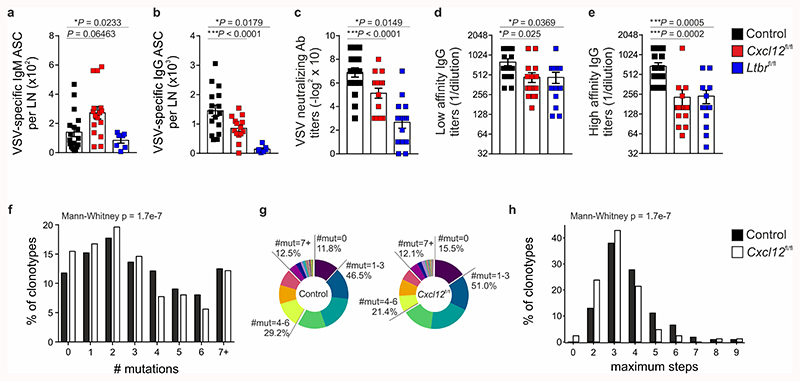
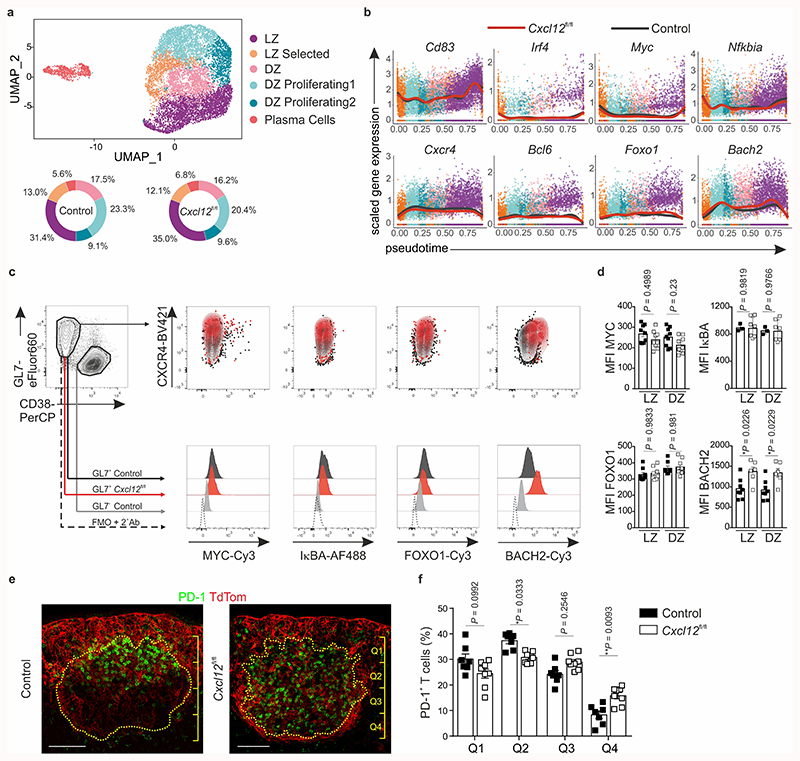
Efficient generation of germinal center (GC) responses requires directed movement of B cells between distinct microenvironments underpinned by specialized B cell-interacting reticular cells (BRCs). How BRCs are reprogrammed to cater to the developing GC remains unclear, and studying this process is largely hindered by incomplete resolution of the cellular composition of the B cell follicle. Here we used genetic targeting of Cxcl13-expressing cells to define the molecular identity of the BRC landscape. Single-cell transcriptomic analysis revealed that BRC subset specification was predetermined in the primary B cell follicle. Further topological remodeling of light and dark zone follicular dendritic cells required CXCL12-dependent crosstalk with B cells and dictated GC output by retaining B cells in the follicle and steering their interaction with follicular helper T cells. Together, our results reveal that poised BRC-defined microenvironments establish a feed-forward system that determines the efficacy of the GC reaction.


Conflict of interest statement

The authors declare no competing interests.

Figures

Extended Data Fig. 1
Extended Data Fig. 1. The Cxcl13-Cre/TdTom transgene faithfully demarcates non-endothelial, non-hematopoietic, CXCL13-expressing cells.
a, Representative immunofluorescence images of EYFP, TdTom, and CXCL13 expression in naive Cxcl13-Cre/TdTom EYFP mice. Scale bars, 100 μm and 10 μm. b, Representative images of TdTom expression in the medullary cords of naive and day 12 VSV-immunized Cxcl13-Cre/TdTom EYFP mice. Scale bars, 500 μm and 100 μm. c, Quantification of the percentage of EYFP+ cells expressing CD31 or CD45 in naive Cxcl13-Cre/TdTom EYFP mice. Mean and SEM are depicted. d, Representative images of EYFP, TdTom and podoplanin (PDPN) expression in naive Cxcl13-Cre/TdTom EYFP mice. Arrows point to the cell body. Scale bars, 50 μm and 20 μm. e, Flow cytometric gating strategy of non-hematopoietic, non-endothelial reticular cells from Cxcl13-Cre/TdTom EYFP mice. (a,b,d) Images are representative of at least five mice. (c,e) N = 8 naive mice, 4 independent experiments; P values as per one-way ANOVA with Tukey’s multiple comparisons test.
Extended Data Fig. 2
Extended Data Fig. 2. Single cell transcriptomic analysis of B cell-interacting reticular cells.
a, Schematic representation of the experimental setup. b, Heatmap of the averaged gene expression of top cluster-specific genes across all BRC subsets. Hierarchical grouping based on cluster-specific marker genes is depicted in the left panel. c, Feature plots depicting the expression of the indicated genes. d, Representative overview of RANKL staining in naïve Cxcl13-Cre/TdTom mouse lymph nodes. e, The indicated interfollicular region from (d) stained for B220, RANKL and MAdCAM1. Images are representative of at least three mice.
Extended Data Fig. 3
Extended Data Fig. 3. Molecular and topological identity of light and dark zone FDC at a single cell level.
a,b, Strategy for demarcating distinct regions of the B cell follicle for topological BRC analysis using positioning, TdTom fluorescence intensity, and IgD and CD21/35 immunostaining. Each dot in (b) represents one cell body, color-coded according to the occupied region in the follicle. Scale bars, 100 μm. c, BRC enumeration per region of B cell follicle. d, Quantification of the mean fluorescence intensity (MFI) of TdTom in each region of the B cell follicle (according to color-code). e,f, Merged images and single channels corresponding to Fig. 3c,d. Scale bars, 100 μm. Images are representative of at least two mice per condition. g, Confocal microscopy analysis of IgD, TdTom, CD21/35 and MYH11 staining in secondary B cell follicles of Cxcl13-Cre/TdTom EYFP mice. Images are representative of at least 5 immunized Cxcl13-Cre/TdTom mice. (c,d). N = 7 naïve Cxcl13-Cre/TdTom mice, 3 independent experiments, N = 5 VSV-immunized Cxcl13-Cre/TdTom mice, 2 independent experiments. Mean and SEM are depicted. P values as per one-way ANOVA with Tukey’s multiple comparisons test.
Extended Data Fig. 4
Extended Data Fig. 4. LTβR signaling in Cxcl13-Cre+ cells governs BRC maturation.
a,b, Representative immunofluorescence images of EYFP, TdTom and B220 staining in lymph nodes (a) and regions underpinning B cell aggregates (b) in naive Cxcl13-Cre/TdTom Ltbr fl/fl mice (Ltbr fl/fl). c, Enumeration of TdTom+ EYFP+ cells per lymph node (LN) in naive Cxcl13-Cre/TdTom control or Ltbr fl/fl mice. d, Quantification of the mean fluorescence intensity (MFI) of TdTom on EYFP+ cells from naive control or Ltbr fl/fl mice. e, Representative flow cytometry plots of MAdCAM1 and CD21/35 on TdTom+ EYFP+ cells from naive Ltbr fl/fl mice. Mean percentages and SEM are indicated. N = 14 mice, 4 independent experiments. f,g, Representative immunofluorescence images of EYFP, TdTom and B220 staining in lymph nodes (f) and regions underpinning B cell aggregates (g) in day 12 VSV-immunized Ltbr fl/fl mice. h, Enumeration of TdTom+ EYFP+ cells per lymph node in immunized control or Ltbr fl/fl mice. i, Quantification of the MFI of TdTom on EYFP+ cells from lymph nodes of immunized control or Ltbr fl/fl mice. j, Representative flow cytometry plots of MAdCAM1 and CD21/35 on TdTom+ EYFP+ cells from immunized Ltbr fl/fl mice. Mean percentages and SEM are indicated. N = 13 Ltbr fl/fl mice, 5 independent experiments. (a,b,f,g) Images are representative of 6 Ltbr fl/fl per condition. (c,d) N = 11 control mice and 13 Ltbr fl/fl mice; 4 independent experiments. (h,i) N = 16 control mice and 11 Ltbr fl/fl mice, 4 independent experiments. (c,d,h,i) Mean and SEM are indicated. P values as per two-tailed Mann Whitney test.
Extended Data Fig. 5
Extended Data Fig. 5. CXCL12 expression in in Cxcl13-Cre+ cells governs BRC topological remodeling.
a,b, Percentage (a) and number (b) per lymph node (LN) of the indicated hematopoietic cell populations in naive Cxcl13-Cre/TdTom control, Cxcl12 fl/fl and Ltbr fl/fl mice. N = 9 control mice, 7 Cxcl12 fl/fl, and 8 Ltbr fl/fl mice; 2 independent experiments. c-e, Scaled gene expression of naive versus immunized LZ FDC (c), DZ FDC (d) or TBRC (e). Red dots indicate differentially expressed genes with an adjusted p-value < 0.01 and an effect size (logFC) > 0.4. f, Left hand panels depict representative images of CD21/35 staining in immunized control and Cxcl12 fl/fl mice. The yellow dotted line demarcates the GC perimeter according to IgD staining (inset). Right hand panels depict the volumetric reconstruction of CD21/35 fluorescence and the division of the GC into quadrants. g, Quantification of the volume of CD21/35 per GC quadrant in control and Cxcl12 fl/fl mice. N = 5 control and 4 Cxcl12 fl/fl mice. Mean and SEM are indicated. h, GFP, CD21/35, PDLIM3 and B220 staining in lymph nodes from naïve Cxcl12-GFP mice. Data is representative of 2 Cxcl12-GFP mice. i, Representative images of PDLIM3, B220 and EYFP in naïve Cxcl13-Cre/TdTom control or Cxcl12 fl/fl mice. N = 3 mice per condition. j, Left hand panels show representative images of Ki67, TdTom and CD21/35 staining in immunized control and Cxcl12 fl/fl mice. The yellow dotted line demarcates the GC perimeter. Right hand panels depict Ki67 staining and the demarcation of GC quadrants. k, Enumeration of Ki67+ cells per GC quadrant in control and Cxcl12 fl/fl mice. N = 5 control and 5 Cxcl12 fl/fl mice. (a,b,g,k) Mean and SEM are indicated. P values as per two-way Anova with Bonferroni multiple comparisons test.
Extended Data Fig. 6
Extended Data Fig. 6. CXCL12 production by Cxcl13-Cre+ cells is required for efficient humoral immunity.
a, Enumeration of CD19+ cells per lymph node (LN) in naive or VSV-immunized control mice, or immunized Cxcl13-Cre/TdTom Cxcl12 fl/fl (Cxcl12 fl/fl) and Cxcl13-Cre/TdTom Ltbr fl/fl (Ltbr fl/fl) mice. N = 5 naive mice; 27 littermate control mice, 5 independent experiments; 20 Cxcl12 fl/fl, 5 independent experiments; 12 Ltbr fl/fl mice, 4 independent experiments. b,c, Representative flow cytometry plots and quantification of CD86- CXCR4+ DZ and CD86+ CXCR4- LZ germinal center CD19+ cells in immunized control, Cxcl12 fl/fl mice or Ltbr fl/fl mice. N = 20 immunized littermate controls, 5 independent experiments; 13 Cxcl12 fl/fl and 9 Ltbr fl/fl mice, 3 independent experiments. d,e, Expression of DAPI in GL7+ B cells and quantification of GC B cells in the indicated cell cycle stages. N = 15 littermate control mice, 3 independent experiments; 4 Cxcl12 fl/fl mice, 2 experiments; 13 Ltbr fl/fl mice, 2 experiments. f, Representative flow cytometry plots of 7AAD and Annexin V incorporation by GL7+ B cells in immunized littermate control, Cxcl12 fl/fl mice or Ltbr fl/fl mice. g, Quantification of the mean fluorescence intensity (MFI) of Annexin V on GL7+ B cells from littermate control, Cxcl12 fl/fl mice or Ltbr fl/fl mice. (f,g) N = 10 littermate control mice, 10 Cxcl12 fl/fl mice and 9 Ltbr fl/fl mice per group; 2 independent experiments. h, GL7, CD138, B220 and CD21/35 staining of lymph nodes from Ltbr fl/fl mice on day 8 post VSV-immunization. Data is representative of 3 Ltbr fl/fl mice. (a,c,e,f,g) Mean and SEM are shown. P values as per one-way Anova with Tukey’s multiple comparisons test.
Extended Data Fig. 7
Extended Data Fig. 7. Cxcl12-proficient Cxcl13-Cre+ cells govern high-affinity humoral immunity to complex protein antigens and haptens.
a, An example of reconstructed clonal lineage trees based on B cell receptor sequencing for the quantification of maximum branch lengths. b, Quantification of the frequency of GL7+ CD19+ cells in draining lymph nodes of littermate control or Cxcl13-Cre/TdTom Cxcl12 fl/fl (Cxcl12 fl/fl) mice 12 day following NP-KLH immunization. N = 10 control mice and 11 Cxcl12 fl/fl mice; 2 independent experiments. c,d, Quantification of total (c) or high-affinity (d) NP-specific serum IgG titers from control or Cxcl12 fl/fl mice 12 days following NP-KLH immunization. N = 8 control mice and 11 Cxcl12 fl/fl mice; 2 independent experiments. e, Quantification of the proportion of GC B cells harboring the high-affinity W33L mutation in control and Cxcl12 fl/fl mice. (b-d) Mean and SEM are shown. P values as per two-tailed Mann-Whitney test. (e) Data is representative of two independent mice per condition; the number of clonotypes is indicated. P values as per two-tailed Wilcoxon test.
Extended Data Fig. 8
Extended Data Fig. 8. ScRNA-Seq of germinal center B cells from VSV immunized mice.
a, Sorting strategy for scRNA-seq of GC B cells. b, Top marker genes for each subset, and normalized expression scores (NES) of top GSEA pathways reflected by each subset’s marker genes. c, Median cell cycle scores. The middle line demarcates the median; box limits demarcate the upper and lower quartiles; whiskers depict the 1.5x interquartile range and points indicate outliers. (b-c) scRNA-seq data is representative of 4140 cells from littermate control mice and 4677 cells from Cxcl12 fl/fl mice; 2 biological replicates over 2 independent experiments.
Extended Data Fig. 9
Extended Data Fig. 9. CXCL12 regulates the gene expression profile of B cells and positioning of TFH within the GC.
a, Pseudotime ordering of GC B cells. Violin plots indicate the density distribution of cells. b, Average gene expression of GC marker genes along inferred pseudotime for littermate control (black line) and Cxcl13-Cre/TdTom Cxcl12 fl/fl (red line) mice. c, The relative abundance of cells expressing the indicated genes in control and Cxcl12 fl/fl mice. d, Representative flow cytometry plots of the indicated markers in GL7+ B cells from littermate control or Cxcl12 fl/fl mice, GL7- non-GC B cells and FMO controls. e, Quantification of the mean fluorescence intensity (MFI) of the indicated markers in CD86+ CXCR4- LZ and CD86- CXCR4+ DZ B cells from control (black boxes) or Cxcl12 fl/fl (white boxes) mice. AKT: N = 5 mice per condition; BIM: N = 6 control and 7 Cxcl12 fl/fl mice; Bcl6: N = 7 control and 9 Cxcl12 fl/fl mice; all over 2 independent experiments. f, Representative flow cytometry plots and mean percentage and SEM of PD-1+ Bcl6+ CD4+ cells in immunized control and Cxcl12 fl/fl mice. g, Enumeration of PD-1+ Bcl6+ CD4+ cells per lymph node (LN) in immunized control or Cxcl12 fl/fl mice. N = 15 control and 13 Cxcl12 fl/fl mice; 3 independent experiments. h, TdTom, PD-1 and CD4 staining in immunized Cxcl13-Cre/TdTom mice. The dotted line demarcates the GC perimeter, which is divided into four quadrants for manual PD-1+ cell enumeration. Scale bar, 100 μm. Images are representative of 2 mice. (a-c) scRNA-seq data is representative of 4140 cells from littermate control mice and 4677 cells from Cxcl12 fl/fl mice; 2 biological replicates over 2 independent experiments. (c) Statistical significance calculated using the Pearson’s Chi-squared test with Bonferroni multiple comparisons test. (e,g) Mean and SEM are shown. (e) P values as per one-way ANOVA with Tukey’s multiple comparisons test. (g) P values as per two-tailed Mann-Whitney.
Figure 1
Figure 1. Cxcl13 expression facilitates tracking of B cell-interacting reticular cells in murine lymph nodes.
a,b, Representative immunofluorescence images of inguinal lymph nodes from naive Cxcl13-Cre/TdTom EYFP+ mice. B220 (a) and IgD (b) immunostainings demarcate the primary B cell follicle. Scale bars, 500 μm (a), 100 μm (b). c,d, Representative immunofluorescence images of inguinal lymph nodes from day 12 VSV-immunized Cxcl13-Cre/TdTom EYFP+ mice. B220 immunostaining demarcates the B cell follicle (c) and IgD immunostaining demarcates the germinal center (d). Scale bars, 500 μm (c), 100 μm (d). e-h, Flow cytometric analysis of Cxcl13-Cre/TdTom transgene-targeted cells from naive (e,g) or day 12 VSV-immunized (f,h) mice. Relative expression levels of the indicated markers by EYFP+ cells from naive (g) and immunized (h) mice. Cells are gated on non-endothelial, non-hematopoietic cells. i, Overlay of TdTom+ EYFP+ subsets as gated in (e) and (g) on tSNE plots of total EYFP+ cells from naive and immunized Cxcl13-Cre/TdTom EYFP mice. j, Quantification of BRC subsets as demarcated by MAdCAM1 and CD21/35 expression in naive and immunized mice. (a-d) Images are representative of at least 10 mice per condition. (e-j) N= 14 naive and 19 VSV-immunized Cxcl13-Cre/TdTom EYFP+ mice, 6 independent experiments. (e,f,j) Mean and SEM are indicated. (j) P values as per one-way ANOVA with Tukey’s multiple comparisons test.
Figure 2
Figure 2. Single-cell transcriptomics analysis of lymph node BRC.
a, UMAP of TdTom-expressing lymph node reticular cells. The left-hand panel shows merged data from naive and immunized mice; condition-specific UMAP plots are depicted in the middle panel, and the relative subset abundances are depicted in the right-hand panel. b, Feature plots depicting the gene expression of chemokines and known FDC and MRC markers. c, Feature plots and top subset-specific marker genes for the indicated BRC clusters. d, Confocal microscopy analysis of the positioning and phenotype of BRC subsets in naïve Cxcl13-Cre/TdTom mice. Tissues were stained with the indicated subset-defining markers based on scRNA-seq analysis. Scale bars, 500 μm and 50 μm. Images are representative of at least three mice per marker. (a-c) ScRNA-seq data represents 5418 Cxcl13-Cre+ cells, N = 3 biological replicates, 2 independent experiments for naive BRC, N = 4 biological replicates, 3 independent experiments for BRC from immunized mice.
Figure 3
Figure 3. Phenotypic adaptations of FDC subsets during infection-induced lymph node remodeling.
a, UMAP plot of re-embedded FDC1 and FDC2 subsets. The relative proportions of FDC1 and FDC2 are summarized in pie charts. Herein, FDC1 and FDC2 are referred to as LZ and DZ FDC, respectively. b, Feature plots of Cr2 and Cxcl12 gene expression in re-embedded FDC subsets. c,d, Representative immunofluorescence images of lymph node B cell follicles from naive or day 12 VSV-immunized Cxcl12-GFP mice. White boxes demarcate the position of GFP- CD21/35+ LZ FDC and GFP+ CD21/35+ DZ FDC; dotted line demarcates the perimeter of the B cell follicle. Scale bars, 100 μm. e, Heatmap of the scaled gene expression of LZ and DZ FDC FDC marker and curated genes including fibroblastic reticular cell (FRC) chemokines and survival factors, and extracellular matrix (ECM) components shown for TBRC, DZ and LZ FDC, and MRC. f,g, Scatterplot of the average scaled gene expression of genes expressed in naive or immunized LZ or DZ FDC subsets. Red dots indicate differentially expressed genes that have an adjusted p-value < 0.01 and an effect size (logFC) > 0.4. h, Confocal microscopy analysis of LZ FDC markers in secondary B cell follicles. Scale bars, 100 μm and 20 μm. Images are representative of five mice per marker in Cxcl13-Cre/TdTom mice. (a,b,e-g) N = 1233 cells. ScRNA-seq data is as per Fig. 2, representative of 3 biological replicates from 2 independent experiments for naive BRC, and 4 biological replicates from 3 independent experiments for BRC from immunized mice. (c,d) Images are representative of 4 naive and 2 VSV-immunized Cxcl12-GFP mice.
Figure 4
Figure 4. Transcriptional and topological changes in Cxcl13-Cre/TdTom Cxcl12 fl/fl lymph nodes.
a,b, Representative lymph node (a) and B cell follicle (b) overview in naive Cxcl13-Cre/TdTom EYFP Cxcl12 fl/fl mice (Cxcl12 fl/fl). Scale bars, 500 μm (a), 100 μm (b). N = 4. c, TdTom+ cell enumeration in naive Cxcl13-Cre/TdTom EYFP control or Cxcl12 fl/fl mice. N = 12 control Cxcl13-Cre/TdTom EYFP mice and 4 Cxcl12 fl/fl mice, 2 independent experiments. d, Representative flow cytometry plot of MAdCAM1 and CD21/35 expression by TdTom+ cells from naive Cxcl12 fl/fl mice. N = 12 Cxcl12 fl/fl mice, 3 independent experiments. e,f, Representative lymph node (e) and B cell follicle (f) overview from VSV-immunized Cxcl12 fl/fl mice. Scale bars, 500 μm (e), 100 μm (f). N = 8 mice, 3 independent experiments. g, TdTom+ cell enumeration in immunized control or Cxcl12 fl/fl mice. N = 6 control, 8 Cxcl12 fl/fl mice, 2 independent experiments. h, Representative flow cytometry plot of MAdCAM1 and CD21/35 expressing BRCs from immunized Cxcl12 fl/fl mice. N = 9 Cxcl12 fl/fl mice, 2 independent experiments. i, UMAP plot and relative BRC subset abundance of TdTom+ cells from immunized Cxcl12 fl/fl mice. j, Scaled gene expression of FDC marker and curated genes in immunized control and Cxcl12 fl/fl mice. k,l, Representative images of CD21/35 and FCER2A in control and Cxcl12 fl/fl mice. Dotted yellow lines indicate the GC perimeter and dotted red lines indicate the axis of CD21/35 and FCER2A intensity measurement. Scale bars, 100 μm. m,n, Representative images of Ki67+ B220+ cells in control or Cxcl12 fl/fl mice. Scale bars, 50 μm. (c,g) Mean percentages and SEM are indicated; P values as per two-tailed Mann Whitney Test. (d,h) Mean percentages and SEM are indicated; P values as per one-way ANOVA with Tukey’s multiple comparisons test. (i,j) scRNA-Seq represents 487 Cxcl12 fl/fl BRC; 3 independent experiments. (k-n) Images are representative of 5 mice per group.
Figure 5
Figure 5. The magnitude of germinal center B cell responses is attenuated in mice with Ltbr or Cxcl12 deficiency in Cxcl13-Cre+ cells.
a, Representative flow cytometric plots of GL7 and CD38 expression on CD19+ cells from day 12 VSV-immunized littermate control, Cxcl13-Cre/TdTom Cxcl12 fl/fl mice (Cxcl12 fl/fl), or Cxcl13-Cre/TdTom Ltbr fl/fl (Ltbr fl/fl) mice. b, Quantification of the frequency of GL7+CD38+CD19+ cells from control, Cxcl12 fl/fl or Ltbr fl/fl mice at the indicated time points. c, Enumeration of GL7+CD38+CD19+ cells per lymph node (LN). d, Representative flow cytometry plots of CD138 and B220 expression on CD19+ cells. e, Quantification of the frequency of B220+CD138+CD19+ cells from control, Cxcl12 fl/fl or Ltbr fl/fl mice at the indicated time points. f, Enumeration of B220+CD138+CD19+ cells per LN. g,h, GL7, CD138, B220 and CD21/35 immunostaining in lymph nodes from control or Cxcl12 fl/fl mice on day 8 post immunization. White dotted line indicates follicle boundaries, arrows point to extra-follicular CD138+ cells. Scale bars, 500 μm and 100 μm. Images are representative of 6 mice per group, 2 independent experiments. (a-f) Mean and SEM are indicated. (b,c) Naïve: N = 5; Day 6: N = 15 control, 9 Cxcl12 fl/fl, 9 Ltbr fl/fl mice, 3 independent experiments; Day 8: N = 9 control, 6 Cxcl12 fl/fl, 7 Ltbr fl/fl mice, 3 independent experiments; Day 12: N = 20 control mice, 5 independent experiments, 15 Cxcl12 fl/fl mice, 4 independent experiments, 9 Ltbr fl/fl mice, 3 independent experiments. (e,f) Naïve: N = 4; Day 6: N = 15 control, 9 Cxcl12 fl/fl, 9 Ltbr fl/fl mice, 3 independent experiments; Day 8: N = 14 control, 6 Cxcl12 fl/fl, 9 Ltbr fl/fl mice, 3 independent experiments; Day 12: N = 28 control mice, 5 independent experiments, 15 Cxcl12 fl/fl mice, 4 independent experiments, 7 Ltbr fl/fl mice, 3 independent experiments. (b,c,e,f) P values as per one-way ANOVA with Tukey’s multiple comparisons test.
Figure 6
Figure 6. Impaired antigen-specific humoral immunity and somatic hypermutation in mice with Ltbr or Cxcl12 deficiency in Cxcl13-Cre+ cells.
a,b, Enumeration of VSV-specific IgM (a) and IgG (b) antibody secreting cells (ASC) per lymph node (LN) in control, Cxcl12 fl/fl or Ltbr fl/fl mice 12 days following VSV immunization. Mean and SEM are indicated. N = 16 littermate controls over 5 independent experiments, and 14 Cxcl12 fl/fl mice, 7 Ltbr fl/fl mice over 3 independent experiments. c, Quantification of VSV-specific neutralizing antibody titers in the sera of control, Cxcl12 fl/fl or Ltbr fl/fl mice on day 12 following immunization. Mean and SEM are indicated. N = 18 littermate controls, 16 Cxcl12 fl/fl mice, and 15 Ltbr fl/fl mice; 3 independent experiments. d,e, Quantification of low (d) and high (e) VSV-specific IgG serum titers in control, Cxcl12 fl/fl or Ltbr fl/fl mice on day 12 following immunization. Mean and SEM are indicated. N = 16 littermate controls, 17 Cxcl12 fl/fl mice and 13 Ltbr fl/fl mice; 3 independent experiments. f,g, Quantification of the relative abundance of GC B cell clonotypes with the indicated number of mutations for each control and Cxcl12 fl/fl mice, depicted as a histogram (f) and in a pie chart (g). h, Distribution of the relative abundance of GC B cell clonotypes with the indicated maximum number of steps in reconstructed clonal lineages. (a-e) Mean and SEM are indicated. P values as per one-way ANOVA with Tukey’s multiple comparisons test. (f-h) BCR scRNA-seq is representative of 4275 B cell clonotypes from littermate control mice and 3865 clonotypes from Cxcl13-Cre/TdTom EYFP Cxcl12 fl/fl mice. P values as per two-tailed Mann-Whitney.
Figure 7
Figure 7. Effect of Cxcl12-deficiency in Cxcl13-Cre+ cells on germinal center B and Th cells.
a, UMAP plot of GL7+cells from littermate control mice and Cxcl13-Cre/TdTom EYFP Cxcl12 fl/fl mice (Cxcl12 fl/fl) on day 12 following VSV. Pie charts depict the relative abundance of each cluster in control or Cxcl12 fl/fl mice. b, Average gene expression of key GC marker genes along inferred pseudotime for control mice (black line) and Cxcl12 fl/fl mice (red line). c, Representative flow cytometric plots of the indicated transcription factors in GL7+ CD38- GC B cells or GL7- CD38+ non-GC B cells. d, Quantification of the mean fluorescence intensity (MFI) of the indicated transcription factors in CD86+ CXCR4- LZ or CD86- CXCR4+ DZ GC B cells from control (black boxes) or Cxcl12 fl/fl (white boxes) mice. MYC: N = 9 mice per condition; IκBα: N = 3 control and 7 Cxcl12 fl/fl mice, FOXO1: N = 8 control and 9 Cxcl12 fl/fl mice; BACH2: N = 8 control and 6 Cxcl12 fl/fl mice; all over 2 independent experiments. e, Representative immunofluorescence images of PD1 staining within the TdTom-demarcated BRC network in lymph nodes from immunized control or Cxcl12 fl/fl mice. Scale bars, 100 μm. f, Quantification of the relative distribution of PD-1+ cells within the GC of immunized Cxcl13-Cre/TdTom control (black bars) or Cxcl12 fl/fl mice (white bars). Quadrants are counted starting from proximity to the sub-capsular sinus (Q1) to the T cell zone (Q4). N = 7 control Cxcl13-Cre/TdTom EYFP mice, 8 Cxcl12 fl/fl mice; 3 independent experiments. (a,b) scRNA-seq data is representative of 4140 cells from littermate control mice, and 4677 cells from Cxcl12 fl/fl mice; 2 biological replicates over 2 independent experiments. (d,f) Mean and SEM are indicated. (d) P values as per one-way Anova with Tukey’s multiple comparisons test. (f) P values as per two-way Anova with Tukey’s multiple comparisons test.

Comment in

References

    1. Schwickert TA, et al. A dynamic T cell-limited checkpoint regulates affinity-dependent B cell entry into the germinal center. J Exp Med. 2011;208:1243–1252. - PMC - PubMed
    1. Sander S, et al. PI3 Kinase and FOXO1 Transcription Factor Activity Differentially Control B Cells in the Germinal Center Light and Dark Zones. Immunity. 2015;43:1075–1086. - PubMed
    1. Dominguez-Sola D, et al. The FOXO1 Transcription Factor Instructs the Germinal Center Dark Zone Program. Immunity. 2015;43:1064–1074. - PubMed
    1. Shinnakasu R, et al. Regulated selection of germinal-center cells into the memory B cell compartment. Nat Immunol. 2016;17:861–869. - PubMed
    1. Gitlin AD, Shulman Z, Nussenzweig MC. Clonal selection in the germinal centre by regulated proliferation and hypermutation. Nature. 2014;509:637–640. - PMC - PubMed

Publication types

LinkOut - more resources