. 2020 Jul;24(13):7563-7575.
doi: 10.1111/jcmm.15390. Epub 2020 May 18.

p75NTR optimizes the osteogenic potential of human periodontal ligament stem cells by up-regulating α1 integrin expression

Affiliations

p75NTR optimizes the osteogenic potential of human periodontal ligament stem cells by up-regulating α1 integrin expression

Jun Li et al. J Cell Mol Med. 2020 Jul.

Abstract

Human periodontal ligament stem cells (hPDLSCs) are a promising source in regenerative medicine. Due to the complexity and heterogeneity of hPDLSCs, it is critical to isolate homogeneous hPDLSCs with high regenerative potential. In this study, p75 neurotrophin receptor (p75NTR) was used to isolate p75NTR+ and p75NTR- hPDLSCs by fluorescence-activated cell sorting. Differences in osteogenic differentiation among p75NTR+ , p75NTR- and unsorted hPDLSCs were observed. Differential gene expression profiles between p75NTR+ and p75NTR- hPDLSCs were analysed by RNA sequencing. α1 Integrin (ITGA1) small interfering RNA and ITGA1-overexpressing adenovirus were used to transfect p75NTR+ and p75NTR- hPDLSCs. The results showed that p75NTR+ hPDLSCs demonstrated superior osteogenic capacity than p75NTR- and unsorted hPDLSCs. Differentially expressed genes between p75NTR+ and p75NTR- hPDLSCs were highly involved in the extracellular matrix-receptor interaction signalling pathway, and p75NTR+ hPDLSCs expressed higher ITGA1 levels than p75NTR- hPDLSCs. ITGA1 silencing inhibited the osteogenic differentiation of p75NTR+ hPDLSCs, while ITGA1 overexpression enhanced the osteogenic differentiation of p75NTR- hPDLSCs. These findings indicate that p75NTR optimizes the osteogenic potential of hPDLSCs by up-regulating ITGA1 expression, suggesting that p75NTR can be used as a novel cell surface marker to identify and purify hPDLSCs to promote their applications in regenerative medicine.

Keywords: cell surface marker; human periodontal ligament stem cells; osteogenic differentiation; regenerative medicine; signalling pathway.


Conflict of interest statement

The authors confirm that there are no conflicts of interest.

Figures

Figure 1
Figure 1
Sorting of p75NTR+ and p75NTR hPDLSCs from hPDLSCs isolated from periodontal ligament. (A) Primary hPDLSCs were observed by optical microscopy; scale bar = 100 μm. (B) Cells were sorted by fluorescence‐activated cell sorting. (C) The morphologies of p75NTR+, p75NTR and unsorted hPDLSCs were observed by optical microscopy; scale bar = 100 μm
Figure 2
Figure 2
Flow cytometry analysis of the expression of cell surface markers. These cell surface markers related to p75NTR or mesenchymal (CD44, CD73, CD90 and CD105) or negative (CD45, CD34, CD11b, CD19 and HLA‐DR)
Figure 3
Figure 3
Confocal laser scanning microscopy results of the expression of p75NTR in p75NTR+, p75NTR and unsorted hPDLSCs; scale bar = 50 μm
Figure 4
Figure 4
The adipogenic, chondrogenic and osteogenic differentiation among p75NTR+, p75NTR and unsorted hPDLSCs. (A‐B) p75NTR+, p75NTR and unsorted hPDLSCs were treated with adipogenic or chondrogenic induction medium for 21 days. (A) The lipids were photographed after Oil Red O staining; scale bar = 50 μm. (B) The Alcian blue staining intensity was observed by optical microscopy; scale bar = 200 μm. (C–F) p75NTR+, p75NTR and unsorted hPDLSCs were treated with osteogenic induction medium for 7 days or 21 days. (C) On day 7, the ALP staining intensity was observed by optical microscopy; scale bar = 100 μm. (D) On day 21, the mineralized nodules were photographed after Alizarin Red staining; scale bar = 100 μm. (E, F) On day 0 and day 7, the (E) mRNA and (F) protein levels of p75NTR, ALP and RUNX2 were detected by qPCR and Western blot, respectively, using GAPDH as a control. *P < 0.05; ns, no significant difference
Figure 5
Figure 5
Differential expression genes between p75NTR+ and p75NTR hPDLSCs. (A) Heatmap of differential genes. (B) Pathway mapping of differential expression genes. (C) The mRNA levels of ITGA1, ITGA7 and ITGA7 were detected by qPCR, using GAPDH as a control. *P < 0.05; ns, no significant difference
Figure 6
Figure 6
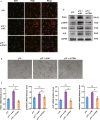
The differences in osteogenic differentiation among p75NTR hPDLSCs, p75NTR+ hPDLSCs transfected with negative control siRNA and p75NTR+ hPDLSCs transfected with ITGA1 siRNA. (A) Confocal laser scanning microscopy results of the expression of ITGA1; scale bar = 50 μm. (B–D) p75NTR hPDLSCs, p75NTR+ hPDLSCs transfected with negative control siRNA and p75NTR+ hPDLSCs transfected with ITGA1 siRNA were treated with osteogenic induction medium for 3 days. (B) On day 3, the ALP staining intensity was observed by optical microscopy; scale bar = 100 μm. (C, D) On day 3, the (C) mRNA and (D) protein levels of ITGA1, p75NTR, ALP and RUNX2 were detected by qPCR and Western blot, respectively, using GAPDH as a control. *P < 0.05; ns, no significant difference; si‐NC, negative control siRNA; si‐ITGA1, ITGA1 siRNA
Figure 7
Figure 7
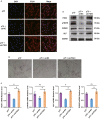
The differences in osteogenic differentiation among p75NTR+ hPDLSCs, p75NTR hPDLSCs transfected with negative control–overexpressing adenovirus and p75NTR hPDLSCs transfected with ITGA1‐overexpressing adenovirus. (A) Confocal laser scanning microscopy results of the expression of ITGA1; scale bar = 50 μm. (B–D) p75NTR+ hPDLSCs, p75NTR hPDLSCs transfected with negative control–overexpressing adenovirus and p75NTR hPDLSCs transfected with ITGA1‐overexpressing adenovirus were treated with osteogenic induction medium for 3 days. (B) On day 3, the ALP staining intensity was observed by optical microscopy; scale bar = 100 μm. (C, D) On day 3, the (C) mRNA and (D) protein levels of ITGA1, p75NTR, ALP and RUNX2 were detected by qPCR and Western blot, respectively, using GAPDH as a control. *P < 0.05; ns, no significant difference; ad‐NC, negative control–overexpressing adenovirus; ad‐ITGA1, ITGA1‐overexpressing adenovirus

Similar articles

Cited by

References

    1. Trubiani O, Pizzicannella J, Caputi S, et al. Periodontal ligament stem cells: Current knowledge and future perspectives. Stem Cells Dev. 2019;28:995‐1003. - PubMed
    1. Seo B‐M, Miura M, Gronthos S, et al. Investigation of multipotent postnatal stem cells from human periodontal ligament. Lancet. 2004;364:149‐155. - PubMed
    1. Lei M, Li K, Li B, et al. Mesenchymal stem cell characteristics of dental pulp and periodontal ligament stem cells after in vivo transplantation. Biomaterials. 2014;35:6332‐6343. - PubMed
    1. Liu J, Zhao Z, Ruan J, et al. Stem cells in the periodontal ligament differentiated into osteogenic, fibrogenic and cementogenic lineages for the regeneration of the periodontal complex. J Dent. 2020;92:103259‐. - PubMed
    1. Trubiani O, Marconi GD, Pierdomenico SD, et al. Human oral stem cells, biomaterials and extracellular vesicles: A promising tool in bone tissue repair. Int J Mol Sci. 2019;20:4987 - PMC - PubMed

Publication types