. 2021 Feb;20(2):e12667.
doi: 10.1111/gbb.12667. Epub 2020 Jun 17.

A breeding strategy to identify modifiers of high genetic risk for methamphetamine intake

Affiliations

A breeding strategy to identify modifiers of high genetic risk for methamphetamine intake

Cheryl Reed et al. Genes Brain Behav. 2021 Feb.

Abstract

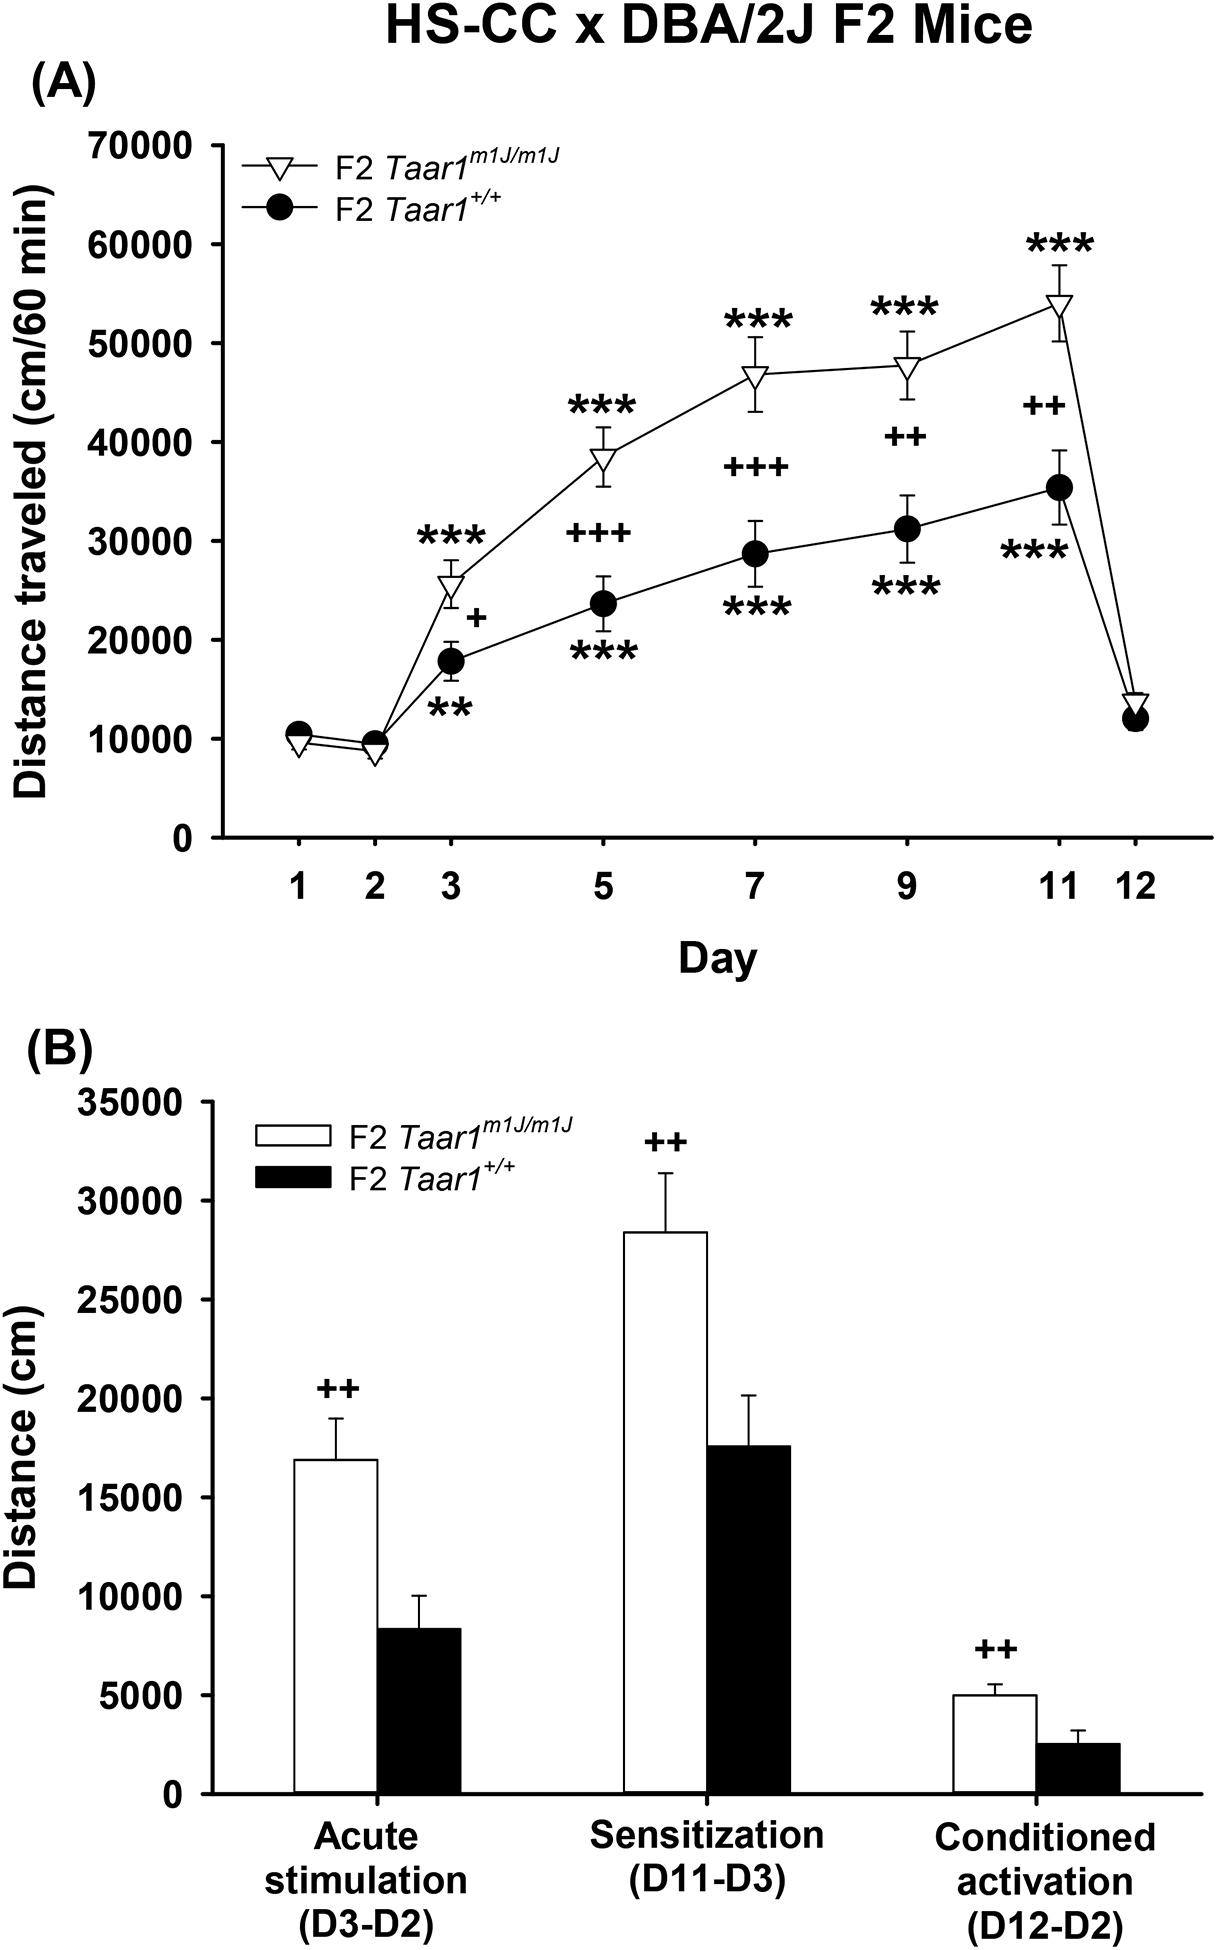
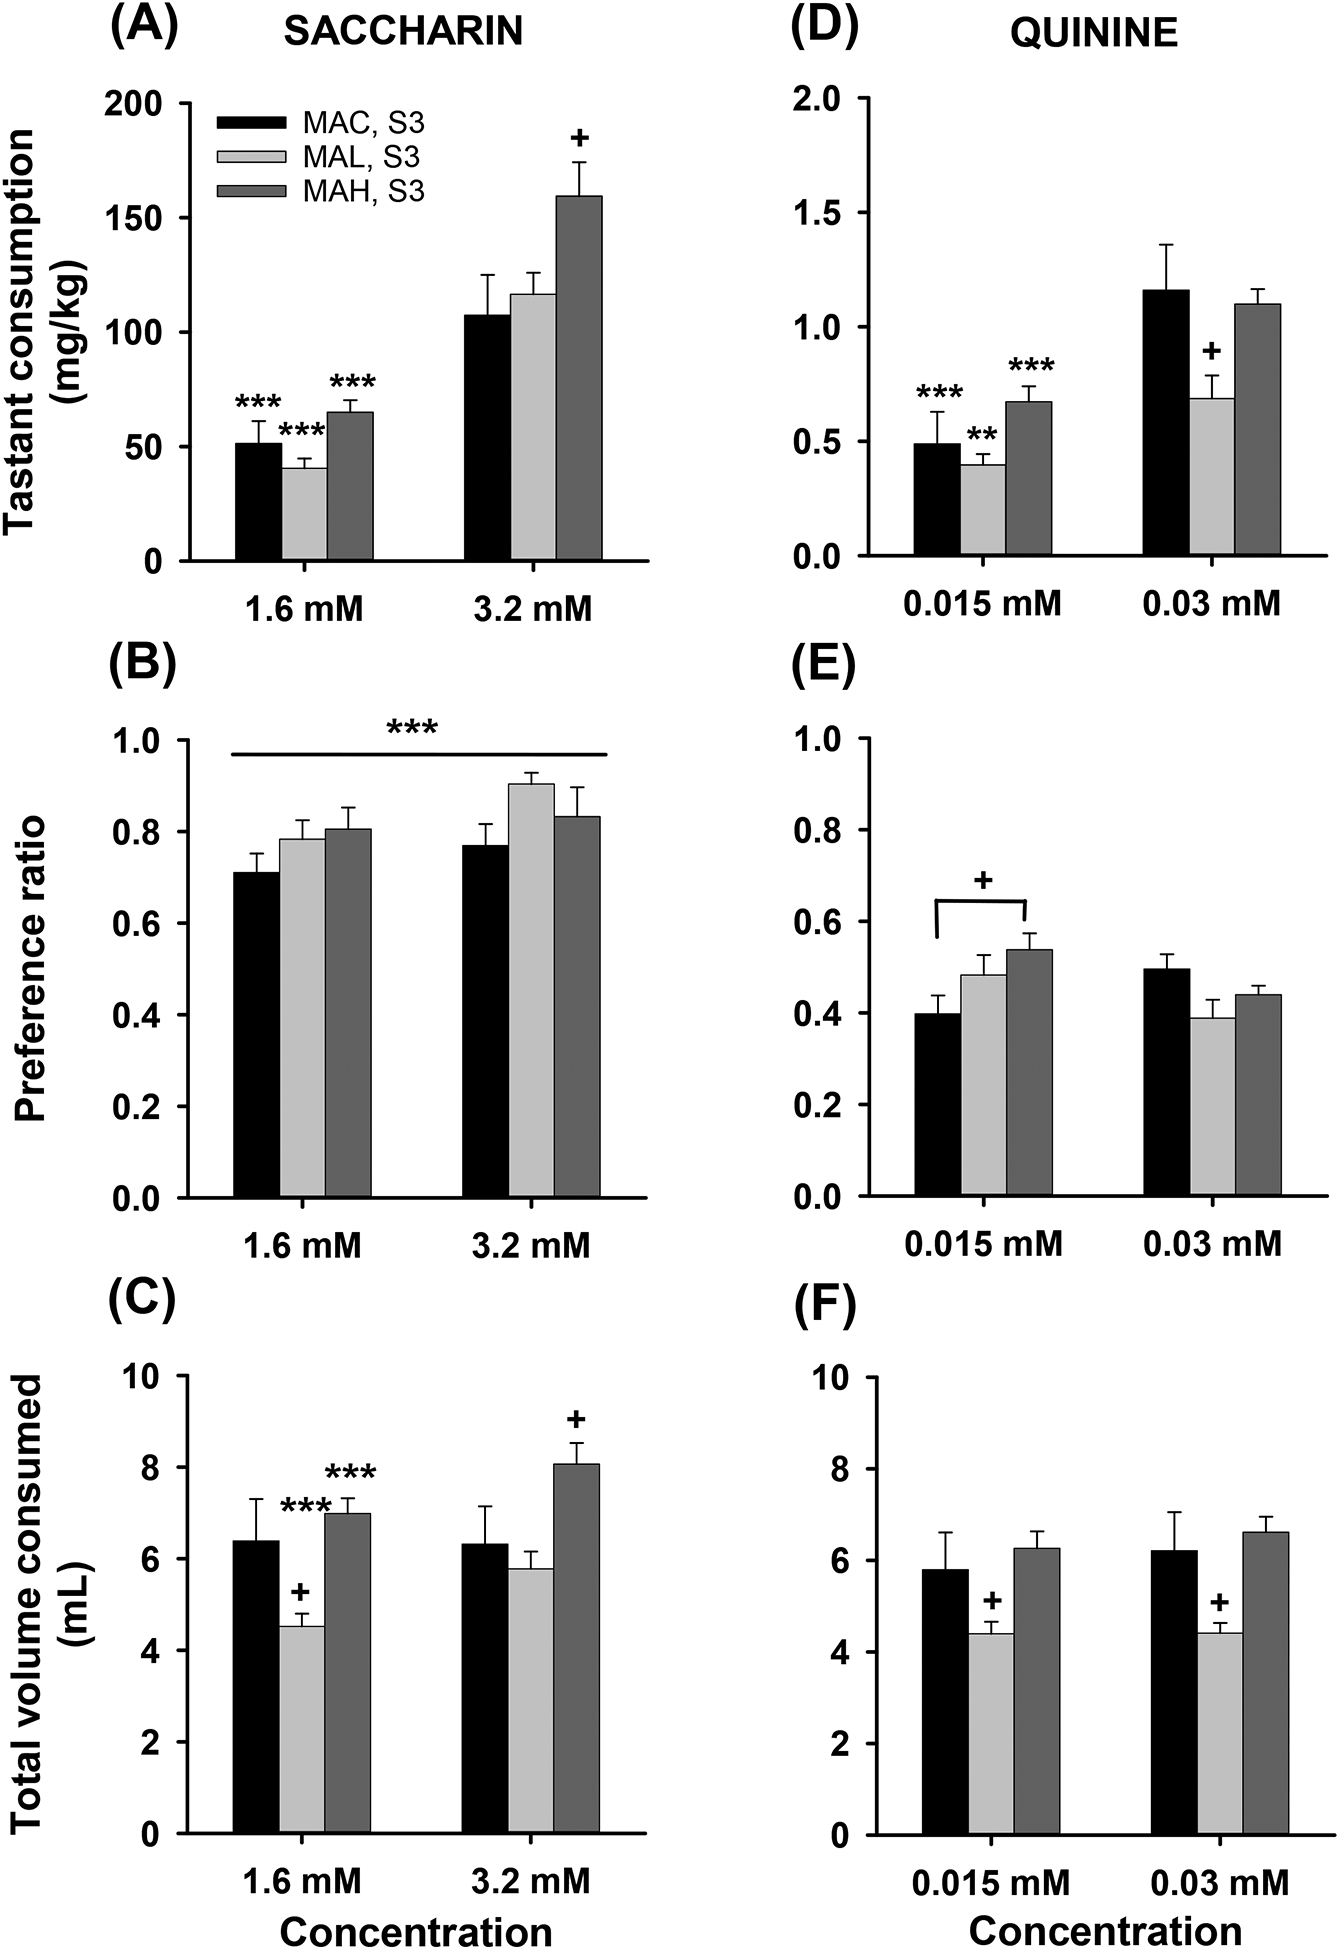
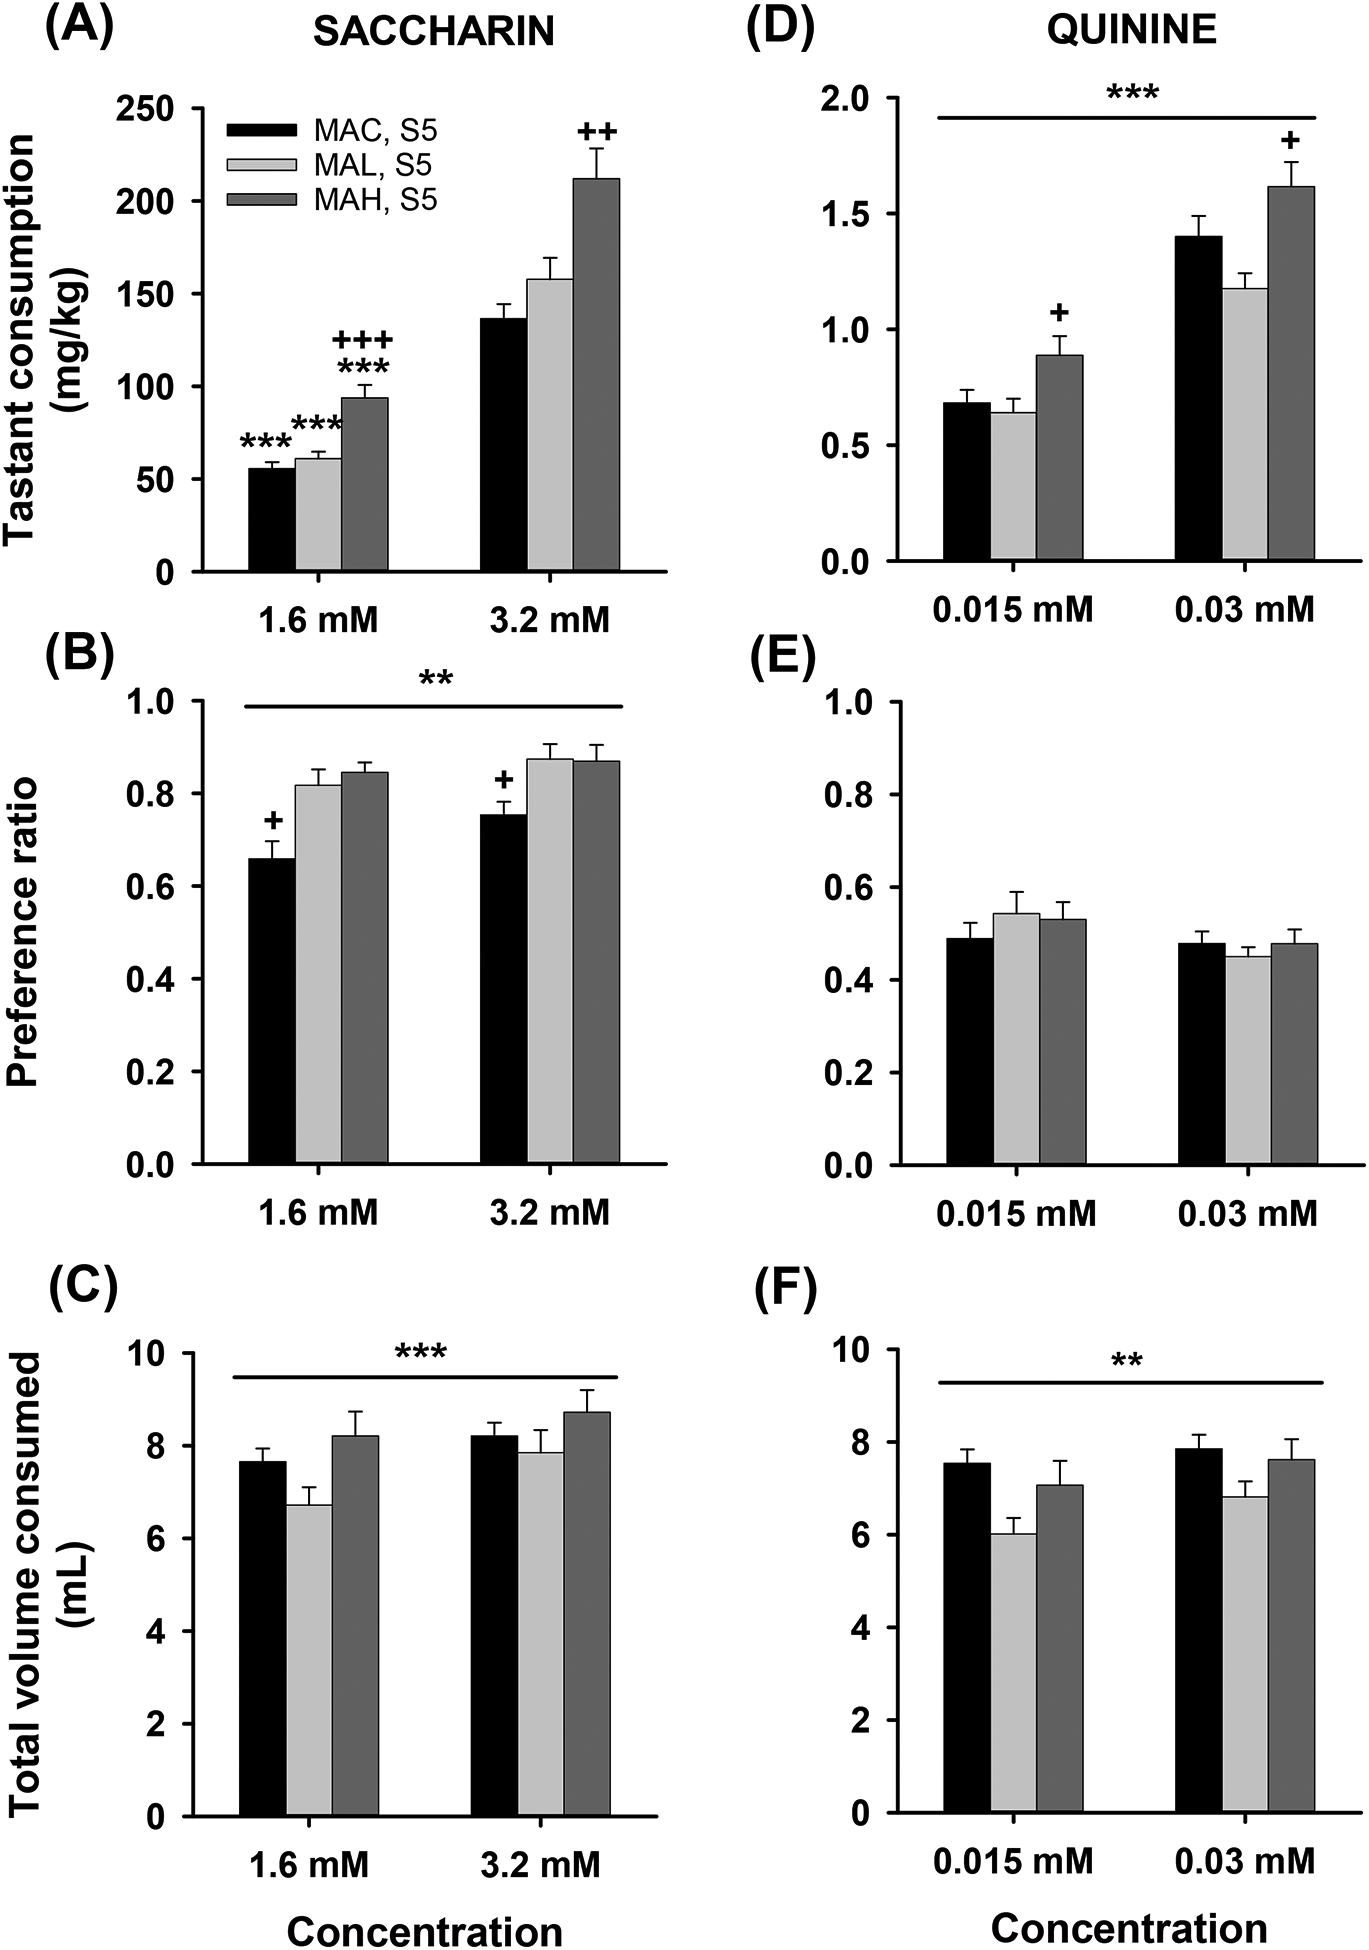
Trace amine-associated receptor 1 (Taar1) impacts methamphetamine (MA) intake. A mutant allele (Taar1m1J ) derived from the DBA/2J mouse strain codes for a non-functional receptor, and Taar1m1J/m1J mice consume more MA than mice possessing the reference Taar1+ allele. To study the impact of this mutation in a genetically diverse population, heterogeneous stock-collaborative cross (HS-CC) mice, the product of an eight-way cross of standard and wild-derived strains, were tested for MA intake. HS-CC had low MA intake, so an HS-CC by DBA/2J strain F2 intercross was created to transfer the mutant allele onto the diverse background, and used for selective breeding. To study residual variation in MA intake existing in Taar1m1J/m1J mice, selective breeding for higher (MAH) vs lower (MAL) MA intake was initiated from Taar1m1J/m1J F2 individuals; a control line of Taar1+/+ individuals (MAC) was retained. The lines were also examined for MA-induced locomotor and thermal responses, and fluid and tastant consumption. Taar1m1J/m1J F2 mice consumed significantly more MA than Taar1+/+ F2 mice. Response to selection was significant by generation 2 and there were corresponding differences in fluid consumed. Fluid consumption was not different in non-MA drinking studies. Taar1m1J/m1J genotype (MAL or MAH vs MAC mice) was associated with heighted MA locomotor and reduced hypothermic responses. MAL mice exhibited greater sensitization than MAH mice, but the selected lines did not consistently differ for thermal or tastant phenotypes. Residual variation among high-risk Taar1m1J/m1J mice appears to involve mechanisms associated with neuroadaptation to MA, but not sensitivity to hypothermic effects of MA.

Keywords: hypothermia; psychostimulant; quinine; saccharin; selective breeding; self-administration; sensitization; trace amine-associated receptor 1; two-bottle choice.


Figures

Figure 1.
Figure 1.
Flowchart detailing the methods used to create selected lines from a founding population of heterogeneous stock-collaborative cross (HS-CC) mice crossed with the DBA/2J (D2) strain (F1) and then their offspring crossed again (F2) for the purpose of introducing the Taar1m1J/m1J mutation into the HS-CC stock and generating mice homozygous for each Taar1 allele. The resulting F2 offspring were genotyped for Taar1, and then 120 Taar1m1J/m1J (60/sex) and 118 Taar1+/+ (59/sex) mice were tested for voluntary methamphetamine (MA) intake. Selective breeding ensued from the highest and lowest MA consuming Taar1m1J/m1J mice to establish the MAH and MAL lines, respectively. Breeders for the control line were chosen across the narrow range of MA intake values for the Taar1+/+ mice. Colors in the chart match those designating specific genotypes in other figures.
Figure 2.
Figure 2.
HS-CC mice, which do not possess the Taar1m1J/m1J genotype, exhibit low levels of MA intake and preference in a two-bottle choice MA drinking procedure. Means ± SEM for a) MA intake (mg/kg/18h), b) preference ratio (ml from MA tube/total ml), and c) total volume consumed (ml/18h) during the time that the 20 and 40 mg/l MA concentrations were available. Also shown are frequency distributions for mg/kg MA consumed for the d) 20 mg/l and e) 40 mg/l MA concentrations, illustrating low intake and variation. N=57 (27 male and 30 female). ***p<.001 for the effect of MA concentration in b and the main effect of sex in c.
Figure 3.
Figure 3.
HS-CC × DBA/2J F2 mice possessing the Taar1m1J/m1J genotype exhibit higher levels of MA intake and preference than those with the Taar1+/+ genotype in a two-bottle choice MA drinking procedure. Means ± SEM for a) MA intake (mg/kg/18h), b) preference ratio (ml from MA tube/total ml), and c) total volume consumed (ml/18h) during the time that the 20 and 40 mg/l MA concentrations were available for Taar1m1J/m1J and Taar1+/+ F2 mice. Also shown are frequency distributions for mg/kg MA consumed for the d) 20 mg/l and e) 40 mg/l MA concentrations, illustrating higher intake and variation in the Taar1m1J/m1J mice. N=237 (58–60/sex/genotype). ***p<.001 for the effect of MA concentration; +++p<.001 for the effect of genotype.
Figure 4.
Figure 4.
Selection results for the MAH and MAL lines and characterization of the MAC line. Shown are means ± SEM mg/kg/18h MA intake in a) the MAH/MAL selection study for the originating F2 (S0), parents selected for breeding generations S1-S5, and S1-S4 generation MAH and MAL offspring, and in b) the MAC line for their originating F2 (G0), parents selected for breeding (G2 and G4) and G1 and G3 offspring. Also shown are means ± SEM for c,d) preference ratio for the mice that generated the data in a and b, and means ± SEM for e,f) total volume (ml) consumed for the same mice. For the F2, n=58–60/sex for each of the S0 and G0 populations; for the S1-S5/G2 and G5 parents, n=13/sex/line for each generation; for offspring, n=28–32/sex/line/generation. All statistical symbols refer to comparisons between offspring and F2 or between offspring of the 2 lines. *p<.05, **p<.01, ***p<.001 for the difference from the F2; +p<.05, +++p<.001 for the effect of line; ++p<.01 for the main effect of line in c.
Figure 5.
Figure 5.
HS-CC × DBA/2J F2 mice possessing the Taar1m1J/m1J genotype exhibit higher levels of MA-induced stimulation, sensitization and conditioned activation, compared to those with the Taar1+/+ genotype. Shown in a) are means ± SEM for distance traveled (cm/60 min) on each test day after treatment with saline (days 1, 2 and 12) or 1 mg/kg MA (days 3, 5, 7, 9 and 11). Shown in b) are means ± SEM for scores derived by subtraction of baseline day 2 for acute MA response from day 3 for acute stimulation (D3-D2); initial MA response on day 2 subtracted from final MA response on day 11 for sensitization (D11-D3), and habituated baseline on day 2 subtracted from activity after saline treatment on day 12, following 5 MA exposures in the apparatus, for the conditioned activation measure (D12-D2). n=7–9/sex/genotype. **p<.01, ***p<.001 for the difference from days 1, 2 and 12; +p<.05, ++p<.01, +++p<.001 for the effect of genotype.
Figure 6.
Figure 6.
MA-induced acute stimulation, sensitization and conditioned activation in MAC, MAL and MAH mice across generations. Shown are means ± SEM for a) acute stimulation (D3-D2), b) sensitization (D11-D3) and c) conditioned activation (D12-D2) across generations. Generations labeled S1-S4 are for MAL and MAH mice; these are non-selected generations G1-G4 for MAC mice. n= 10–21/sex/line. +p<.05, ++p<.01, +++p<.001 for the effect of line, irrespective of generation (there was no significant line × generation interaction for any trait).
Figure 7.
Figure 7.
The MAC line, but not the MAH or MAL line, is sensitive to the hypothermic effect of MA. Shown are means ± SEM for core body temperature (°C) after a) saline or b) 2 mg/kg MA administration in S2 generation mice and c) saline or d) 2 mg/kg MA administration in S5 generation mice. n= 10/sex/line/dose. Hatch mark (#) significance symbol colors are matched to line to indicate mean differences, with pink=MAC, blue=MAL, and black=MAH. #p<.05, ##p<.01, ###p<.001 for difference from baseline (T0) for the line indicated by symbol color; +p<.05, ++p<.01, +++p<.001 for the difference between one line and the other 2 lines, except for T0 in d, where MAC differed from MAL.
Figure 8.
Figure 8.
Tastant consumption in S3 MAH, MAL and MAC mice. Means ± SEM for a) saccharin intake (mg/kg), b) saccharin preference ratio, c) total volume (ml) consumed for each saccharin concentration (1.6 and 3.2 mM) offered, d) quinine intake (mg/kg), e) quinine preference ratio, and f) total volume (ml) consumed for each quinine concentration (0.0015 and 0.03 mM) offered. n=10/sex/line. **p<.01, ***p<.001 for the effect of concentration; +p<.05 for the difference between one line and the other two lines or the 2 indicated lines in e.
Figure 9.
Figure 9.
Tastant consumption in S5 MAH, MAL and MAC mice. Means ± SEM for a) saccharin intake (mg/kg), b) saccharin preference ratio, c) total volume (ml) consumed for each saccharin concentration (1.6 and 3.2 mM) offered, d) quinine intake (mg/kg), e) quinine preference ratio, and f) total volume (ml) consumed for each quinine concentration (0.0015 and 0.03 mM) offered. n=10/sex/line. **p<.01, ***p<.001 for the effect of concentration; +p<.05, ++p<.01, +++p<.001 for the difference between one line and the other two lines.

Similar articles

Cited by

References

    1. NIDA. “Methamphetamine” National Institute on Drug Abuse, 16 Oct. 2019, https://www.drugabuse.gov/publications/research-reports/methamphetamine. Accessed 16 Dec. 2019NIDA.
    1. World Drug Report 2019. (United Nations publication, Sales No. E.19.XL.8)
    1. Bousman CA, Glatt SJ, Everall IP, Tsuang MT. Genetic association studies of methamphetamine use disorders: A systematic review and synthesis. Am J Med Genet. 2009;150B:1025–1049. - PubMed
    1. Iamjan SA, Thanoi S, Watiktinkorn P, Nudmamud-Thanoi S, Reynolds GP. BDNF (Val66Met) genetic polymorphism is associated with vulnerability for methamphetamine dependence. Pharmacogenomics. 2015;16:1541–1545. - PubMed
    1. Iamjan SA, Thanoi S, Watiktinkorn P, Reynolds GP, Nudmamud-Thanoi S. Genetic variation of GRIA3 gene is associated with vulnerability to methamphetamine dependence and its associated psychosis. J Psychopharmacol. 2018;32:309–315. - PubMed

Publication types

Substances