. 2020 Jul 9;182(1):73-84.e16.
doi: 10.1016/j.cell.2020.05.025. Epub 2020 May 18.

Potent Neutralizing Antibodies against SARS-CoV-2 Identified by High-Throughput Single-Cell Sequencing of Convalescent Patients' B Cells

Affiliations

Potent Neutralizing Antibodies against SARS-CoV-2 Identified by High-Throughput Single-Cell Sequencing of Convalescent Patients' B Cells

Yunlong Cao et al. Cell. .

Abstract

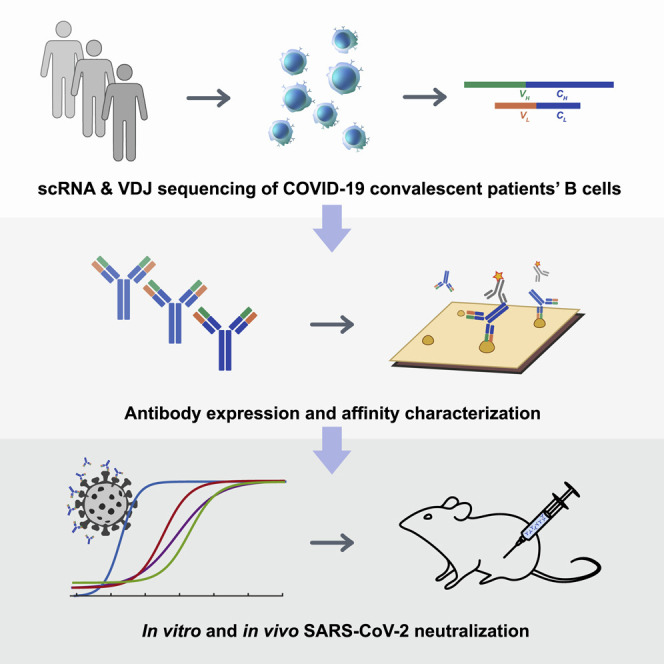
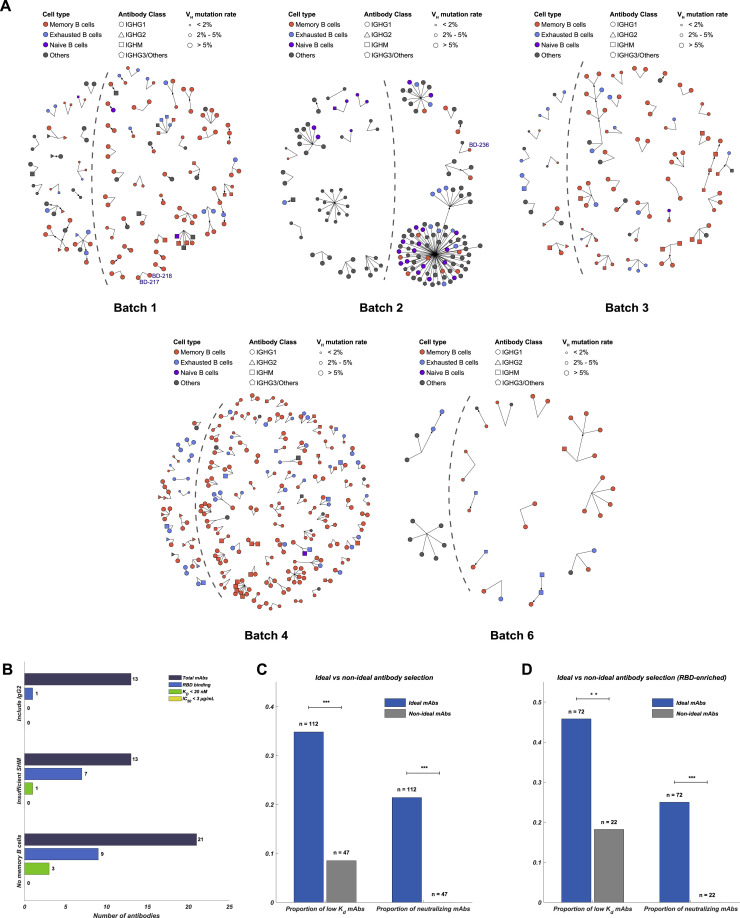
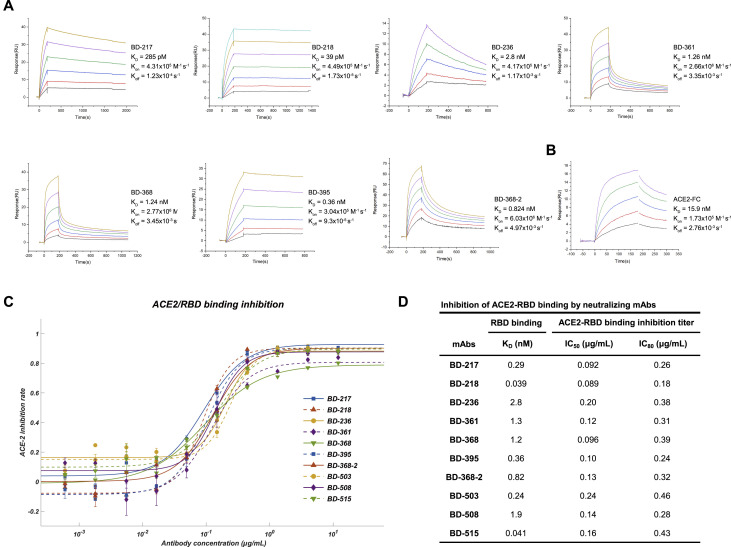
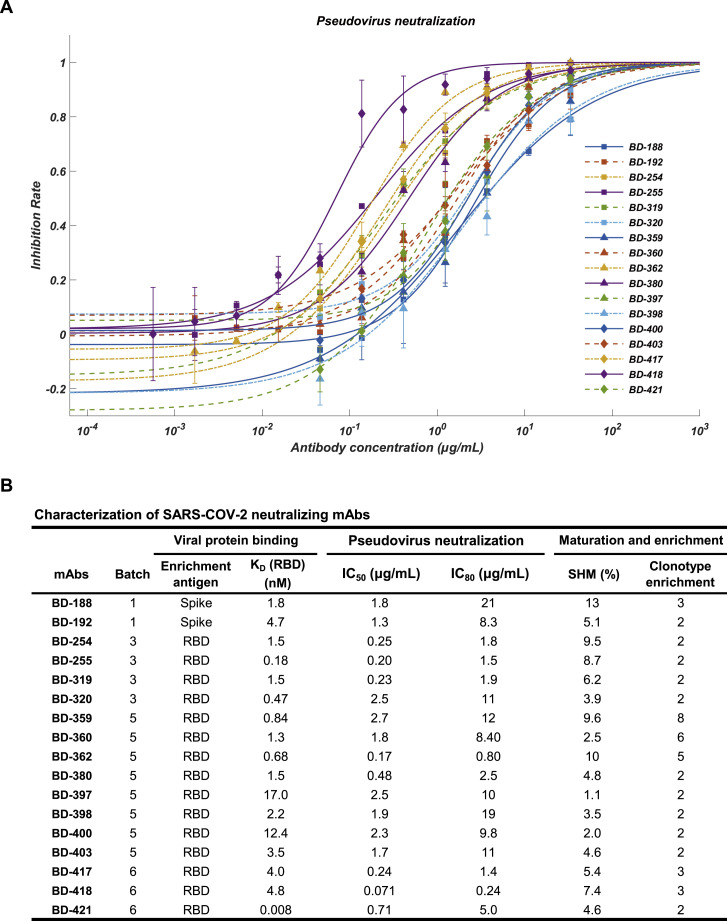
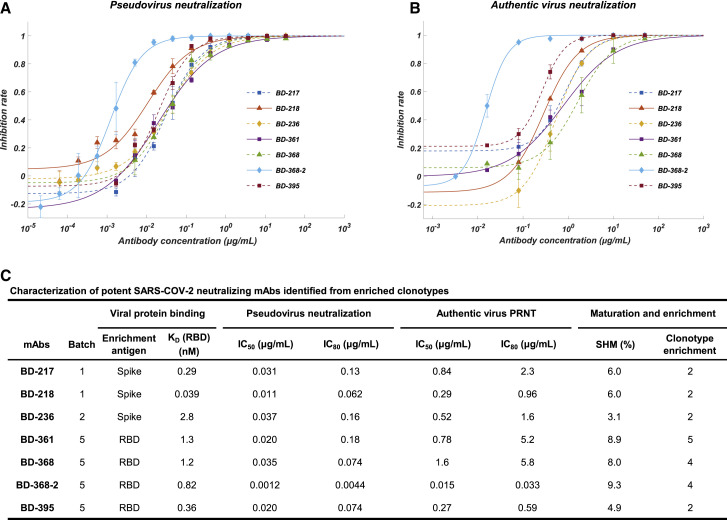
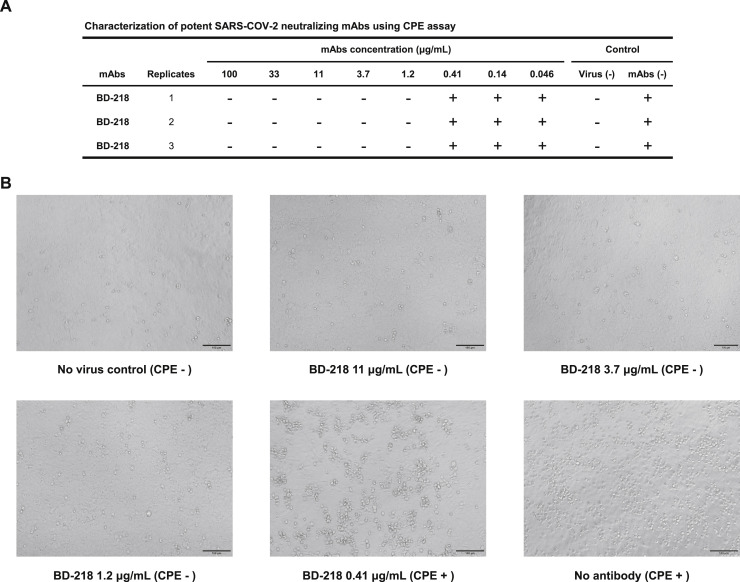
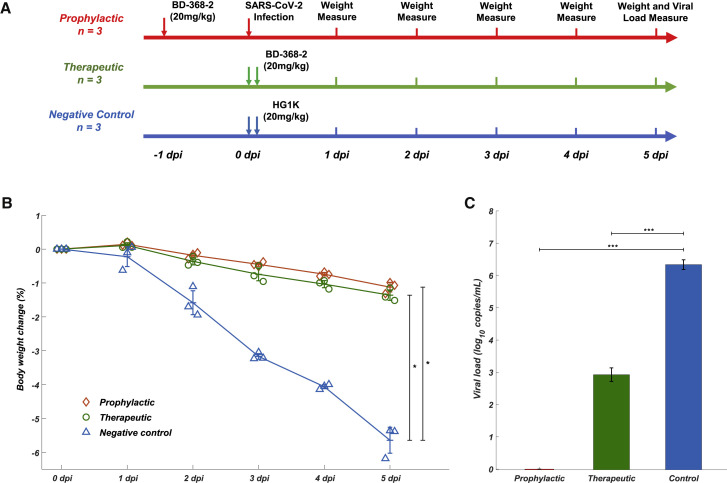
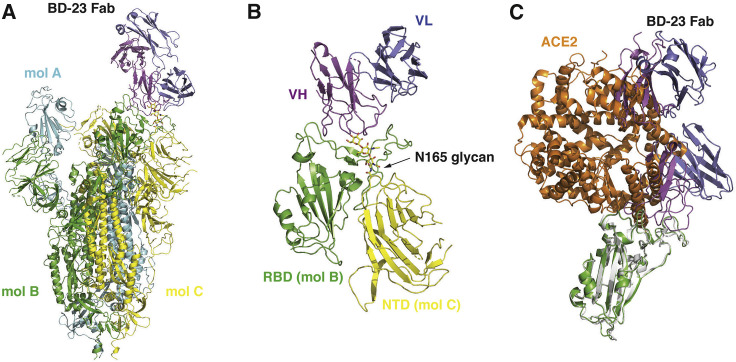
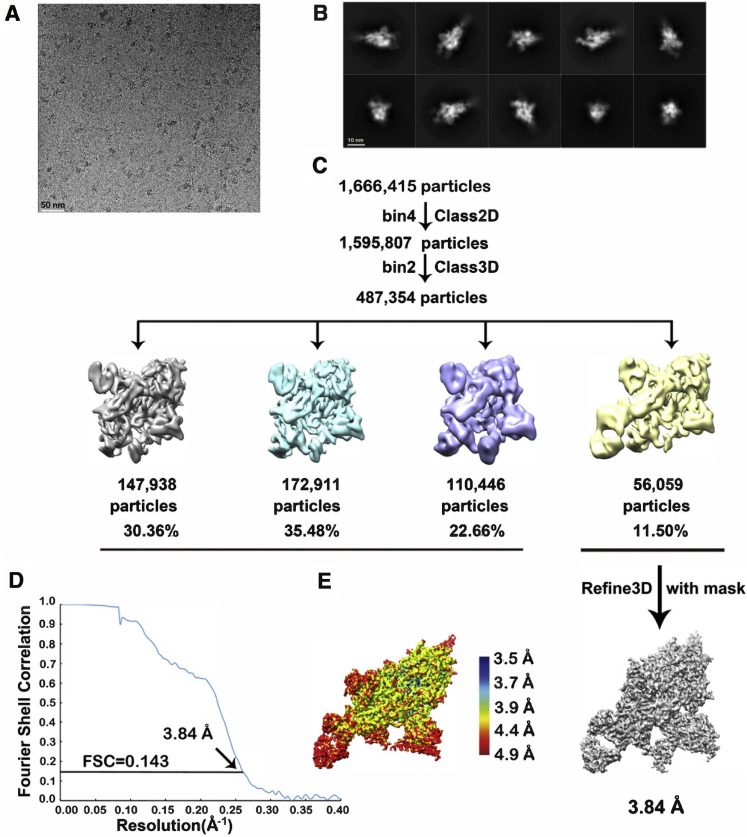
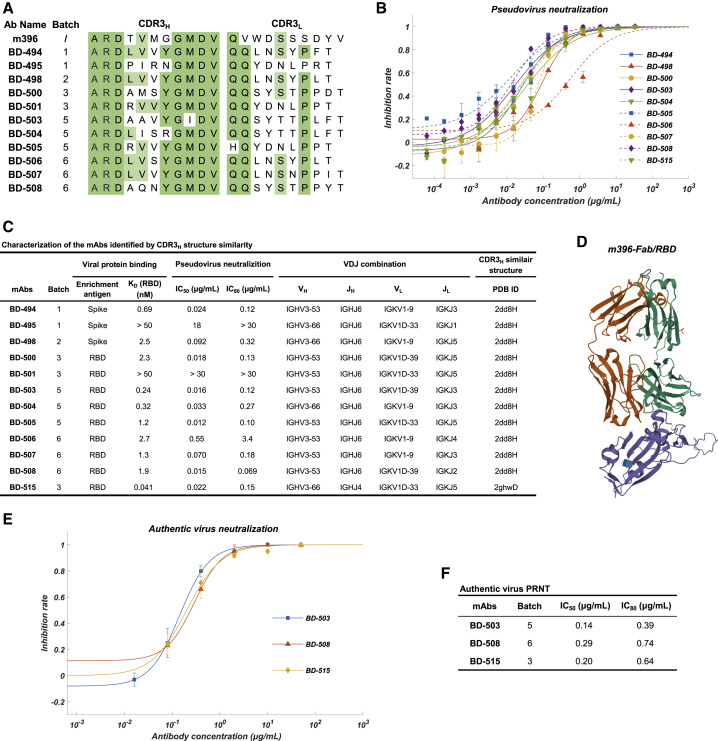
The COVID-19 pandemic urgently needs therapeutic and prophylactic interventions. Here, we report the rapid identification of SARS-CoV-2-neutralizing antibodies by high-throughput single-cell RNA and VDJ sequencing of antigen-enriched B cells from 60 convalescent patients. From 8,558 antigen-binding IgG1+ clonotypes, 14 potent neutralizing antibodies were identified, with the most potent one, BD-368-2, exhibiting an IC50 of 1.2 and 15 ng/mL against pseudotyped and authentic SARS-CoV-2, respectively. BD-368-2 also displayed strong therapeutic and prophylactic efficacy in SARS-CoV-2-infected hACE2-transgenic mice. Additionally, the 3.8 Å cryo-EM structure of a neutralizing antibody in complex with the spike-ectodomain trimer revealed the antibody's epitope overlaps with the ACE2 binding site. Moreover, we demonstrated that SARS-CoV-2-neutralizing antibodies could be directly selected based on similarities of their predicted CDR3H structures to those of SARS-CoV-neutralizing antibodies. Altogether, we showed that human neutralizing antibodies could be efficiently discovered by high-throughput single B cell sequencing in response to pandemic infectious diseases.

Keywords: B cell; CDR3; COVID-19; SARS-CoV-2; convalescent patient; neutralizing antibody; single-cell sequencing.


Conflict of interest statement

Declaration of Interests X.S.X, Y.C, W.S, and X.Z. are co-inventors on patent applications describing the neutralizing mAbs. X.Z. is the CEO of Singlomics (Beijing DanXu Pharmaceuticals, Co. Ltd.). The other authors declare no competing interests.

Figures

None
Graphical abstract
Figure 1
Figure 1
Efficient Neutralizing Antibody Identification through Antigen-Enriched High-Throughput Single-Cell RNA Sequencing (A) Schematic overview of the neutralizing antibody identification process. The sequence of the mAbs could be obtained within 2 days using 10X Genomics 5′ VDJ sequencing. (B) Cell-type identification of the single B cells binding RBD (batch 5) based on gene expression. Only productive heavy-light chain-paired single cells are analyzed. See also Figures S1 and S2. (C) Ideal clonotype selection for in vitro expression showing clonotype’s enrichment frequency, immunoglobulin class, cell type, and variable region mutation rate (batch 5). Ideal clonotypes are on the right side of the dashed line with four potent neutralizing mAbs selected for further characterization are labeled. (D) Ideal clonotype selection criteria. (E) Characteristics of RBD-binding and spike-protein binding (RBD-) antibodies. Only RBD-binding antibodies showed neutralizing ability in pseudovirus neutralization assays. An antibody was determined as ELISA positive if it showed saturated absorption at 1 μg/mL antigen and 1 μg/mL antibody concentration. KD was measured by using SPR with a 1:1 binding model. (F) Characteristics of the antibodies selected based on different antigen enrichment methods. See also Figure S3.
Figure S1
Figure S1
Summary of the 10X scRNA and scVDJ Sequencing of 12 Convalescent Patients’ B Cells, Related to Figure 1 (A) Summary of the 10X scRNA and scVDJ sequencing of 12 convalescent patients’ B cells. Patient 1-9 used a MACS-based negative selection for B cell enrichment from PBMC. Patient 10-12 used a MACS-based CD27+ selection for memory B cell enrichment from PBMC. Cells are assigned to the same clonotype if they have identical heavy and light chain CDR3 DNA sequences. (B) Characteristics of the selected mAbs identified from the 12 patients. mAbs are selected from clonotypes that contain IgG1-presenting memory B cells. (C) Characteristics of the neutralizing mAb BD-23. (D) t-SNE plot of patient 4’s scRNA-seq result. Only productive Heavy-Light chain paired cells were shown. Cells are colored based on cell types. (E) t-SNE plot of patient 11’s scRNA-seq result. (F) Top 25 most enriched clonotypes of patient 4. The clonotype containing BD-23 is labeled. (G) Ig class distribution of patient 4’s clonotypes. (H) Top 25 most enriched clonotypes of patient 11. (I) Ig class distribution of patient 11’s clonotypes.
Figure S2
Figure S2
Summary of the 10X scRNA and scVDJ Sequencing of Antigen-Binding B Cells, Related to Table 1 A) – E) t-SNE plot of productive heavy-light chain paired single cells in each batch. Cells are colored based on cell types.
Figure S3
Figure S3
Ideal Antibody Selection from Enriched IgG1+ clonotypes for In Vitro Expression, Related to Figure 1 (A) Ideal antibody selection based on clonotype enrichment frequency, Ig class, cell type, and VDJ region mutation rate. Ideal antibodies are on the right side of the dashed line. (B) Non-ideal candidates showed less strong binding and neutralizing mAbs. (C) The comparison of the proportion of strong binding and neutralizing mAbs identified from ideal candidates and non-ideal candidates (Fisher’s exact test, ∗∗∗p < 0.001). (D) The comparison of the proportion of strong binding and neutralizing mAbs identified from RBD-enriched ideal candidates and non-ideal candidates (Fisher’s exact test, ∗∗p < 0.01, ∗∗∗p < 0.001).
Figure S5
Figure S5
KD Measurement and ACE2/RBD Binding Inhibition for the Potent Neutralizing mAbs, Related to Figure 2 (A) Dissociation constant measurement of the representing mAbs against RBD. KD is calculated using a 1:1 binding model. All measurements are performed by using a serial 2-fold dilution of biotinylated RBD, starting from 50 nM (Yellow) to 1.56 nM (Black). (B) Dissociation constant measurement of ACE2 against RBD. (C) ACE2/RBD binding inhibition rate determined by ACE2 competition ELISA assay. The data were obtained from a single representative experiment with three replicates. Data are represented as mean ± SD (D) IC50 and IC80 calculated from ACE2 competence ELISA assays by fitting a four-parameter logistic regression model.
Figure S4
Figure S4
Binding Specificity and Neutralizing Abilities of the Non-potent Neutralizing mAbs, Related to Figure 2 (A) Neutralization potency measured by a SARS-CoV-2 spike-pseudotyped VSV neutralization assay. Data for each mAb were obtained from a representative neutralization experiment, which contains three replicates. Data are represented as mean ± SD. IC50 and IC80 were calculated by fitting a four-parameter logistic curve. (B) Characteristics of the neutralizing mAbs. KD is measured using SPR with a 1:1 binding model targeting biotinylated RBD protein. The somatic hypermutation rate (SHM) is calculated from mutated DNA sequences of the heavy- chain variable regions (V, D, and J regions) using Igblast.
Figure 2
Figure 2
Affinity Specificity and Neutralizing Abilities of the Potent Neutralizing mAbs (A) Neutralization potency measured by using a pseudotyped virus neutralization assay. Data for each mAb were obtained from a representative neutralization experiment, which contains three replicates. Data are represented as mean ± SD. See also Figure S4. (B) Neutralization potency measured by an authentic SARS-CoV-2 plaque reduction neutralizing test (PRNT) assay. Data for each mAb were obtained from a representative neutralization experiment, which contains three replicates. Data are represented as mean ± SD. See also Figure S6. (C) Characteristics of the neutralizing mAbs. IC50 and IC80 were calculated by using a four-parameter logistic curve fitting. KD targeting RBD was measured by using SPR with a 1:1 binding model. The somatic hypermutation rate (SHM) was calculated by comparing DNA sequences of the heavy-chain variable regions (V, D, and J regions) to germline sequences using Igblast. See also Figure S5.
Figure S6
Figure S6
Authentic SARS-CoV-2 Neutralization Potency Measured by Cytopathic Effect (CPE) Assay Showed High Consistency with PRNT, Related to Figure 2 (A) A serial dilution of each mAbs is tested against the authentic SARS-CoV-2 on Vero-E6 cells examined by CPE (B) Phase-contract image of Vero-E6 cells examining CPE. BD-218 shows no CPE at 1.2 μg/mL, which is consistent with the PRNT results of BD-218.
Figure 3
Figure 3
BD-368-2 Showed High Therapeutic and Prophylactic Efficacy in SARS-CoV-2-Infected hACE2 Transgenic Mice (A) Experimental design for therapeutic and prophylactic testing of BD-368-2 in hACE2 transgenic mice. BD-368-2 or unrelated antibody HG1K (20 mg/kg of body weight) was intraperitoneally injected into the transgenic mice before or after SAR-CoV-2 infection. (B) Body-weight change (%) of the hACE2 transgenic mice recorded over 5 days (one-sided permutation test, p < 0.05). Each group contains 3 mice. Data are represented as mean ± SD. (C) Virus titers of lung tissue at 5 dpi. The viral loads of the lung were determined by qRT-PCR (one-tailed t test, ∗∗∗p < 0.001). Data are represented as mean ± SD.
Figure 4
Figure 4
Cryo-EM Structure of BD23-Fab in Complex with the Spike Trimer (A) Cryo-EM structure of the S trimer in complex with BD23-Fab reconstructed at 3.8 Å resolution. The three protomers in the S trimer are depicted in cyan, green, and yellow, respectively. BD23-Fab is depicted in magenta (heavy chain) and blue (light chain). (B) N165 glycan in the NTD of protomer C facilitates the interaction between BD23-Fab and the RBD of protomer B. (C) The crystal structure of the RBD/ACE2 complex is overlaid onto the RBD/BD23-Fab structure. BD23-Fab would collide with ACE2 and therefore block the interaction between RBD and ACE2. RBD is shown in green and white, whereas ACE2 in orange. See also Figure S7.
Figure S7
Figure S7
Workflow for BD-23 Cryo-EM 3D Reconstructions, Related to Figure 4 A) A representative raw image collected using a Titan Krios 300 kV microscope with a K2 detector. B) Representative 2D classes. C) Flow chart of image processing. D) Gold standard Fourier shell correlation (FSC) curve with estimated resolution. E) Local resolution estimation of the EM map analyzed by ResMap.
Figure 5
Figure 5
Characteristics of the Neutralizing mAbs Identified Based on CDR3H Structural Similarity to SARS-CoV-Neutralizing mAbs (A) The CDR3 sequence comparison between SARS-CoV-neutralizing mAb m396 and the SARS-CoV-2-neutralizing mAbs identified based on CDR3H structure similarity. (B) Neutralization potency measured by using a pseudotyped virus neutralization assay. Data for each mAb were obtained from a representative neutralization experiment, which contains three replicates. Data are represented as mean ± SD. (C) Characteristics of the neutralizing mAbs identified based on structure similarity. IC50 and IC80 were calculated by using a four-parameter logistic curve-fitting. KD targeting RBD was measured by using SPR with a 1:1 binding model. VDJ alignment is determined by Igblast. The CDR3H structure prediction was performed using FREAD. (D) The crystal structure of m396-Fab/SARS-CoV-RBD. The regions corresponding to the RBD, m396-H, and m396-L domain are shown in purple, green, and orange, respectively. The structure is from PDB ID 2dd8. (E) Authentic SARS-CoV-2 plaque reduction neutralizing test (PRNT) assay on the three selected mAbs, BD-503, BD-508, and BD-515. Data for each mAb were obtained from a representative neutralization experiment, which contains three replicates. Data are represented as mean ± SD. (F) Neutralization potency on authentic SARS-CoV-2 of the three selected mAbs. IC50 and IC80 were calculated by fitting a four-parameter logistic curve.
Figure 6
Figure 6
Epitope Binning of the Potent Neutralizing mAbs Using Competitive ELISA Competition tolerance was shown for each pair of neutralizing mAbs measured by double-antibody sandwich ELISA (RBD). The column indicates the primary antibody, and the row indicates the secondary antibody. Competition tolerance larger than 50% indicates a high possibility of no overlapping epitope.

Comment in

References

    1. Adams P.D., Afonine P.V., Bunkóczi G., Chen V.B., Davis I.W., Echols N., Headd J.J., Hung L.-W., Kapral G.J., Grosse-Kunstleve R.W. PHENIX: A Comprehensive Python-based System for Macromolecular Structure Solution. Acta Crystallogr D. Biol. Crystallogr. 2010;66:213–221. - PMC - PubMed
    1. An J., Liao X., Xiao T., Qian S., Yuan J., Ye H., Qi F., Shen C., Liu Y., Wang L. Clinical characteristics of the recovered COVID-19 patients with re-detectable positive RNA test. MedRxiv. 2020 doi: 10.1101/2020.03.26.20044222. Published online March 30, 2020. - DOI - PMC - PubMed
    1. Aran D., Looney A.P., Liu L., Wu E., Fong V., Hsu A., Chak S., Naikawadi R.P., Wolters P.J., Abate A.R. Reference-based analysis of lung single-cell sequencing reveals a transitional profibrotic macrophage. Nat. Immunol. 2019;20:163–172. - PMC - PubMed
    1. Bao L., Deng W., Huang B., Gao H., Liu J., Ren L., Wei Q., Yu P., Xu Y., Qi F. The pathogenicity of SARS-CoV-2 in hACE2 transgenic mice. Nature. 2020 doi: 10.1038/s41586-020-2312-y. Published online May 7, 2020. - DOI - PubMed
    1. Bassing C.H., Swat W., Alt F.W. The mechanism and regulation of chromosomal V(D)J recombination. Cell. 2002;109(Suppl):S45–S55. - PubMed

Publication types

MeSH terms

Substances