

Impact of the Coronavirus Disease 2019 (COVID-19) Pandemic on Imaging Case Volumes
- PMID: 32425710
- PMCID: PMC7229978
- DOI: 10.1016/j.jacr.2020.05.004
Impact of the Coronavirus Disease 2019 (COVID-19) Pandemic on Imaging Case Volumes
Abstract
Objective: The coronavirus disease 2019 (COVID-19) pandemic has had significant economic impact on radiology with markedly decreased imaging case volumes. The purpose of this study was to quantify the imaging volumes during the COVID-19 pandemic across patient service locations and imaging modality types.
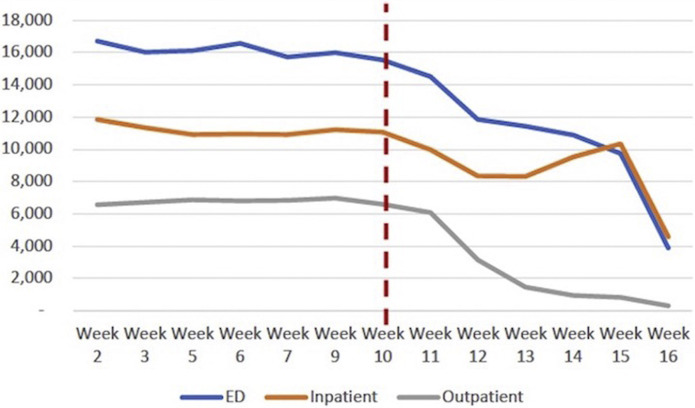
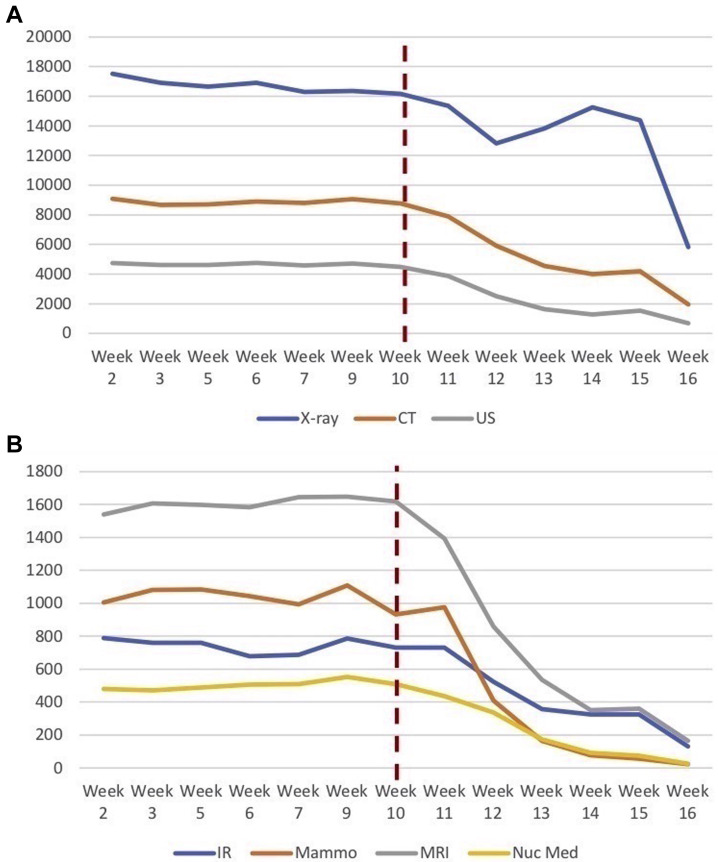
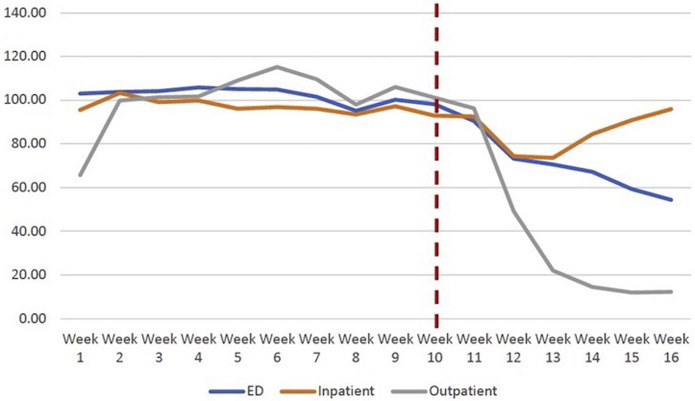
Methods: Imaging case volumes in a large health care system were retrospectively studied, analyzing weekly imaging volumes by patient service locations (emergency department, inpatient, outpatient) and modality types (x-ray, mammography, CT, MRI, ultrasound, interventional radiology, nuclear medicine) in years 2020 and 2019. The data set was split to compare pre-COVID-19 (weeks 1-9) and post-COVID-19 (weeks 10-16) periods. Independent-samples t tests compared the mean weekly volumes in 2020 and 2019.
Results: Total imaging volume in 2020 (weeks 1-16) declined by 12.29% (from 522,645 to 458,438) compared with 2019. Post-COVID-19 (weeks 10-16) revealed a greater decrease (28.10%) in imaging volumes across all patient service locations (range 13.60%-56.59%) and modality types (range 14.22%-58.42%). Total mean weekly volume in 2020 post-COVID-19 (24,383 [95% confidence interval 19,478-29,288]) was statistically reduced (P = .003) compared with 33,913 [95% confidence interval 33,429-34,396] in 2019 across all patient service locations and modality types. The greatest decline in 2020 was seen at week 16 specifically for outpatient imaging (88%) affecting all modality types: mammography (94%), nuclear medicine (85%), MRI (74%), ultrasound (64%), interventional (56%), CT (46%), and x-ray (22%).
Discussion: Because the duration of the COVID-19 pandemic remains uncertain, these results may assist in guiding short- and long-term practice decisions based on the magnitude of imaging volume decline across different patient service locations and specific imaging modality types.
Keywords: COVID-19; imaging volume; modality types; patient service locations.
Copyright © 2020 American College of Radiology. Published by Elsevier Inc. All rights reserved.
Figures
References
-
- Worldometer United States. https://www.worldometers.info/coronavirus/country/us/ Available at: Updated May 3, 2020. Accessed 2020 May 3, 2020.
-
- NYC Health COVID-19 data. https://www1.nyc.gov/site/doh/covid/covid-19-data.page Available at: Updated April 18, 2020. Accessed April 25, 2020.
-
- Federal Reserve Bank of St. Louis, Economic Research. S&P 500. https://fred.stlouisfed.org/series/SP500 Updated May 1, 2020. Accessed May 3, 2020.
-
- Federal Reserve Bank of St. Louis, Economic Research. Unemployment rate. https://fred.stlouisfed.org/series/UNRATE Available at: Updated April 3, 2020. Accessed May 3, 2020.
-
- ACR ACR COVID-19 clinical resources for radiologists. https://www.acr.org/Clinical-Resources/COVID-19-Radiology-Resources Available at: Updated April 28, 2020. Accessed May 3, 2020.
MeSH terms
LinkOut - more resources
Full Text Sources
