

Metabolic Reprogramming of Mouse Bone Marrow Derived Macrophages Following Erythrophagocytosis
- PMID: 32425810
- PMCID: PMC7204509
- DOI: 10.3389/fphys.2020.00396
Metabolic Reprogramming of Mouse Bone Marrow Derived Macrophages Following Erythrophagocytosis
Abstract
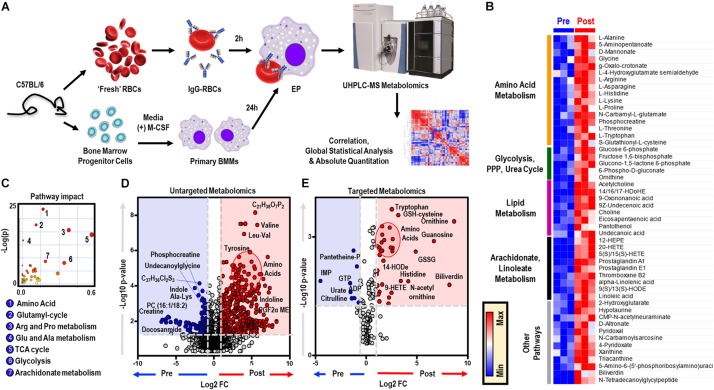
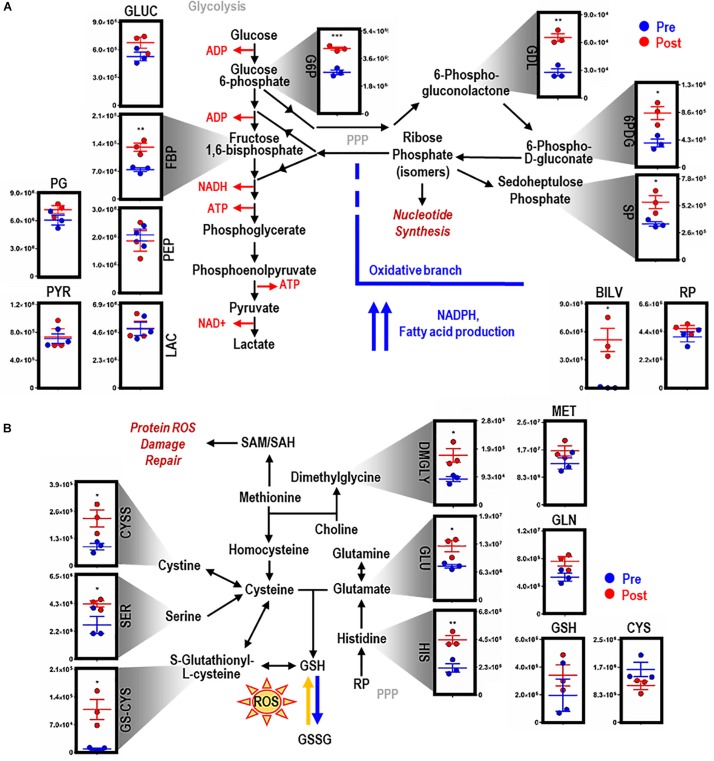
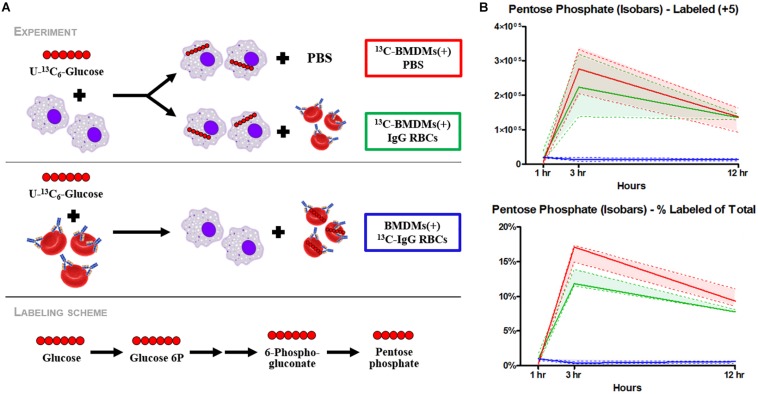
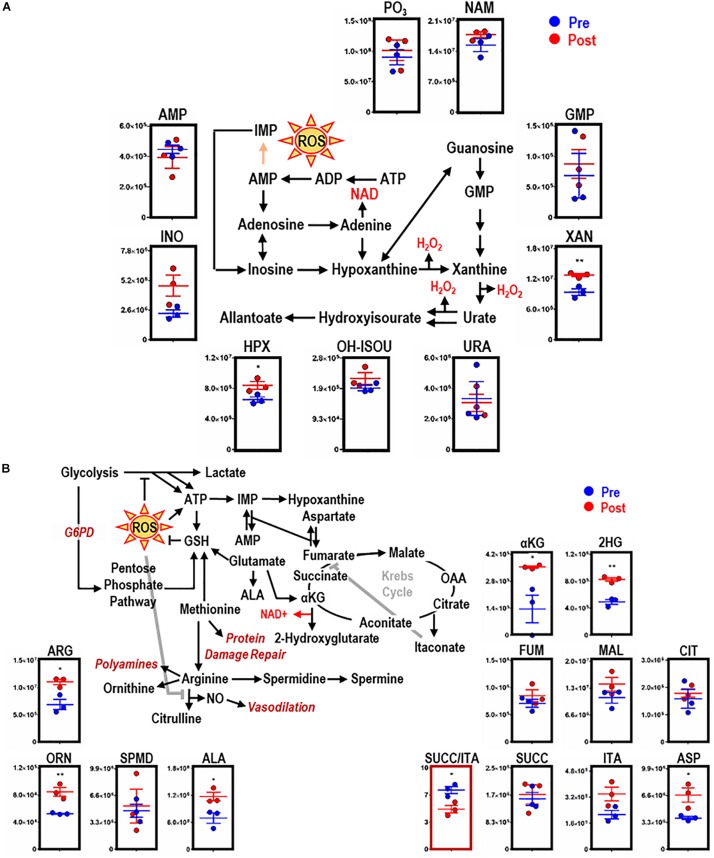
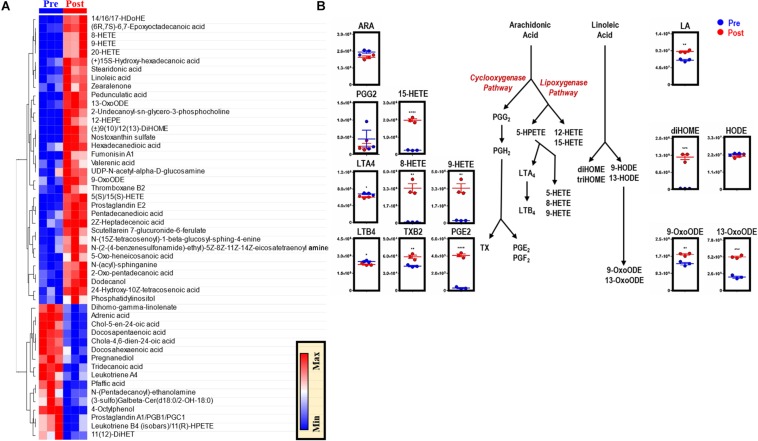
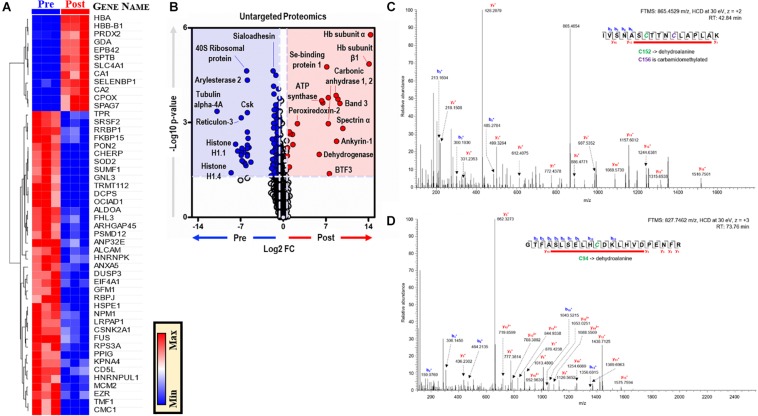
Reticuloendothelial macrophages engulf ∼0.2 trillion senescent erythrocytes daily in a process called erythrophagocytosis (EP). This critical mechanism preserves systemic heme-iron homeostasis by regulating red blood cell (RBC) catabolism and iron recycling. Although extensive work has demonstrated the various effects on macrophage metabolic reprogramming by stimulation with proinflammatory cytokines, little is known about the impact of EP on the macrophage metabolome and proteome. Thus, we performed mass spectrometry-based metabolomics and proteomics analyses of mouse bone marrow-derived macrophages (BMDMs) before and after EP of IgG-coated RBCs. Further, metabolomics was performed on BMDMs incubated with free IgG to ensure that changes to macrophage metabolism were due to opsonized RBCs and not to free IgG binding. Uniformly labeled tracing experiments were conducted on BMDMs in the presence and absence of IgG-coated RBCs to assess the flux of glucose through the pentose phosphate pathway (PPP). In this study, we demonstrate that EP significantly alters amino acid and fatty acid metabolism, the Krebs cycle, OXPHOS, and arachidonate-linoleate metabolism. Increases in levels of amino acids, lipids and oxylipins, heme products, and RBC-derived proteins are noted in BMDMs following EP. Tracing experiments with U-13C6 glucose indicated a slower flux through glycolysis and enhanced PPP activation. Notably, we show that it is fueled by glucose derived from the macrophages themselves or from the extracellular media prior to EP, but not from opsonized RBCs. The PPP-derived NADPH can then fuel the oxidative burst, leading to the generation of reactive oxygen species necessary to promote digestion of phagocytosed RBC proteins via radical attack. Results were confirmed by redox proteomics experiments, demonstrating the oxidation of Cys152 and Cys94 of glyceraldehyde 3-phosphate dehydrogenase (GAPDH) and hemoglobin-β, respectively. Significant increases in early Krebs cycle and C5-branched dibasic acid metabolites (α-ketoglutarate and 2-hydroxyglutarate, respectively) indicate that EP promotes the dysregulation of mitochondrial metabolism. Lastly, EP stimulated aminolevulinic acid (ALA) synthase and arginase activity as indicated by significant accumulations of ALA and ornithine after IgG-mediated RBC ingestion. Importantly, EP-mediated metabolic reprogramming of BMDMs does not occur following exposure to IgG alone. In conclusion, we show that EP reprograms macrophage metabolism and modifies macrophage polarization.
Keywords: OXPHOS; blood; lipid accumulation; macrophage metabolism; mitochondrial dysregulation; omics technologies; pentose phosphate pathway.
Copyright © 2020 Catala, Youssef, Reisz, Dzieciatkowska, Powers, Marchetti, Karafin, Zimring, Hudson, Hansen, Spitalnik and D’Alessandro.
Figures
Similar articles
-
Oxidative modifications of glyceraldehyde 3-phosphate dehydrogenase regulate metabolic reprogramming of stored red blood cells.Blood. 2016 Sep 22;128(12):e32-42. doi: 10.1182/blood-2016-05-714816. Epub 2016 Jul 12. Blood. 2016. PMID: 27405778
-
A physiological model to study iron recycling in macrophages.Exp Cell Res. 2005 Oct 15;310(1):43-53. doi: 10.1016/j.yexcr.2005.07.002. Exp Cell Res. 2005. PMID: 16095591
-
Murine macrophages response to iron.J Proteomics. 2012 Dec 5;76 Spec No.:10-27. doi: 10.1016/j.jprot.2012.07.018. Epub 2012 Jul 23. J Proteomics. 2012. PMID: 22835775
-
The Role of Metabolic Remodeling in Macrophage Polarization and Its Effect on Skeletal Muscle Regeneration.Antioxid Redox Signal. 2019 Apr 20;30(12):1553-1598. doi: 10.1089/ars.2017.7420. Epub 2018 Oct 9. Antioxid Redox Signal. 2019. PMID: 30070144 Review.
-
Cooperation of liver cells in health and disease.Adv Anat Embryol Cell Biol. 2001;161:III-XIII, 1-151. doi: 10.1007/978-3-642-56553-3. Adv Anat Embryol Cell Biol. 2001. PMID: 11729749 Review.
Cited by
-
Reprogramming of red blood cell metabolism in Zika virus-infected donors.Transfusion. 2022 May;62(5):1045-1064. doi: 10.1111/trf.16851. Epub 2022 Mar 14. Transfusion. 2022. PMID: 35285520 Free PMC article.
-
Exploring unconventional attributes of red blood cells and their potential applications in biomedicine.Protein Cell. 2024 May 7;15(5):315-330. doi: 10.1093/procel/pwae001. Protein Cell. 2024. PMID: 38270470 Free PMC article. No abstract available.
-
Arsenic retention in erythrocytes and excessive erythrophagocytosis is related to low selenium status by impaired redox homeostasis.Redox Biol. 2022 Jun;52:102321. doi: 10.1016/j.redox.2022.102321. Epub 2022 Apr 25. Redox Biol. 2022. PMID: 35500533 Free PMC article.
-
Divergent Genetic Regulation of Nitric Oxide Production between C57BL/6J and Wild-Derived PWD/PhJ Mice Controls Postactivation Mitochondrial Metabolism, Cell Survival, and Bacterial Resistance in Dendritic Cells.J Immunol. 2022 Jan 1;208(1):97-109. doi: 10.4049/jimmunol.2100375. Epub 2021 Dec 6. J Immunol. 2022. PMID: 34872978 Free PMC article.
-
Metabolic Reprogramming of Macrophages upon In Vitro Incubation with Aluminum-Based Adjuvant.Int J Mol Sci. 2023 Feb 23;24(5):4409. doi: 10.3390/ijms24054409. Int J Mol Sci. 2023. PMID: 36901849 Free PMC article.
References
-
- Alsultan A. I., Seif M. A., Amin T. T., Naboli M., Alsuliman A. M. (2010). Relationship between oxidative stress, ferritin and insulin resistance in sickle cell disease. Eur. Rev. Med. Pharmacol. Sci. 14 527–538. - PubMed
Grants and funding
LinkOut - more resources
Full Text Sources
Molecular Biology Databases
Research Materials