

Dynamics of Anthropometric Indices in a Large Paired Cohort With 10 Years of Follow-Up: Paving the Way to Sarcopenic Obesity
- PMID: 32425882
- PMCID: PMC7212464
- DOI: 10.3389/fendo.2020.00209
Dynamics of Anthropometric Indices in a Large Paired Cohort With 10 Years of Follow-Up: Paving the Way to Sarcopenic Obesity
Abstract
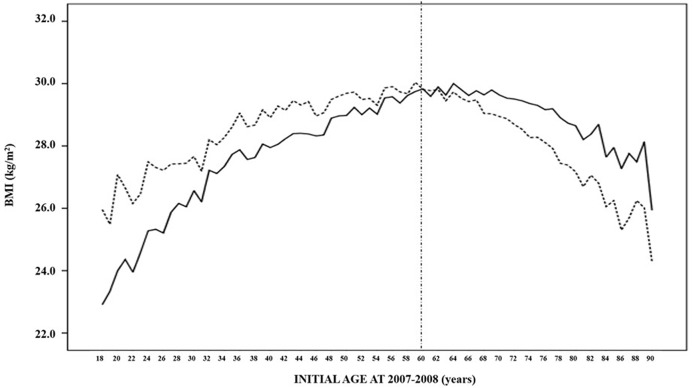
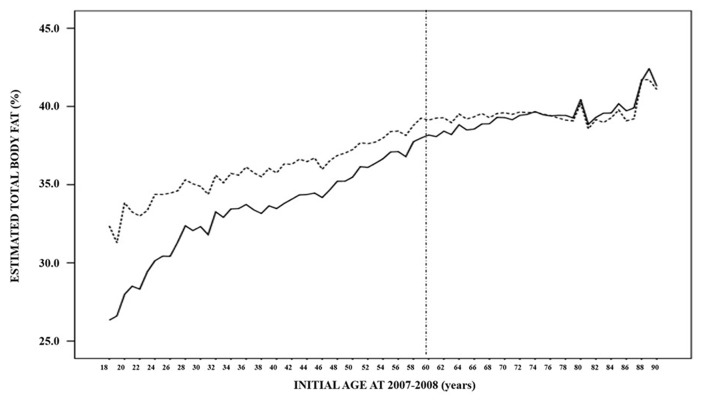
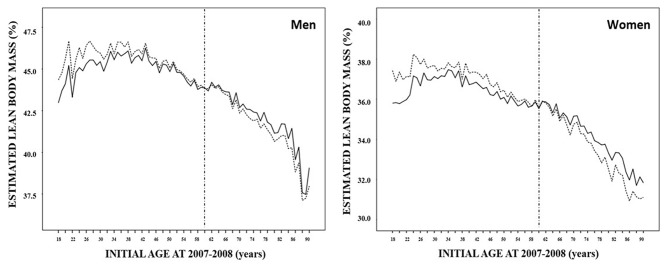
Introduction: Paired cohort investigations assessing the evolution of anthropometric indices are scarce. Here we assessed the 10-year evolution of BMI, total body fat, and lean body mass in 50,019 participants aged 18-90 years at the time of first assessment. Material and Methods: A retrospective cohort study using an electronic database that contains anonymized, longitudinal data from Primary Care medical records covering the 2007-2008 and 2017-2018 periods. Total body fat was estimated using the Clínica Universidad de Navarra-Body Adiposity Estimator formula, and the Hume formula was applied to estimate lean body mass. Results: The mean BMI of participants <60 years old in the 2007-2008 period increased significantly, from 27.5 to 28.3 kg/m2 (p < 0.001). However, the BMI of older subjects decreased during the next decade, from 28.9 to 28.3 kg/m2 (p < 0.001). The estimated total body fat showed a continuous progressive increase over all ages. Finally, lean body mass showed a progressive increase until the 40s, with a plateau between 40-45 years old and an uninterrupted decrease until older ages. Also, subjects who increased their BMI by 2 kg/m2 during the 10-year period were mainly women and younger at baseline, with a lower initial BMI and total body fat in comparison with those who experienced a BMI decrease of ≥2.0 kg/m2. Conclusion: The evolutions of BMI and the estimated body compositions reported here confirm that the adverse decrease in lean body mass begins in middle age. The proportion of older subjects is important when evaluating overweight and obesity prevalence in cross-sectional studies.
Keywords: BMI; anthropometric indices; evolution; lean body mass; total adiposity.
Copyright © 2020 Santos, Buti, López-Cano, Sánchez, Vidal, Hernández, Lafarga, Gutiérrez-Carrasquilla, Rius, Bueno and Lecube.
Figures
References
-
- NCD Risk Factor Collaboration (NCD-RisC) : Worldwide trends in body-mass index underweight overweight and obesity from 1975 to 2016: a pooled analysis of 2416 population-based measurement studies in 128·9 million children adolescents and adults. Lancet. (2017) 390:2627–42. 10.1016/S0140-6736(17)32129-3 - DOI - PMC - PubMed
-
- Kontis V, Mathers CD, Bonita R, Stevens GA, Rehm J, Shield KD, et al. . Regional contributions of six preventable risk factors to achieving the 25 × 25 non-communicable disease mortality reduction target: a modelling study. Lancet Glob Health. (2015) 3:e746–57. 10.1016/S2214-109X(15)00179-5 - DOI - PubMed
Publication types
MeSH terms
LinkOut - more resources
Full Text Sources
Medical