. 2020 Apr 30:11:803.
doi: 10.3389/fmicb.2020.00803. eCollection 2020.

Inhibition of Cavin3 Degradation by the Human Parainfluenza Virus Type 2 V Protein Is Important for Efficient Viral Growth

Affiliations

Inhibition of Cavin3 Degradation by the Human Parainfluenza Virus Type 2 V Protein Is Important for Efficient Viral Growth

Keisuke Ohta et al. Front Microbiol. .

Abstract

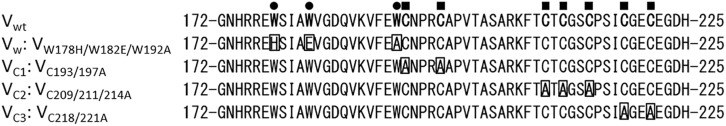
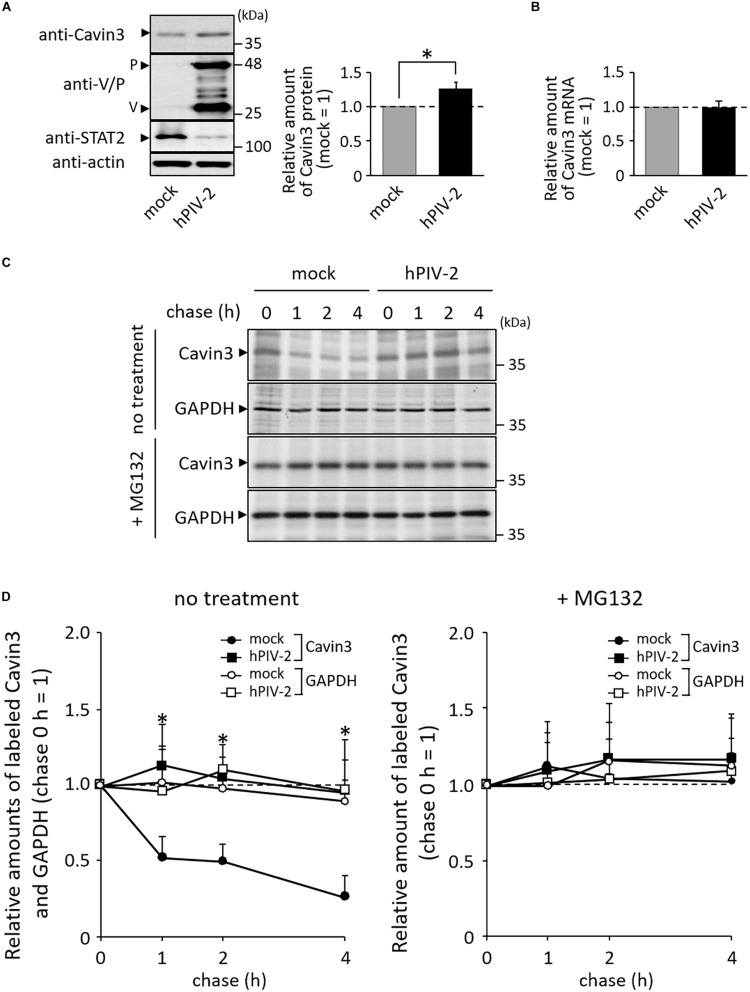
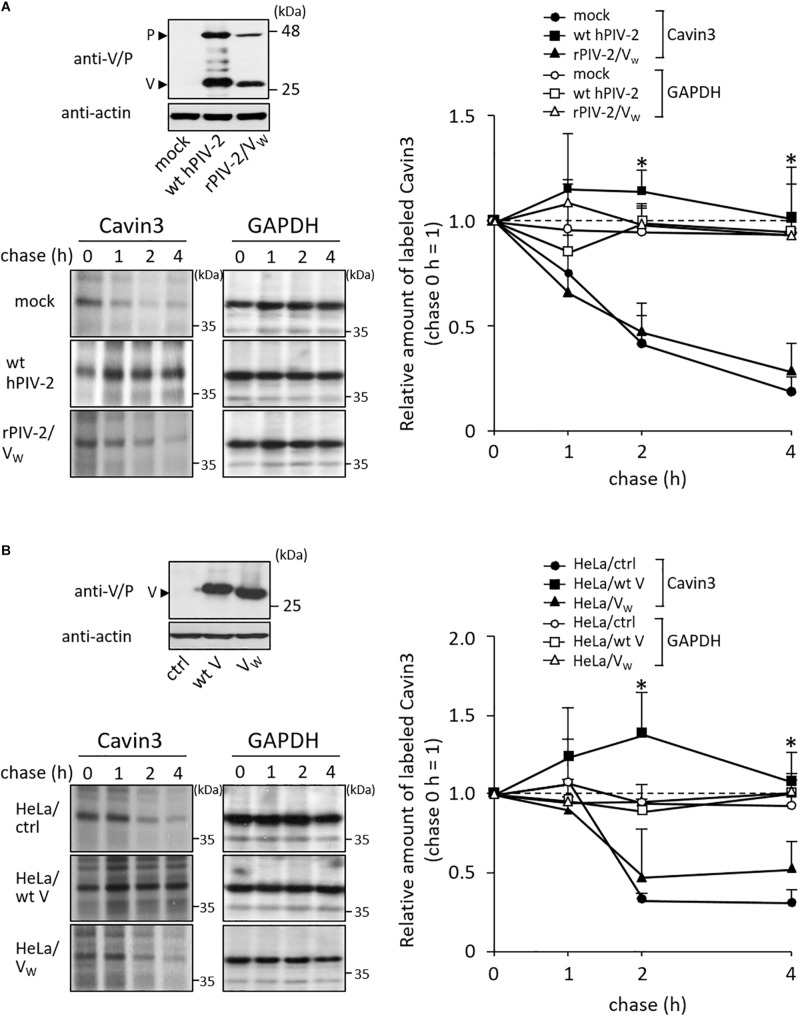
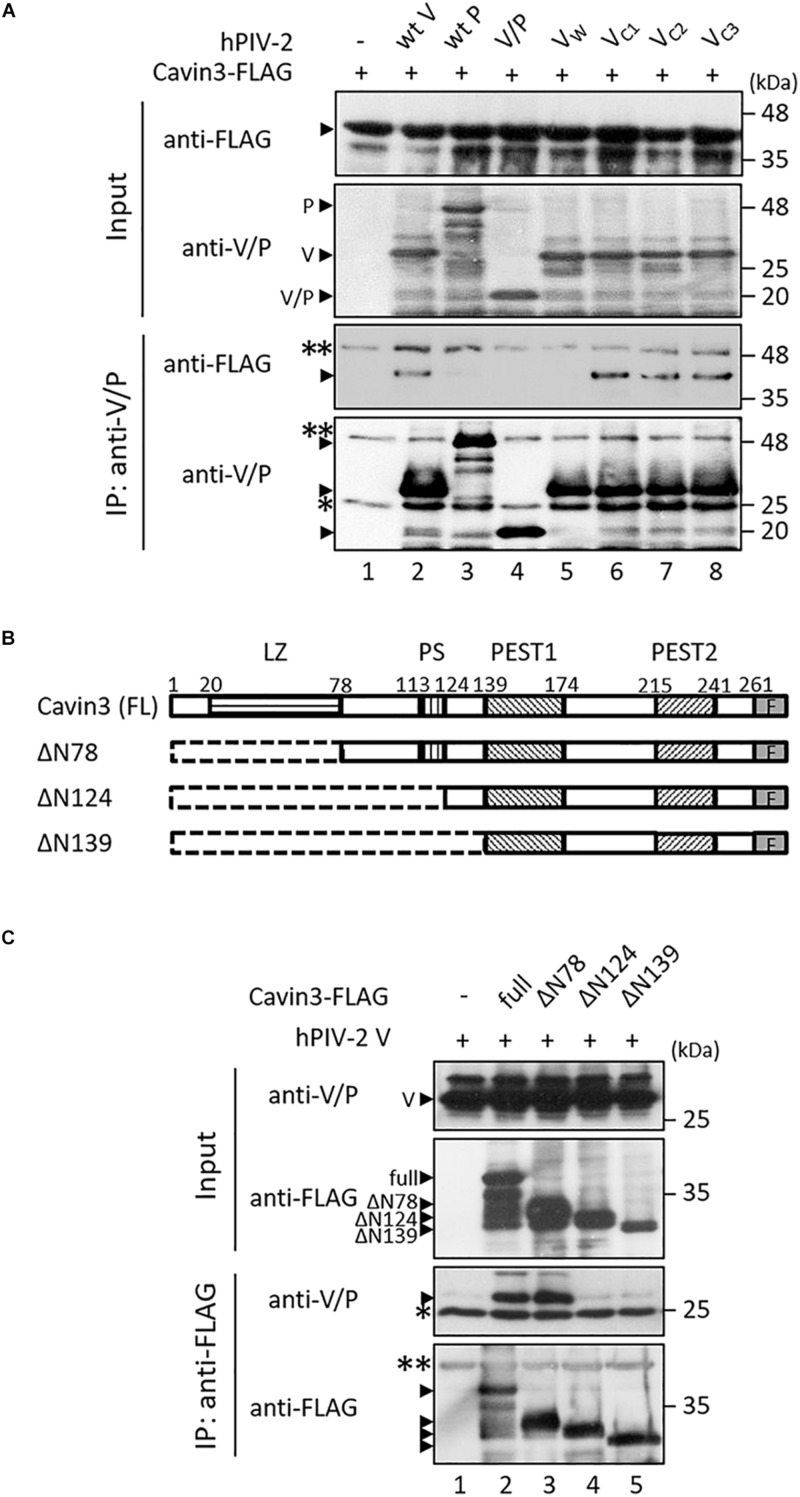
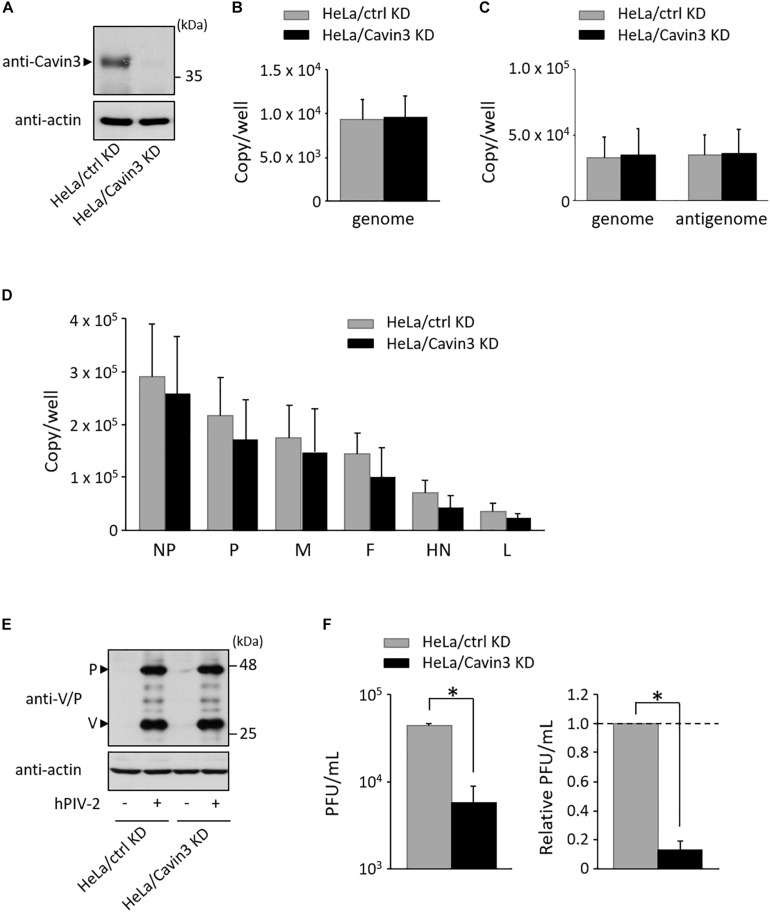
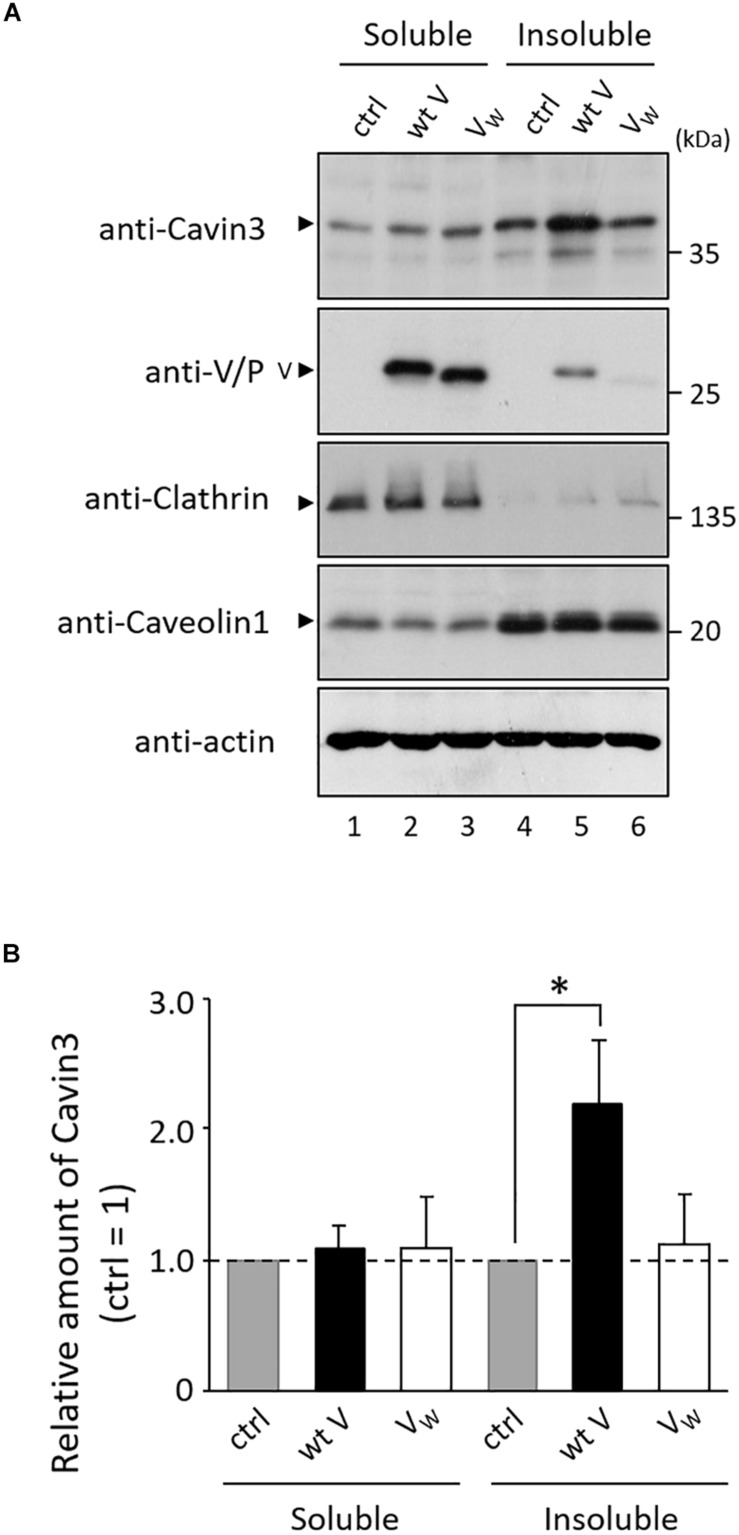
Cavin proteins have important roles in the formation of caveolae in lipid raft microdomains. Pulse-chase experiments of cells infected with human parainfluenza virus type 2 (hPIV-2) showed decreased proteasomal degradation of Cavin3. Overexpression of hPIV-2 V protein alone was sufficient to inhibit Cavin3 degradation. Immunoprecipitation analysis revealed that V protein bound to Cavin3. Trp residues within C-terminal region of V protein, as well as the N-terminal region of Cavin3, are important for V-Cavin3 interaction. Cavin3 knockdown suppressed hPIV-2 growth without affecting its entry, replication, transcription, or translation. Higher amounts of Cavin3 were observed in V protein-overexpressing cells than in control cells in lipid raft microdomains. Our data collectively suggest that hPIV-2 V protein binds to and stabilizes Cavin3, which in turn facilitates assembly and budding of hPIV-2 in lipid raft microdomains.

Keywords: Cavin3; V protein; caveolae; human parainfluenza virus type 2; lipid raft.


Figures

FIGURE 1
FIGURE 1
Amino acid sequences of the V-specific region of hPIV-2 V proteins. Trp and Cys residues are marked with filled circles and filled squares, respectively. Trp- and Cys-mutated V proteins used in this study are also shown.
FIGURE 2
FIGURE 2
Effects of hPIV-2 infection on Cavin3 degradation. (A) HeLa cells were infected with or without hPIV-2 at an MOI of 1 for 1 day, and the cell lysates were subjected to immunoblot using the indicated Abs. Actin was used as a loading control. Bars show the quantitative densitometry of Cavin3 using ImageJ software (http://rsb.info.nih.gov/ij). The data are the means from three independent experiments, and are shown as the relative value (mock = 1). *P < 0.05, compared to values of mock. Error bars indicate standard deviations. (B) HeLa cells were infected with hPIV-2 under the same conditions as in (A), total RNA was extracted, and the Cavin3 mRNA level was measured using qRT-PCR. The Cavin3 mRNA level was normalized to GAPDH mRNA expression. The data are the means from three independent experiments, and are presented as the relative values (mock = 1). Error bars indicate standard deviations. (C) HeLa cells were infected with hPIV-2 under the same conditions as in (A), and then labeled with [35S]methionine/cysteine (20 μCi/mL) for 2 h. After removal of labeled methionine/cysteine, cells were chased in normal DMEM for the indicated times (top panel). The experiments were also performed in the presence of 0.1 μg/mL MG132 during pulse and chase periods (third panel). The cell lysates were analyzed by immunoprecipitation using anti-Cavin3 pAb or anti-GAPDH mAb and SDS-PAGE. GAPDH was used as a control (second and bottom panel). (D) The quantitative densitometry of Cavin3 and GAPDH in (C) was performed as described in (A). The data are the means from more than three independent experiments, and are shown as the relative value (chase 0 h = 1). *P < 0.05, compared to values of Cavin3 amounts in mock cells. Error bars indicate standard deviations.
FIGURE 3
FIGURE 3
Effects of V protein on Cavin3 degradation. (A) HeLa cells were infected with wt hPIV-2 or rPIV-2/VW178H/W182E/W192A (rPIV-2/VW), and the cell lysates were subjected to immunoblot using anti-V/P mAb (upper panel). Actin was used as a loading control. Pulse-chase experiments of Cavin3 and GAPDH in the infected cells were performed as shown in Figure 2C. The line graph shows the quantitative densitometry of Cavin3 and GAPDH performed as described in Figure 2D. GAPDH was used as a control. *P < 0.05, compared to values of mock. (B) The lysates of HeLa/ctrl, HeLa/wt V, and HeLa/VW178H/W182E/W192A (HeLa/VW) were subjected to immunoblot using anti-V/P mAb (upper panel). Actin was used as a loading control. These cell lines were subjected to pulse-chase experiments as described in Figure 2C. The line graph shows the quantitative densitometry of Cavin3 and GAPDH performed as shown in Figure 2D. GAPDH was used as a control. *P < 0.05, compared to values of HeLa/ctrl. All experiments were performed at least three times independently.
FIGURE 4
FIGURE 4
Interactions between Cavin3 and hPIV-2 proteins. (A,C) COS cells were transfected with various combinations of the indicated plasmids. V/P indicates a deletion mutant composed of only common regions of V and P proteins. VW, VC1, VC2, and VC3 indicate VW178H/W182E/W192A, VC193/197A, VC209/211/214A, and VC218/221A, respectively. After 2 days, cell lysates were analyzed directly by immunoblotting (input). Immunoprecipitates with anti-V/P (A) or anti-FLAG mAb (C) were probed by anti-FLAG and anti-V/P mAbs. Double and single asterisks indicate immunoglobulin heavy chain and light chain, respectively. All experiments were performed at least three times independently. (B) Schematic diagram of full-length (FL) Cavin3 and its deletion mutants with C-terminal FLAG tag (F) was shown. Cavin3 contains leucine zipper (LZ), two PEST domains (PEST1 and PEST2), and phosphatidylserine-binding sites (PS). Deleted regions are indicated by the dotted lines.
FIGURE 5
FIGURE 5
Effects of Cavin3 on hPIV-2 growth. (A) Lysates of the indicated cell lines were subjected to immunoblot using anti-Cavin3 pAb. Actin was used as a loading control. (B) HeLa/ctrl KD and HeLa/Cavin3 KD were incubated with hPIV-2 at an MOI of 1 for 60 min. The cells were then washed with PBS, and total RNA was extracted using Isogen. Copy numbers of hPIV-2 genome were measured by qRT-PCR. The data are the means from six independent experiments. Error bars indicate standard deviations. (C,D) HeLa/ctrl KD and HeLa/Cavin3 KD were infected with hPIV-2 at an MOI of 1 for 1 day. Total RNA was extracted and copy number of hPIV-2 genome and antigenome (C) or mRNAs (D) were measured by qRT-PCR. (E,F) HeLa/ctrl KD and HeLa/Cavin3 KD were infected with hPIV-2 under the same conditions as in (C). The cell lysates were subjected to immunoblot using anti-V/P mAb (E). Actin was used as a loading control. The amount of viruses in the culture supernatants was measured by plaque assay (F). The values of PFU/mL are shown as the means from three independent experiments. Data are also shown as relative PFU/mL values (HeLa/ctrl KD = 1). *P < 0.05, compared to values of HeLa/ctrl KD. Error bars indicate standard deviations.
FIGURE 6
FIGURE 6
Effects of hPIV-2 infection on Cavin3 expression in lipid raft. (A) HeLa/ctrl, HeLa/wt V, and HeLa/VW178H/W182E/W192A (HeLa/VW) were extracted with 1% TritonX-100 at 4°C, and soluble and insoluble fractions were prepared as described in the Materials and Methods section. Cells were subjected to immunoblot using the indicated Abs. Clathrin and Caveolin1 were used as non-raft and raft markers, respectively. Actin was used as a loading control. (B) The quantitative densitometry of Cavin3 was performed as described in Figure 2D. Data are shown as the relative value (HeLa/ctrl = 1). *P < 0.05, compared to values of HeLa/ctrl. Error bars indicate standard deviations. All experiments were performed three times independently.

References

    1. Anderson R. G. (1998). The caveolae membrane system. Annu. Rev. Biochem. 67 199–225. 10.1146/annurev.biochem.67.1.199 - DOI - PubMed
    1. Breen M. R., Camps M., Carvalho-Simoes F., Zorzano A., Pilch P. F. (2012). Cholesterol depletion in adipocytes causes caveolae collapse concomitant with proteosomal degradation of cavin-2 in a switch-like fashion. PLoS One 7:e34516. 10.1371/journal.pone.0034516 - DOI - PMC - PubMed
    1. Brown G., Aitken J., Rixon H. W., Sugrue R. J. (2002). Caveolin-1 is incorporated into mature respiratory syncytial virus particles during virus assembly on the surface of virus-infected cells. J. Gen. Virol. 83 611–621. 10.1099/0022-1317-83-3-611 - DOI - PubMed
    1. Drab M., Verkade P., Elger M., Kasper M., Lohn M., Lauterbach B., et al. (2001). Loss of caveolae, vascular dysfunction, and pulmonary defects in caveolin-1 gene-disrupted mice. Science 293 2449–2452. 10.1126/science.1062688 - DOI - PubMed
    1. Fiedler K., Kobayashi T., Kurzchalia T. V., Simons K. (1993). Glycosphingolipid-enriched, detergent-insoluble complexes in protein sorting in epithelial cells. Biochemistry 32 6365–6373. 10.1021/bi00076a009 - DOI - PubMed

LinkOut - more resources