. 2020 Apr 30:11:788.
doi: 10.3389/fimmu.2020.00788. eCollection 2020.

AID Overlapping and Polη Hotspots Are Key Features of Evolutionary Variation Within the Human Antibody Heavy Chain (IGHV) Genes

Affiliations

AID Overlapping and Polη Hotspots Are Key Features of Evolutionary Variation Within the Human Antibody Heavy Chain (IGHV) Genes

Catherine Tang et al. Front Immunol. .

Abstract

Somatic hypermutation (SHM) of the immunoglobulin variable (IgV) loci is a key process in antibody affinity maturation. The enzyme activation-induced deaminase (AID), initiates SHM by creating C → U mismatches on single-stranded DNA (ssDNA). AID has preferential hotspot motif targets in the context of WRC/GYW (W = A/T, R = A/G, Y = C/T) and particularly at WGCW overlapping hotspots where hotspots appear opposite each other on both strands. Subsequent recruitment of the low-fidelity DNA repair enzyme, Polymerase eta (Polη), during mismatch repair, creates additional mutations at WA/TW sites. Although there are more than 50 functional immunoglobulin heavy chain variable (IGHV) segments in humans, the fundamental differences between these genes and their ability to respond to all possible foreign antigens is still poorly understood. To better understand this, we generated profiles of WGCW hotspots in each of the human IGHV genes and found the expected high frequency in complementarity determining regions (CDRs) that encode the antigen binding sites but also an unexpectedly high frequency of WGCW in certain framework (FW) sub-regions. Principal Components Analysis (PCA) of these overlapping AID hotspot profiles revealed that one major difference between IGHV families is the presence or absence of WGCW in a sub-region of FW3 sometimes referred to as "CDR4." Further differences between members of each family (e.g., IGHV1) are primarily determined by their WGCW densities in CDR1. We previously suggested that the co-localization of AID overlapping and Polη hotspots was associated with high mutability of certain IGHV sub-regions, such as the CDRs. To evaluate the importance of this feature, we extended the WGCW profiles, combining them with local densities of Polη (WA) hotspots, thus describing the co-localization of both types of hotspots across all IGHV genes. We also verified that co-localization is associated with higher mutability. PCA of the co-localization profiles showed CDR1 and CDR2 as being the main contributors to variance among IGHV genes, consistent with the importance of these sub-regions in antigen binding. Our results suggest that AID overlapping (WGCW) hotspots alone or in conjunction with Polη (WA/TW) hotspots are key features of evolutionary variation between IGHV genes.

Keywords: B cell receptor (BCR); activation induced deaminase (AID); computational immunology; dimensionality reduction; immunoglobulin heavy chain; somatic hypermutation (SHM); unsupervised learning.


Figures

Figure 1
Figure 1
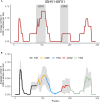
Identifying WGCW hotspot regions. (A) We show the moving window profile for WGCW overlapping AID hotspots for IGHV1-69. The shaded areas mark CDR1 and CDR2. (B) Site-by-site calculation of the average number of WGCW hotspots found in a window of size 31 (+/– 15 nt around each site). The bold line indicates the average across the 56 human IGHV genes and is colored according to sub-region. The shaded region represents +/– 1 standard deviation at each site.
Figure 2
Figure 2
Principal components analysis (PCA) of functional human IGHV genes. (A) PCA transformation of the WGCW hotspot distribution profiles for 56 functional human IGHV genes analyzed, known as PCA scores, with respect to the first two principal components (PC1 and PC2). The amount of variance from the WGCW hotspot distribution profiles captured by each PC is shown in parentheses. Each gene is colored according to its corresponding IGHV family. Gene labels located far from their corresponding dot are attached by a fine line to overcome the problems of overlapping and nearby numbers. (B) PCA loadings plot where each dot represents a site and its relative contribution to each of the first two PCs. Distance from the origin (where PC1 and PC2 intersect) signifies the magnitude of each site's loadings contribution. Colors indicate the sub-region of each site. Dots enclosed by colored lines indicate high-contributing sites for each category (CDR1, CDR2, FW3).
Figure 3
Figure 3
Distribution of mutation frequency between WGCW/WA sub-regions and non-WGCW/WA sub-regions. The distribution of the observed mutation frequencies is shown separately for WGCW/WA sub-regions (blue), and non-WGCW/WA sub-regions (red) for each individual IGHV gene. One-sided t-tests comparing the two distributions were performed for each gene. Significant p-values are indicated by asterisks above each plot (*p < 0.05; **p < 0.01; ***p < 0.001; ****p < 0.0001).
Figure 4
Figure 4
PCA analysis of overlapping AID (WGCW) and Polη (WA/TW) hotspots. Plots equivalent to Figure 2 but using the combined overlapping AID and Polη (WGCW/WA) hotspot distributions. (A) Corresponding PCA scores of the co-localized profiles. Gray arrows point to IGHV genes with co-localized profiles enriched in CDR1; and black arrows indicate IGHV genes with an especially strong co-localization signal focused in CDR2. (B) Corresponding PCA loadings colored according to relevant sub-region. Gene labels located far from their corresponding dot are attached by a fine line to compensate for overlapping nearby labels.
Figure 5
Figure 5
Co-localized WGCW/WA profiles for functional and non-functional IGHV genes. Site-by-site calculation of the average number of WGCW/WA co-localized hotspots of found in a window of size 31 (+/– 15 nt around each site) for (A) functional IGHV genes and (B) non-functional IGHV genes. The bold line indicates the average across the respective genes and is colored according to sub-region. The shaded region represents +/– 1 standard deviation at each site.

References

    1. Rajewsky K. Clonal selection and learning in the antibody system. Nature. (1996) 381:751–8. 10.1038/381751a0 - DOI - PubMed
    1. Methot SP, Di Noia JM. Molecular mechanisms of somatic hypermutation and class switch recombination. Adv Immunol. (2017) 133:37–87. 10.1016/bs.ai.2016.11.002 - DOI - PubMed
    1. Pilzecker B, Jacobs H. Mutating for good: DNA damage responses during somatic hypermutation. Front Immunol. (2019) 10:438. 10.3389/fimmu.2019.00438 - DOI - PMC - PubMed
    1. Muramatsu M, Kinoshita K, Fagarasan S, Yamada S, Shinkai Y, Honjo T. Class switch recombination and hypermutation require activation-induced cytidine deaminase (AID), a potential RNA editing enzyme. Cell. (2000) 102:553–63. 10.1016/S0092-8674(00)00078-7 - DOI - PubMed
    1. Bransteitter R, Pham P, Scharff MD, Goodman MF. Activation-induced cytidine deaminase deaminates deoxycytidine on single-stranded DNA but requires the action of RNase. Proc Natl Acad Sci USA. (2003) 100:4102–7. 10.1073/pnas.0730835100 - DOI - PMC - PubMed

Publication types

MeSH terms

Substances