. 2020 Mar 9;13(3):219-228.
doi: 10.1007/s12195-020-00612-5. eCollection 2020 Jun.

Machine Learning Classification of Articular Cartilage Integrity Using Near Infrared Spectroscopy

Affiliations

Machine Learning Classification of Articular Cartilage Integrity Using Near Infrared Spectroscopy

Isaac O Afara et al. Cell Mol Bioeng. .

Abstract

Introduction: Assessment of cartilage integrity during arthroscopy is limited by the subjective visual nature of the technique. To address this shortcoming in diagnostic evaluation of articular cartilage, near infrared spectroscopy (NIRS) has been proposed. In this study, we evaluated the capacity of NIRS, combined with machine learning techniques, to classify cartilage integrity.

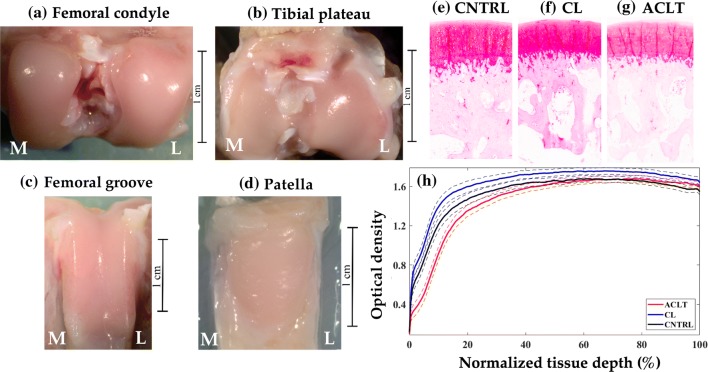
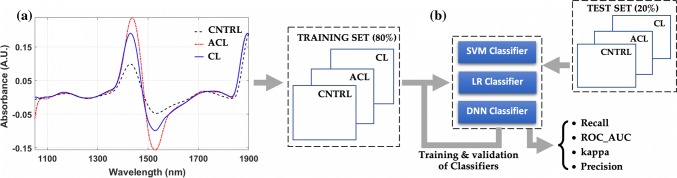
Methods: Rabbit (n = 14) knee joints with artificial injury, induced via unilateral anterior cruciate ligament transection (ACLT), and the corresponding contra-lateral (CL) joints, including joints from separate non-operated control (CNTRL) animals (n = 8), were used. After sacrifice, NIR spectra (1000-2500 nm) were acquired from different anatomical locations of the joints (n TOTAL = 313: n CNTRL = 111, n CL = 97, n ACLT = 105). Machine and deep learning methods (support vector machines-SVM, logistic regression-LR, and deep neural networks-DNN) were then used to develop models for classifying the samples based solely on their NIR spectra.

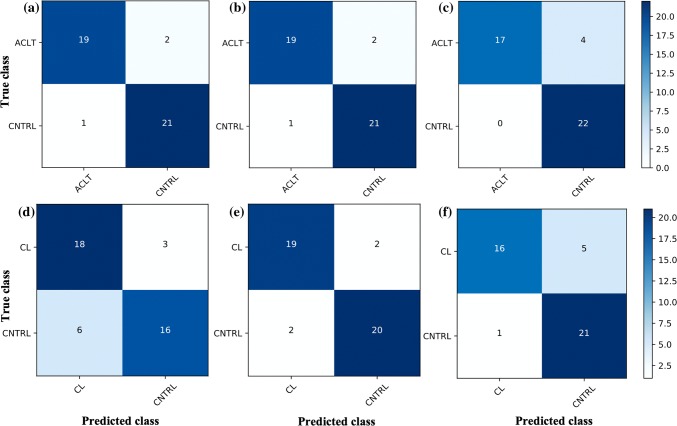
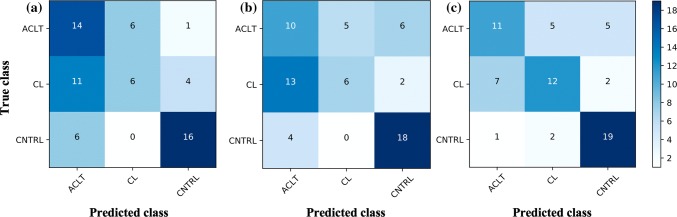
Results: The results show that the model based on SVM is optimal of distinguishing between ACLT and CNTRL samples (ROC_AUC = 0.93, kappa = 0.86), LR is capable of distinguishing between CL and CNTRL samples (ROC_AUC = 0.91, kappa = 0.81), while DNN is optimal for discriminating between the different classes (multi-class classification, kappa = 0.48).

Conclusion: We show that NIR spectroscopy, when combined with machine learning techniques, is capable of holistic assessment of cartilage integrity, with potential for accurately distinguishing between healthy and diseased cartilage.

Keywords: Cartilage; Classification; Deep learning; Machine learning; Near infrared spectroscopy; Osteoarthritis.


Figures

Figure 1
Figure 1
Rabbit knee joint showing anatomical locations (a–d) where spectral measurements were collected, and representative Safranin-O stained sections obtained from the medial femoral condyle of control (CNTRL, e), contra-lateral (CL, f) and anterior cruciate ligament transected (ACLT, g) joints. (h) shows the average (thick line) and 95% CI (dashed line) of proteoglycan (PG) content profile of samples from the different groups. [M medial, L lateral].
Figure 2
Figure 2
Schematic illustration of the analysis protocol showing (a) representative first derivative pre-processed NIR spectra and (b) protocol for training, validation, and testing of classifiers performance.
Figure 3
Figure 3
Confusion matrix showing prediction performance of the binary classification models. Performance of classifier 1 and classifier 2 models based on SVM (a: kernel = linear and C=10; d: C = 1000, gamma = 0.001, kernel = rbf), LR (b: regularization penalty = l2, C = 1000; e: regularization penalty = l1, C = 1000) and DNN (c and f) for predicting cartilage integrity in the independent test set, respectively. Optimal spectral preprocessing was based on Savitzky–Golay filtering with window size of 9, polynomial order of 2 and no derivative.
Figure 4
Figure 4
Confusion matrix of the best multi-class classification models based on SVM (a, kernel = linear, and C=100), LR (b: regularization penalty = l1, C = 1000) and DNN (c) The optimal spectral preprocessing was based on Savitzky–Golay filtering with window size of 9, polynomial order of 2 and no derivative.
Figure 5
Figure 5
Normalized feature importance of SVM classifier 1 (a) and LR classifier 2 (b) models.

References

    1. Afara IO, Hauta-Kasari M, Jurvelin JS, Oloyede A, Töyräs J. Optical absorption spectra of human articular cartilage correlate with biomechanical properties, histological score and biochemical composition. Physiol. Meas. 2015;36:1913–1928. doi: 10.1088/0967-3334/36/9/1913. - DOI - PubMed
    1. Afara IO, Moody H, Singh S, Prasadam I, Oloyede A. Spatial mapping of proteoglycan content in articular cartilage using near-infrared (NIR) spectroscopy. Biomed. Opt. Express. 2015;6:144–154. doi: 10.1364/BOE.6.000144. - DOI - PMC - PubMed
    1. Afara IO, Prasadam I, Arabshahi Z, Xiao Y, Oloyede A. Monitoring osteoarthritis progression using near infrared (NIR) spectroscopy. Sci. Rep. 2017;7:11463. doi: 10.1038/s41598-017-11844-3. - DOI - PMC - PubMed
    1. Afara I, Prasadam I, Crawford R, Xiao Y, Oloyede A. Non-destructive evaluation of articular cartilage defects using near-infrared (NIR) spectroscopy in osteoarthritic rat models and its direct relation to Mankin score. Osteoarthr. Cartil. 2012;20:1367–1373. doi: 10.1016/j.joca.2012.07.007. - DOI - PubMed
    1. Afara I, Singh S, Oloyede A. Application of near infrared (NIR) spectroscopy for determining the thickness of articular cartilage. Med. Eng. Phys. 2012;35:88–95. doi: 10.1016/j.medengphy.2012.04.003. - DOI - PubMed

LinkOut - more resources