. 2020 Apr 30:8:315.
doi: 10.3389/fbioe.2020.00315. eCollection 2020.

Development of Multifunctional Biopolymeric Auto-Fluorescent Micro- and Nanogels as a Platform for Biomedical Applications

Affiliations

Development of Multifunctional Biopolymeric Auto-Fluorescent Micro- and Nanogels as a Platform for Biomedical Applications

Arti Vashist et al. Front Bioeng Biotechnol. .

Abstract

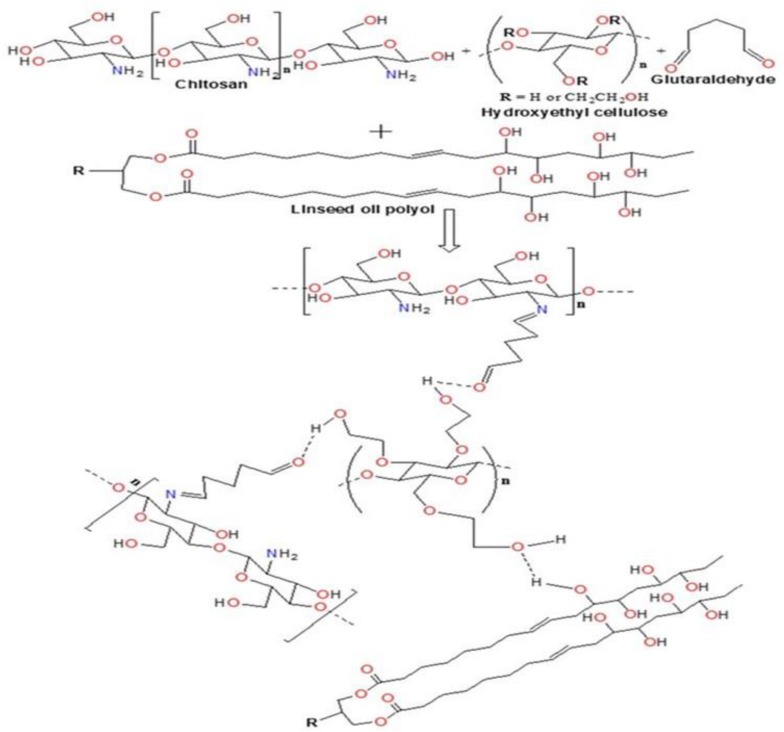
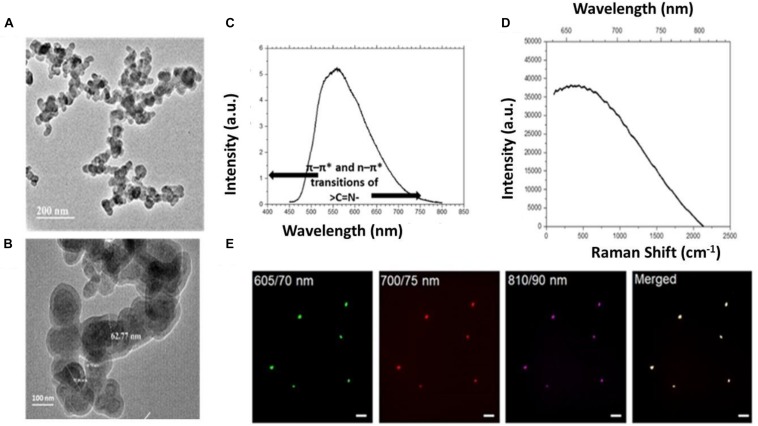
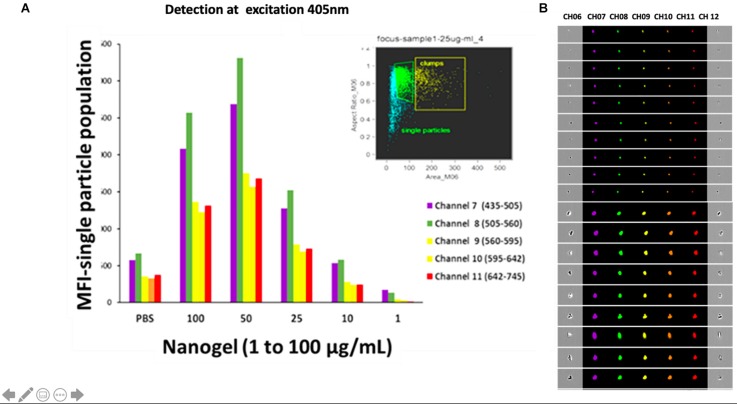
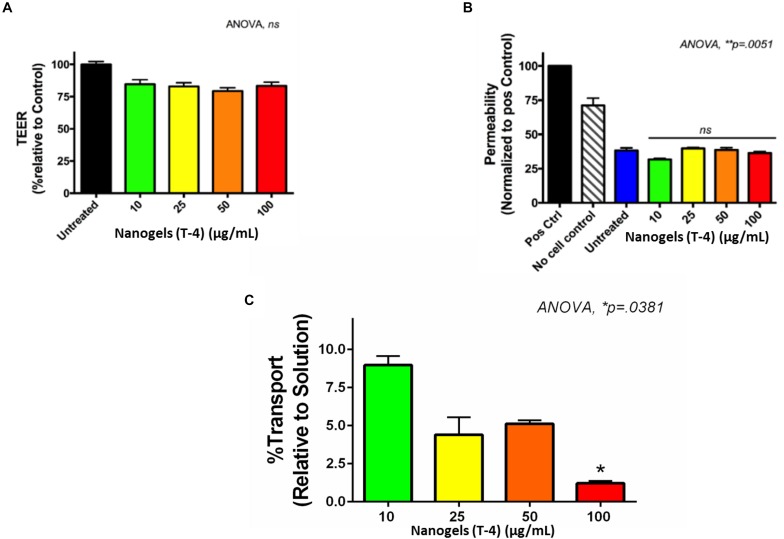
The emerging field of theranostics for advanced healthcare has raised the demand for effective and safe delivery systems consisting of therapeutics and diagnostics agents in a single monarchy. This requires the development of multi-functional bio-polymeric systems for efficient image-guided therapeutics. This study reports the development of size-controlled (micro-to-nano) auto-fluorescent biopolymeric hydrogel particles of chitosan and hydroxyethyl cellulose (HEC) synthesized using water-in-oil emulsion polymerization technique. Sustainable resource linseed oil-based polyol is introduced as an element of hydrophobicity with an aim to facilitate their ability to traverse the blood-brain barrier (BBB). These nanogels are demonstrated to have salient features such as biocompatibility, stability, high cellular uptake by a variety of host cells, and ability to transmigrate across an in vitro BBB model. Interestingly, these unique nanogel particles exhibited auto-fluorescence at a wide range of wavelengths 450-780 nm on excitation at 405 nm whereas excitation at 710 nm gives emission at 810 nm. In conclusion, this study proposes the developed bio-polymeric fluorescent micro- and nano- gels as a potential theranostic tool for central nervous system (CNS) drug delivery and image-guided therapy.

Keywords: biopolymers; microgels; nanogels; nanomedicine; theranostics.


Figures

FIGURE 1
FIGURE 1
Reaction scheme for the development of micro-and nanogels.
FIGURE 2
FIGURE 2
FT-IR analysis of nanogel.
FIGURE 3
FIGURE 3
(A,B) TEM analysis for nanogel particles. (C) Photoluminescence (PL) measurements 405 nm diode laser as excitation source in Ocean Optics USB 2000 fiber optic spectrometer. (D) Raman spectra analysis of the nanogels. (E) Representative images showing the autofluorescence exhibited by the nanogels acquired at the wavelength regions (emission wavelength/band-width) for red (605/70 nm), far-red (700/75 nm) and near infra-red (810/90 nm) regions; an overlay of merged image is also shown, scale – 20 μm.
FIGURE 4
FIGURE 4
(A) The mean intensity values of the single-particle population for each channel at an excitation wavelength of 405 nm. (B) Images acquired for the presence of fluorescence for and aggregated and single particle in each channel at an excitation wavelength of 405 nm.
FIGURE 5
FIGURE 5
Cytocompatibility testing of nanogels at various concentrations (5–100 μg/ml) as a function of time. (A) CHME-5; (B) astrocytes; (C) PBMCs. Cells were treated with various concentration of nanogel for 1, 2, 4, and/or 7 days. XTT assay performed on cells post nanogel exposure. Statistical significance determined by Two-way ANOVA and post hoc (Bonferroni post-tests) analysis, *p < 0.05, **p < 0.01, and ***p < 0.001.
FIGURE 6
FIGURE 6
Toxicity profiles and co-localization of nanogels with astrocytes after 7 day treatment of nanogels. (A) Control; (B) 100 upmug/ml. (C) Cellular uptake analysis of the nanogels as assessed by the differential interference contrast (DIC) imaging and by the fluorescent imaging at the wavelength/bandwidth range of 605/70, 700/75, and 810/90 nm, scale – 20 μm. The merged image on the right panel shows the overlay of all the images.
FIGURE 7
FIGURE 7
Qualitative and quantitative assessment of cellular uptake of nanogels using Flow Cytometry for (A,B) CHME-5: Statistical analysis: Data is represented as Mean ± SEM. Significance was tested by Student’s T-test which showed T4 50 μg/ml was significantly higher than Control (P = 0.02). Significance was also tested by one-way ANOVA which showed significance between columns (treatments), F(5, 28) = 2.786, P = 0.0365. Post hoc analysis with Tukey’s multiple comparisons tests showed T4 50 μg/ml was significantly higher than control (P = 0.03). (C,D) PBMCs: Statistical analysis: Data is represented as Mean ± SEM. Significance was tested by Student’s T-test which showed T4 100 μg/ml was significantly higher than Control (P = 0.03). Significance was also tested by one-way ANOVA which showed significance between columns (treatments), F(4, 23) = 2.995, P = 0.03. Post hoc analysis with Tukey’s multiple comparisons tests did not show any further significance. * means it is significant compared to control.
FIGURE 8
FIGURE 8
Combined reflectance confocal and two-photon imaging of nanogel uptake by Primary microglial cells at (A): (i) Control; (ii,iii) 6 h treatment; (B): (i) Control; (ii, iii) 24 h treatment of nanogels. Pseudocoloring: Red – confocal (or nearly confocal) reflectance at 780 nm; Green – Two-photon excitation fluorescence (400–633 nm range all together). Average laser power ranging from 5 to 20 mW.
FIGURE 9
FIGURE 9
In vitro- BBB model. (A) The TEER values of the in vitro BBB model after exposure of nanogels. (B) Permeability of the in vitro BBB model after nanogel treatment for 24 h. (C) % transport of nanogels across the in vitro BBB model.

References

    1. Alam M., Akram D., Sharmin E., Zafar F., Ahmad S. (2014). Vegetable oil based eco-friendly coating materials: a review article. Arab. J. Chem. 7 469–479. 10.1016/j.arabjc.2013.12.023 - DOI
    1. Allen T. M., Cullis P. R. (2004). Drug delivery systems: entering the mainstream. Science 303 1818–1822. 10.1126/science.1095833 - DOI - PubMed
    1. Anilkumar P., Cao L., Yu J.-J., Tackett K. N., Wang P., Meziani M. J., et al. (2013). Crosslinked carbon dots as ultra-bright fluorescence probes. Small 9 545–551. 10.1002/smll.201202000 - DOI - PubMed
    1. Atluri V. S. R., Kanthikeel S. P., Reddy P. V., Yndart A., Nair M. P. (2013). Human synaptic plasticity gene expression profile and dendritic spine density changes in HIV-infected human CNS cells: role in HIV-associated neurocognitive disorders (HAND). PLoS One 8:e61399. 10.1371/journal.pone.0061399 - DOI - PMC - PubMed
    1. Atluri V. S. R., Pilakka-Kanthikeel S., Garcia G., Jayant R. D., Sagar V., Samikkannu T., et al. (2016). Effect of cocaine on HIV infection and inflammasome gene expression profile in HIV infected macrophages. Sci. Rep. 6:27864. 10.1038/srep27864 - DOI - PMC - PubMed

LinkOut - more resources