. 2020 Apr 15;6(16):eaay0328.
doi: 10.1126/sciadv.aay0328. eCollection 2020 Apr.

Population phenomena inflate genetic associations of complex social traits

Affiliations

Population phenomena inflate genetic associations of complex social traits

Tim T Morris et al. Sci Adv. .

Abstract

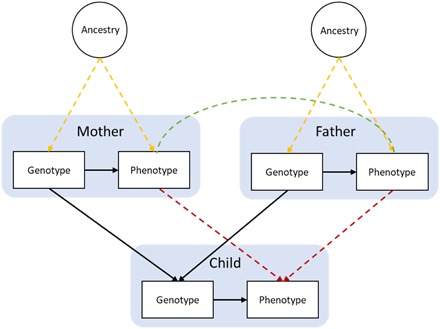
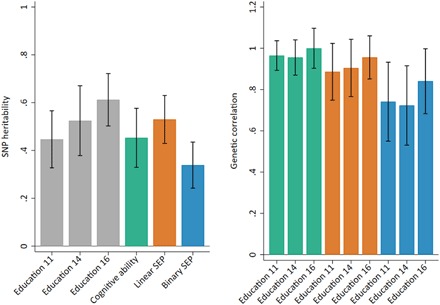
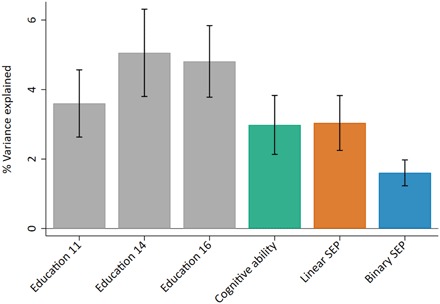
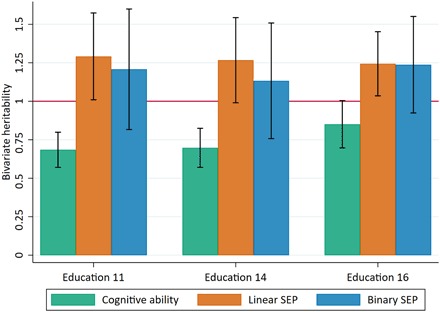
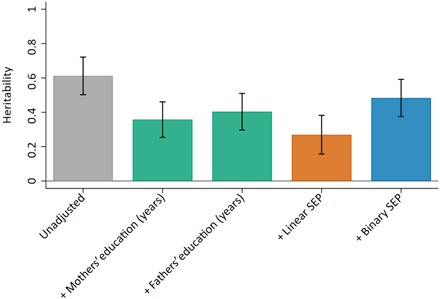
Heritability, genetic correlation, and genetic associations estimated from samples of unrelated individuals are often perceived as confirmation that genotype causes the phenotype(s). However, these estimates can arise from indirect mechanisms due to population phenomena including population stratification, dynastic effects, and assortative mating. We introduce these, describe how they can bias or inflate genotype-phenotype associations, and demonstrate methods that can be used to assess their presence. Using data on educational achievement and parental socioeconomic position as an exemplar, we demonstrate that both heritability and genetic correlation may be biased estimates of the causal contribution of genotype. These results highlight the limitations of genotype-phenotype estimates obtained from samples of unrelated individuals. Use of these methods in combination with family-based designs may offer researchers greater opportunities to explore the mechanisms driving genotype-phenotype associations and identify factors underlying bias in estimates.


Figures

Fig. 1
Fig. 1. Causal models of structures underlying genetic associations.
Population stratification due to ancestral differences (yellow lines), dynastic effects (red lines), and assortative mating (green line). Arrows represent direction of effect; nondirected lines represent simultaneous assortment. Note: Assortative mating by phenotype will lead to genotypic correlation (62).
Fig. 2
Fig. 2. SNP heritability and genetic correlations between phenotypes.
(A) Gray bars represent educational achievement measured as exam point scores at ages 11, 14, and 16; green bar represents cognitive ability measured at age 8; orange bar represents a linear measure of SEP measured as highest parental score on the Cambridge Social Stratification Score; blue bar represents a binary measure of SEP measured as “advantaged” for the highest two categories of Social Class based on Occupation and “disadvantaged” for the lower four categories. (B) Green bars represent genetic correlations between educational achievement at ages 11, 14, and 16 with cognitive ability measured at age 8; orange bars represent genetic correlations between educational achievement at ages 11, 14, and 16 with linear SEP; blue bars represent genetic correlations between educational achievement at ages 11, 14, and 16 with binary SEP. All analyses include adjustment for the first 20 principal components of population stratification. Parameter estimates in tables S1 and S2.
Fig. 3
Fig. 3. Variance explained in phenotypes by the educational achievement polygenic score.
Polygenic score constructed from SNPs associated with education at P < 5 × 10⁻⁸. Gray bars represent educational achievement measured as exam point scores at ages 11, 14, and 16; green bar represents cognitive ability measured at age 8; orange bar represents a linear measure of family SEP measured as highest parental score on the Cambridge Social Stratification Score; blue bar represents a binary measure of family SEP measured as advantaged for the highest two categories of Social Class based on Occupation and disadvantaged for the lower four categories. SEs were obtained through bootstrapping with 1000 replications. All analyses include adjustment for the first 20 principal components of population stratification. Parameter estimates in table S5.
Fig. 4
Fig. 4. Bivariate heritabilities between educational achievement, cognitive ability, and SEP.
Green bars represent cognitive ability measured at age 8; orange bars represent a linear measure of family SEP measured as highest parental score on the Cambridge Social Stratification Score; blue bars represent a binary measure of family SEP measured as advantaged for the highest two categories of Social Class based on Occupation and disadvantaged for the lower four categories. Educational achievement was measured as exam point scores at ages 11, 14, and 16. SEs were obtained through simulations (see Data and Methods). All analyses include adjustment for the first 20 principal components of population stratification. Parameter estimates in table S6.
Fig. 5
Fig. 5. Heritability of educational achievement adjusting for parental socioeconomic variables.
Gray bar represents the estimated heritability of educational achievement measured at age 16; green bars represent heritability adjusted for mothers’ and fathers’ years of education; orange bar represents heritability adjusted for linear SEP; blue bar represents heritability adjusted for binary SEP.

References

    1. Davey Smith G., Ebrahim S., ‘Mendelian randomization’: Can genetic epidemiology contribute to understanding environmental determinants of disease? Int. J. Epidemiol. 32, 1–22 (2003). - PubMed
    1. Evans L. M., Tahmasbi R., Vrieze S. I., Abecasis G. R., Das S., Gazal S., Bjelland D. W., de Candia T. R.; Haplotype Reference Consortium, Goddard M. E., Neale B. M., Yang J., Visscher P. M., Keller M. C., Comparison of methods that use whole genome data to estimate the heritability and genetic architecture of complex traits. Nat. Genet. 50, 737–745 (2018). - PMC - PubMed
    1. Belsky D. W., Moffitt T. E., Caspi A., Genetics in population health science: Strategies and opportunities. Am. J. Public Health 103, S73–S83 (2013). - PMC - PubMed
    1. R. Fisher, The Genetical Theory of Natural Selection (Oxford Univ. Press, 1930).
    1. Lee J. J., Chow C. C., The causal meaning of Fisher’s average effect. Genet. Res. 95, 89–109 (2013). - PMC - PubMed

Publication types

LinkOut - more resources