. 2020 Apr 15;6(16):eaaz2387.
doi: 10.1126/sciadv.aaz2387. eCollection 2020 Apr.

Aβ deposition is associated with increases in soluble and phosphorylated tau that precede a positive Tau PET in Alzheimer's disease

Affiliations

Aβ deposition is associated with increases in soluble and phosphorylated tau that precede a positive Tau PET in Alzheimer's disease

Niklas Mattsson-Carlgren et al. Sci Adv. .

Abstract

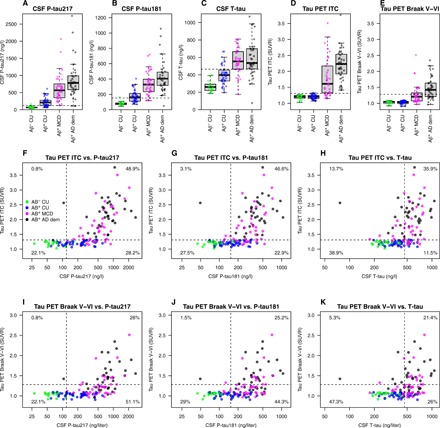
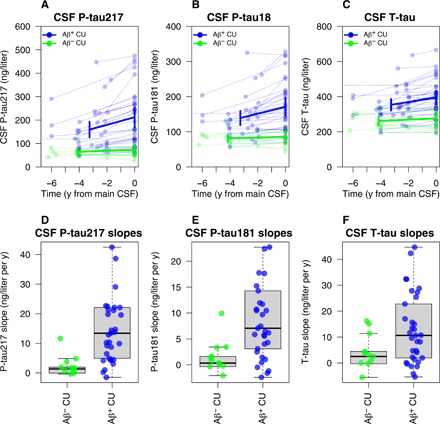
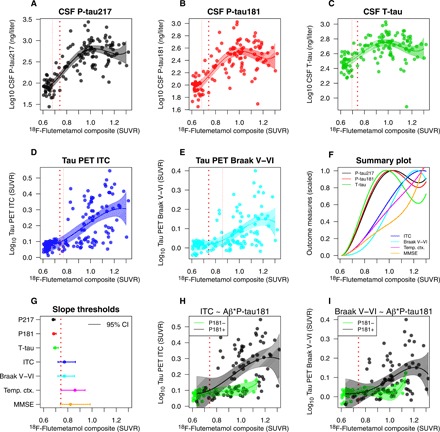
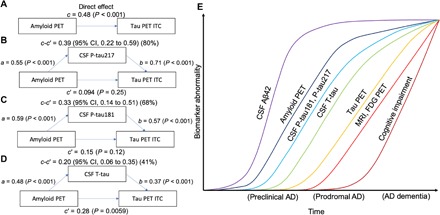
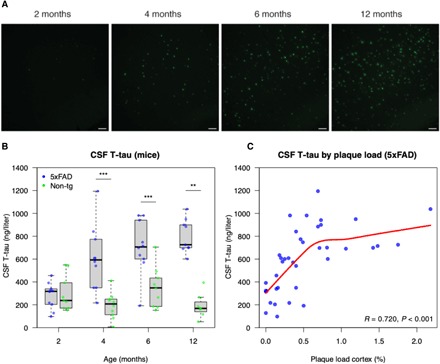
The links between β-amyloid (Aβ) and tau in Alzheimer's disease are unclear. Cognitively unimpaired persons with signs of Aβ pathology had increased cerebrospinal fluid (CSF) phosphorylated tau (P-tau181 and P-tau217) and total-tau (T-tau), which increased over time, despite no detection of insoluble tau aggregates [normal Tau positron emission tomography (PET)]. CSF P-tau and T-tau started to increase before the threshold for Amyloid PET positivity, while Tau PET started to increase after Amyloid PET positivity. Effects of Amyloid PET on Tau PET were mediated by CSF P-tau, and high CSF P-tau predicted increased Tau PET rates. Individuals with MAPT mutations and signs of tau deposition (but without Aβ pathology) had normal CSF P-tau levels. In 5xFAD mice, CSF tau increased when Aβ aggregation started. These results show that Aβ pathology may induce changes in soluble tau release and phosphorylation, which is followed by tau aggregation several years later in humans.


Figures

Fig. 1
Fig. 1. CSF P-tau and Tau PET biomarkers by Aβ and level of cognitive impairment.
(A to E) Tau biomarkers are shown by groups (Aβ CU, Aβ+ CU, Aβ + MCD, and Aβ+ AD dementia). Tau PET uptake was sampled in inferior temporal cortex (ITC) and from regions involved in Braak stage V–VI. Aβ+ CU had higher CSF P-tau181, P-tau217, and T-tau than Aβ CU (P ≤ 0.0001) but did not differ on the Tau PET measures (P = 0.57 to 0.71). Aβ+ individuals with MCD had higher levels of all CSF and PET tau measures, compared with both Aβ CU (CSF, P < 0.0001; PET, P ≤ 0.0032) and Aβ+ CU (CSF, P < 0.0001; PET, P < 0.0001). Aβ+ AD dementia had higher levels of all tau measures compared with all other groups (CSF, P ≤ 0.035; Tau PET, P ≤ 0.0013), except that there was no difference for CSF T-tau between Aβ+ with MCD or dementia (P = 0.37). The dashed lines indicate a priori cut points for tau biomarker positivity, defined in independent populations of CU (at mean plus two SDs) (36). (F to K) Concordance between CSF and PET tau measures. The percentages indicate proportions in each quadrant. Tau PET scans were done a median of 0.69 year (IQR, 0.23 to 1.05) after lumbar puncture. CDR, Clinical Dementia Rating (where 0.5 equals MCD without dementia, and ≥1 increasing stages of dementia); CU, cognitively unimpaired (CDR, 0); MCD, mild cognitive deficits (CDR, 0.5); dem, dementia (CDR, 1 to 3).
Fig. 2
Fig. 2. Longitudinal changes in CSF tau biomarkers.
Longitudinal CSF P-tau217 (A and D), P-tau181 (B and E), and T-tau (C and F) in CU individuals with an additional early sample, preceding the main CSF sample. Slope differences were tested in linear regression models, adjusted for age, sex, and time span between the two lumbar punctures. CSF P-tau217, CSF P-tau181, and CSF T-tau increased significantly more in Aβ+ CU than in Aβ CU individuals (P-tau217, difference: β = 13.8 ng/liter and year, P = 0.0054; P-tau181, difference: β = 8.7 ng/liter and year, P = 0.010; T-tau, difference: β = 9.55 ng/liter and year, P = 0.031).
Fig. 3
Fig. 3. Levels of CSF tau and Tau PET by continuous Amyloid PET load.
(A to E) CSF tau (A to C) and Tau PET (D and E) measures in relation to global cortical 18F-flutemetamol. The solid lines are fits from spline models of tau biomarkers on 18F-flutemetamol. The thick dotted line shows an a priori 18F-flutemetamol threshold (0.743 SUVR). The thin dotted lines indicate the 18F-flutemetamol level where tau biomarkers are significantly increased from baseline (where the biomarker increases at least two standard errors of the mean from the baseline). (F) A summary of all models, with all biomarkers on a common scale ranging from 0 (baseline levels) to 1 (the mean levels in the top 10 percentiles). For reference, the summary plot also includes corresponding models for temporal cortical thickness and global cognition (MMSE; with reversed values so that higher values always mean more pathological levels). Overall, the CSF biomarkers have steeper slopes (reaching their maximum values before Tau PET, atrophy, and cognition). (G) Summary of the thresholds for when significant changes are seen, including 95% confidence intervals (from a bootstrap procedure). The CSF biomarkers all increase early (before the a priori threshold for 18F-flutemetamol), while Tau PET, cortical atrophy, and cognitive decline start when 18F-flutemetamol is positive. (H and I) Spline models for Tau PET fit separately in individuals with negative and positive CSF P-tau181 (excluding one clear outlier with high Tau PET despite very low CSF tau), showing that the associations between 18F-flutemetamol and Tau PET were only present in individuals with positive CSF P-tau levels. All biomarkers were log10 transformed to facilitate the fit of the spline models.
Fig. 4
Fig. 4. CSF tau biomarkers as statistical mediators of the relationship between Amyloid PET and Tau PET.
(A to D) Mediation analysis of the relationship between Amyloid PET, CSF tau biomarkers, and Tau PET in ITC. Amyloid PET is the global cortical 18F-flutemetamol uptake [the direct effect (c) on Tau PET is shown in (A)]. Analyses are shown with CSF P-tau217 (B), CSF P-tau181 (C), and CSF T-tau (D) as mediators. The mediated effect is designated c-c′. The remaining effect of Amyloid PET on Tau PET after adjusting for the mediator is designated c′. The direct effect of Amyloid PET on the mediator is a, and the direct effect of the mediator on Tau PET is b. CSF P-tau217 and P-tau181 mediated a large part of the relationship between Amyloid PET and Tau PET. CSF T-tau was also significant, but to a smaller degree. These analyses included individuals who were CU or who had mild cognitive deficits, to focus the analyses on the effects of Aβ on tau in early stages of AD. To facilitate model comparisons, all models use continuous standardized (z scores) data for biomarkers. (E) A model synthesizing the findings in this study, together with previous literature (37), indicating an approximative ordering of how different measures change during the disease course. The results in this study suggest that changes in CSF P-tau181 and P-tau217 may start shortly after Amyloid PET. In parallel, or shortly thereafter, CSF T-tau may increase. Both CSF P-tau and T-tau markers start to change before significant uptake is detected by Tau PET. Approximate overall disease stages (preclinical, prodromal, and dementia) are indicated on the x axis. We acknowledge that there may be large interindividual differences in the timing of different events (especially changes in cognition) due to individual reserve and vulnerability factors that may modulate the relationships between different disease hallmarks. FDG, fluorodeoxyglucose.
Fig. 5
Fig. 5. CSF T-tau in 5xFAD mice.
CSF T-tau concentrations were measured in 5xFAD mice and age-matched nontransgenic littermates at 2 (5xFAD, n = 10; nontransgenic, n = 9), 4 (5xFAD, n = 10; nontransgenic, n = 10), 6 (5xFAD, n = 10; nontransgenic, n = 9), and 12 (5xFAD, n = 9; nontransgenic, n = 7) months of age. (A) Thioflavin S staining of 5xFAD mice cerebral cortex at different ages. Scale bars, 100 μm. (B) CSF T-tau concentrations in 5xFAD mice were significantly higher than those in nontransgenic littermates at 4, 6, and 12 months of age (Mann-Whitney U test; **P < 0.05 and ***P < 0.001). (C) CSF T-tau concentrations correlated significantly positive with amyloid plaque load in cortex when assessed over all age groups in 5xFAD mice [the statistic is Spearman’s Rho; the red line is a local regression fit using LOESS (locally estimated scatterplot smoothing)]. See table S1 for details.

References

    1. Goedert M., Tau filaments in neurodegenerative diseases. FEBS Lett. 592, 2383–2391 (2018). - PubMed
    1. Kimura T., Sharma G., Ishiguro K., Hisanaga S.-i., Phospho-tau bar code: Analysis of phosphoisotypes of tau and its application to tauopathy. Front. Neurosci. 12, 44 (2018). - PMC - PubMed
    1. Cicognola C., Brinkmalm G., Wahlgren J., Portelius E., Gobom J., Cullen N. C., Hansson O., Parnetti L., Constantinescu R., Wildsmith K., Chen H.-H., Beach T. G., Lashley T., Zetterberg H., Blennow K., Höglund K., Novel tau fragments in cerebrospinal fluid: Relation to tangle pathology and cognitive decline in Alzheimer’s disease. Acta Neuropathol. 137, 279–296 (2019). - PMC - PubMed
    1. Stancu I.-C., Vasconcelos B., Terwel D., Dewachter I., Models of β-amyloid induced Tau-pathology: The long and “folded” road to understand the mechanism. Mol. Neurodegener. 9, 51 (2014). - PMC - PubMed
    1. Maia L. F., Kaeser S. A., Reichwald J., Hruscha M., Martus P., Staufenbiel M., Jucker M., Changes in amyloid-β and Tau in the cerebrospinal fluid of transgenic mice overexpressing amyloid precursor protein. Sci. Transl. Med. 5, 194re2 (2013). - PubMed

Publication types