. 2020 Apr 15;6(16):eaba0694.
doi: 10.1126/sciadv.aba0694. eCollection 2020 Apr.

Bypassing mitochondrial complex III using alternative oxidase inhibits acute pulmonary oxygen sensing

Affiliations

Bypassing mitochondrial complex III using alternative oxidase inhibits acute pulmonary oxygen sensing

Natascha Sommer et al. Sci Adv. .

Abstract

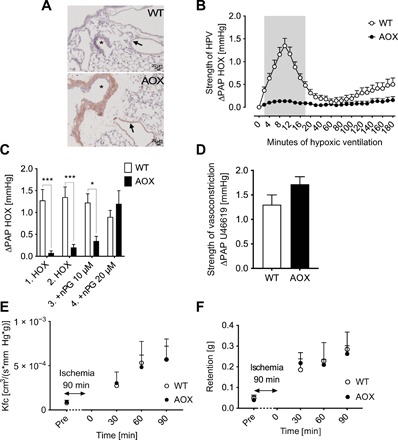
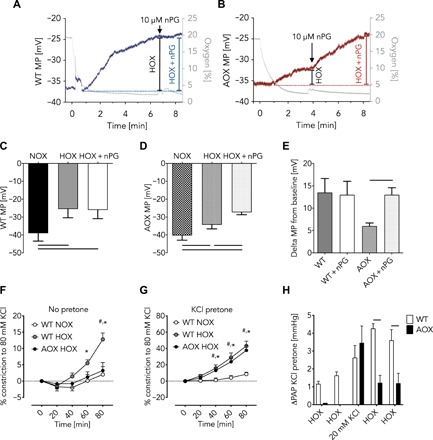
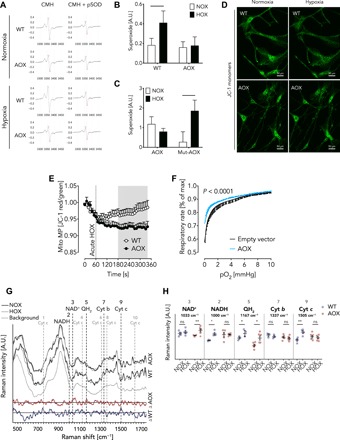
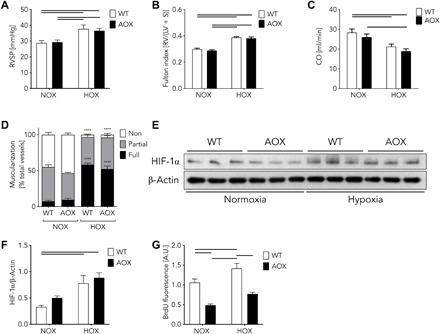
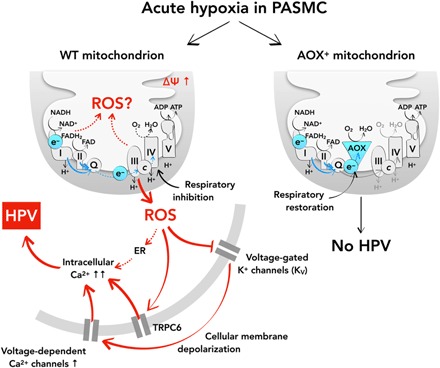
Mitochondria play an important role in sensing both acute and chronic hypoxia in the pulmonary vasculature, but their primary oxygen-sensing mechanism and contribution to stabilization of the hypoxia-inducible factor (HIF) remains elusive. Alteration of the mitochondrial electron flux and increased superoxide release from complex III has been proposed as an essential trigger for hypoxic pulmonary vasoconstriction (HPV). We used mice expressing a tunicate alternative oxidase, AOX, which maintains electron flux when respiratory complexes III and/or IV are inhibited. Respiratory restoration by AOX prevented acute HPV and hypoxic responses of pulmonary arterial smooth muscle cells (PASMC), acute hypoxia-induced redox changes of NADH and cytochrome c, and superoxide production. In contrast, AOX did not affect the development of chronic hypoxia-induced pulmonary hypertension and HIF-1α stabilization. These results indicate that distal inhibition of the mitochondrial electron transport chain in PASMC is an essential initial step for acute but not chronic oxygen sensing.


Figures

Fig. 1
Fig. 1. Acute HPV is absent in AOX-expressing isolated murine lungs.
(A) AOX protein expression detected as brownish color in bronchial walls (*) and pulmonary arteries (arrows). (B) PAP response of isolated, buffer-perfused WT and AOX murine lungs ventilated with 1% O2 for time as indicated. Data are shown as means ± SEM of n = 9 experiments. Gray area indicates significant difference with P < 0.05 tested by multiple t tests. (C) PAP response to hypoxic (HOX; 1% O2) challenge with and without AOX inhibitor nPG applied 5 min before sequential HOX. Data are shown as means ± SEM of n = 4 experiments. *P < 0.05, ***P < 0.001 for comparison as indicated, analyzed by two-way analysis of variance (ANOVA) and Sidak’s multiple comparisons test. (D) PAP response to pulmonary artery infusion of the thromboxane mimetic U46619. Data are shown as means ± SEM of n = 6 experiments. (E) Kfc after 90 min of ischemia. Data are shown as means ± SEM of n = 3 experiments. (F) Lung weight gain (retention) during reperfusion after 90 min of ischemia. Data are shown as means ± SEM of n = 3 experiments.
Fig. 2
Fig. 2. Hypoxia-induced cellular membrane depolarization is decreased in AOX-expressing PASMC.
(A and B) Representative traces of patch clamp measurements to determine cellular membrane potential (MP) during acute HOX (1% O2) in mouse WT (A) and AOX (B) PASMC. Gray traces depict oxygen concentration in %; blue (WT) and red (AOX) traces indicate MP in millivolts. Addition of AOX inhibitor nPG as indicated. Cellular MP in mouse WT (C) and AOX (D) PASMC during normoxia (NOX) and acute HOX or acute HOX plus nPG. (E) Change of cellular MP compared with NOX in the absence and presence of nPG as indicated. Data of (C) to (E) shown as means ± SEM of n = 6 experiments. Horizontal bars indicate significant difference with P < 0.05 analyzed by repeated-measures one-way ANOVA and Tukey’s multiple comparisons test. (F) Vasoconstriction of isolated pulmonary arteries during superfusion with hypoxic (1% O2) or normoxic KCl-free buffer shown as % of response to 80 mM KCl. Data are shown as means ± SEM of n = 8 experiments. *P < 0.05 WT NOX versus WT HOX; #P < 0.05 WT HOX versus AOX HOX analyzed by two-way ANOVA and Tukey’s multiple comparisons test. (G) Vasoconstriction as in (F) but in the presence of ~20 mM KCl. Data are shown as means ± SEM of n = 8 experiments. *P < 0.05 WT NOX versus WT HOX; #P < 0.05 WT NOX versus AOX HOX analyzed by two-way ANOVA and Tukey’s multiple comparisons test. (H) PAP response of isolated WT and AOX lungs during HOX (10% O2) ventilation before and after infusion of 20 mM KCl. Data are shown as means ± SEM of n = 3 experiments. Horizontal bars indicated significant difference with P < 0.05 analyzed by two-way ANOVA and Sidak’s multiple comparisons test.
Fig. 3
Fig. 3. AOX inhibits hypoxia-induced superoxide release and mitochondrial membrane hyperpolarization in PASMC and affects the redox state of mitochondrial biomarkers.
(A) Representative ESR spectra from mouse WT and AOX PASMC using the probe CMH and pSOD for control. (B) Superoxide production in mouse WT and AOX PASMC during exposure to normoxia (NOX) and hypoxia (HOX, 1% O2) for 5 min. A.U., arbitrary units. Data are shown as means ± SEM of n = 4 experiments. The horizontal bar indicates significant difference with P < 0.05 analyzed by two-way ANOVA and Sidak’s multiple comparisons test. (C) Superoxide production in WT mouse PASMC transfected with plasmids encoding native Ciona AOX or a catalytically inactive mutant AOX exposed to NOX and HOX. Data are shown as means ± SEM of n = 12 experiments. The horizontal bar indicates significant difference with P < 0.05 analyzed by two-way ANOVA and Sidak’s multiple comparisons test. No significant differences were detected between the genotypes. Data in (B) and (C) are depicted as the portion of CMH signal inhibited by pSOD. (D) Representative mouse WT and AOX PASMC stained with JC-1 under normoxia and hypoxia (1% O2) as indicated. (E) Mitochondrial MP (Mito MP) determined as JC-1 red/green ratio under acute HOX as indicated. Data are shown as means ± SEM of n = 10 (WT) and n = 12 (AOX) experiments. Gray area depicts significant difference with P < 0.05 analyzed by two-way ANOVA and uncorrected Fisher’s least significant difference (LSD). (F) Oxygen-dependent respiratory rate of 100,000 to 300,000 intact rPASMC per experiment transfected with an empty vector or AOX encoding plasmid. Data are shown as means ± SEM in % of rate at normoxia (max) with P < 0.0001 indicating significant difference between WT and AOX analyzed by paired t test. (G) Normalized fluorescence-corrected Savitzky-Golay reconstructed Raman spectra taken from WT (n = 4) and AOX (n = 6) PASMC before (black line = NOX) and after (gray line) exposure to acute hypoxia (HOX, 5% O2). Background spectrum from microfluidic system and buffer solution is shown as dashed line (n = 25). Differences between NOX and HOX are highlighted with a difference spectrum for each corresponding sample type (WT, blue; AOX, red). Peak locations for mitochondrial biomarkers NAD+ (3: 1033 cm−1), NADH (2: 1000 cm−1), ubiquinol (QH2; 5: 1167 cm−1), and cytochrome b (Cyt b; 7: 1337 cm−1) as well as peaks associated with reduced (1: 750 cm−1; 4: 1127 cm−1; 6: 1313 cm−1; 9: 1505 cm−1) and oxidized forms of Cyt c (8: 1369 cm−1; 10: 1638 cm−1) are shown as vertical dashed lines. (H) Raman intensity for individual biomarkers are shown as means ± SEM of n ≥ 3 experiments. ns, not significant. *P < 0.05; **P < 0.01; ***P < 0.001 analyzed by two-way ANOVA and uncorrected Fisher’s LSD.
Fig. 4
Fig. 4. Adaptation processes upon chronic hypoxia in WT and AOX transgenic mice.
(A) Right ventricular systolic pressure (RVSP) after normoxia (NOX) or hypoxia (HOX, 10% O2) for 28 days. Data are shown as means ± SEM of n ≥ 9 experiments. Horizontal bars indicate significant difference with P < 0.05 analyzed by two-way ANOVA and Tukey’s multiple comparisons test. (B) Ratios of right ventricle (RV) and left ventricle (LV) plus septum (S) (Fulton index). Data are shown as means ± SEM of n = 10 experiments. Horizontal bars indicate significant difference with P < 0.05 analyzed by two-way ANOVA and Tukey’s multiple comparisons test. (C) Cardiac output (CO) measured by echocardiography. Data are shown as means ± SEM of n = 10 experiments. Horizontal bars indicate significant difference with P < 0.05 analyzed by two-way ANOVA and Tukey’s multiple comparisons test. (D) Vascular remodeling quantified as degree of muscularization of small (20- to 70-μm diameter) pulmonary arterial vessels. Vessel muscularization categorized as non, partial, or full after immunostaining against α-smooth muscle actin as marker for PASMC and von Willebrand factor to discard endothelium. Data are shown as means ± SEM of n ≥ 4 experiments. ****P < 0.0001 NOX versus HOX analyzed by two-way ANOVA and Tukey’s multiple comparisons test. Note, no difference observed between WT versus AOX. (E) Western blots showing HIF-1α and β-actin expression in WT and AOX transgenic PASMC under normoxia and hypoxia. (F) Quantification of protein expression shown in (E). Data are shown as means ± SEM of n = 3 experiments. Horizontal bars indicate significant difference with P < 0.05 analyzed by two-way ANOVA and Sidak’s multiple comparisons test. (G) Proliferation assay of WT and AOX PASMC cultured under normoxia (NOX) or hypoxia (HOX, 1% O2) for 48 hours. Data are shown as means ± SEM of n = 9 experiments. Horizontal bars indicate significant difference with P < 0.05 analyzed by two-way ANOVA and Tukey’s multiple comparisons test. BrdU, bromodeoxyuridine.
Fig. 5
Fig. 5. Integration of present findings into current concepts of oxygen sensing and HPV in the murine lung.
Acute HPV depends on a central oxygen sensor within the mitochondrial respiratory chain. Hypoxia induces mitochondrial membrane hyperpolarization, an increase in mitochondrial superoxide release, and subsequent inhibition of cellular potassium channels (KV), which leads to cellular membrane depolarization and activation of voltage-gated calcium channels. This sequence of events results in intracellular calcium increase and HPV. AOX prevents HPV in mouse PASMC by preventing mitochondrial ROS production and release. This places mitochondria and electron flux through the mitochondrial respiratory chain at the top level in the hierarchy of oxygen sensing and signaling controlling HPV. ADP, adenosine diphosphate; FAD, flavin adenine dinucleotide.

References

    1. Sommer N., Strielkov I., Pak O., Weissmann N., Oxygen sensing and signal transduction in hypoxic pulmonary vasoconstriction. Eur. Respir. J. 47, 288–303 (2016). - PubMed
    1. Sylvester J. T., Shimoda L. A., Aaronson P. I., Ward J. P. T., Hypoxic pulmonary vasoconstriction. Physiol. Rev. 92, 367–520 (2012). - PMC - PubMed
    1. Mathew B., Lakshminrusimha S., Persistent pulmonary hypertension in the newborn. Children 4, 63 (2017). - PMC - PubMed
    1. Grimminger J., Richter M., Tello K., Sommer N., Gall H., Ghofrani H. A., Thin air resulting in high pressure: Mountain sickness and hypoxia-induced pulmonary hypertension. Can. Respir. J. 2017, 8381653 (2017). - PMC - PubMed
    1. Sommer N., Hüttemann M., Pak O., Scheibe S., Knoepp F., Sinkler C., Malczyk M., Gierhardt M., Esfandiary A., Kraut S., Jonas F., Veith C., Aras S., Sydykov A., Alebrahimdehkordi N., Giehl K., Hecker M., Brandes R. P., Seeger W., Grimminger F., Ghofrani H. A., Schermuly R. T., Grossman L. I., Weissmann N., Mitochondrial complex IV subunit 4 isoform 2 is essential for acute pulmonary oxygen sensing. Circ. Res. 121, 424–438 (2017). - PMC - PubMed

Publication types

LinkOut - more resources