. 2020 Apr 24;6(17):eaba3252.
doi: 10.1126/sciadv.aba3252. eCollection 2020 Apr.

Wireless smart contact lens for diabetic diagnosis and therapy

Affiliations

Wireless smart contact lens for diabetic diagnosis and therapy

Do Hee Keum et al. Sci Adv. .

Abstract

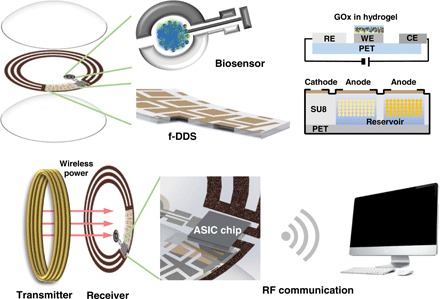
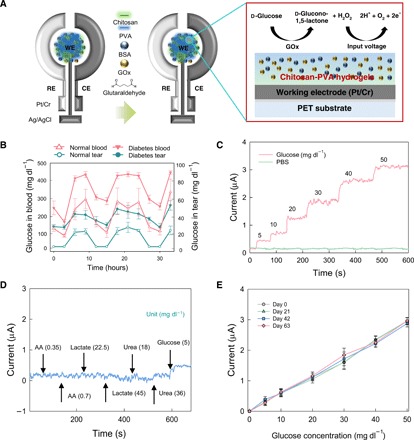
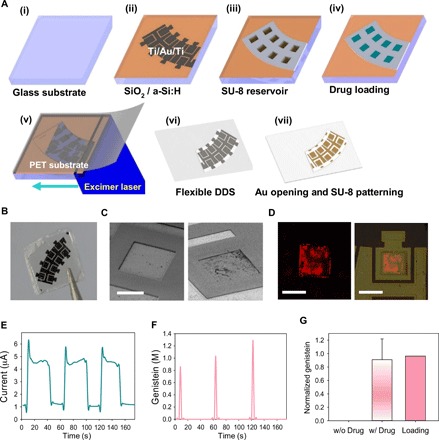
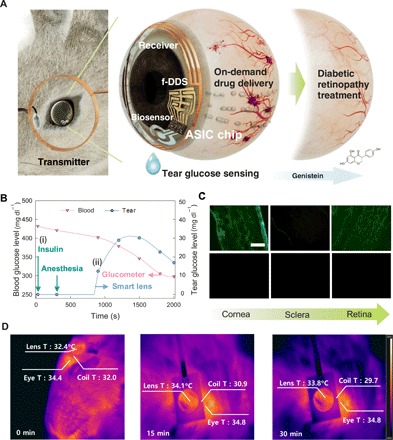
A smart contact lens can be used as an excellent interface between the human body and an electronic device for wearable healthcare applications. Despite wide investigations of smart contact lenses for diagnostic applications, there has been no report on electrically controlled drug delivery in combination with real-time biometric analysis. Here, we developed smart contact lenses for both continuous glucose monitoring and treatment of diabetic retinopathy. The smart contact lens device, built on a biocompatible polymer, contains ultrathin, flexible electrical circuits and a microcontroller chip for real-time electrochemical biosensing, on-demand controlled drug delivery, wireless power management, and data communication. In diabetic rabbit models, we could measure tear glucose levels to be validated by the conventional invasive blood glucose tests and trigger drugs to be released from reservoirs for treating diabetic retinopathy. Together, we successfully demonstrated the feasibility of smart contact lenses for noninvasive and continuous diabetic diagnosis and diabetic retinopathy therapy.


Figures

Fig. 1
Fig. 1. Schematic illustration of the smart contact lens for diabetic diagnosis and therapy.
The smart contact lens is embedded with a biosensor, an f-DDS, a wireless power transmission system from a transmitter coil to a receiver coil, an ASIC chip, and a remote communication system as a ubiquitous platform for various diagnostic and therapeutic applications.
Fig. 2
Fig. 2. In vitro electrical detection of ocular glucose sensors.
(A) Schematic illustration of an ocular glucose sensor with three electrodes (WE, working electrode; RE, reference electrode; CE, counter electrode) and the mechanism of glucose measurement in tear. (B) Correlation between blood and tear glucose levels in normal and diabetic rabbit models. (C) Real-time electrical detection of glucose concentrations compared with that of PBS. (D) Current change of the glucose sensor showing the selectivity to 0.35 and 0.7 mg dl−1 ascorbic acid (AA), 22.5 and 45 mg dl−1 lactate, 18 and 36 mg dl−1 urea, and 5 mg dl−1 glucose. (E) The long-term stability of the glucose sensor after storage for 0, 21, 42, and 63 days (n = 3).
Fig. 3
Fig. 3. On-demand drug delivery using an f-DDS.
(A) Schematic illustration for the fabrication of f-DDS. (i) Growing the buffer silicone dioxide (SiO2) layer on a glass substrate; (ii) deposition of Ti, Au, and Ti metals for anode and cathode electrodes; (iii) patterning SU8 drug reservoirs; (iv) drug loading; (v) attaching PET and laser scanning of the device; (vi) detaching f-DDS; and (vii) Ti etching with SU8 insulation. (B) Photograph of f-DDS. Photo credit: Beom Ho Mun, KAIST. (C) SEM images of f-DDS before and after gold electrochemistry test. Scale bar, 250 μm. (D) Confocal fluorescence microscopic images of rhodamine B dye released from drug reservoirs. Scale bars, 300 μm (left) and 500 μm (right). (E) Current change of the f-DDS. (F) Released concentration of genistein in a pulsatile manner. (G) Normalized content of genistein released from the reservoirs (n = 6) in comparison with the initial loading content.
Fig. 4
Fig. 4. In vivo applications of smart contact lens systems.
(A) Schematic illustration for in vivo diabetic diagnosis and therapy of the smart contact lens. (B) In vivo real-time wireless measurement of tear glucose levels with the smart contact lens. The blood and tear glucose levels were measured (i) after injection of insulin and anesthesia for wearing the smart contact lens in PBS. (ii) The tear glucose level increased due to the glucose in tears and decreased, reflecting the blood glucose level decrease due to the injected insulin. The blood glucose level was measured every 5 min with a commercial glucometer. (C) Fluorescence microscopic images of drugs absorbed in cornea, sclera, and retina of rabbits wearing the smart contact lens loaded with (top row) and without (bottom row) genistein. Scale bar, 0.1 mm. (D) Infrared thermal camera analysis for the temperature of the eye, smart contact lens, and transmitting coil after operating for 0, 15, and 30 min.
Fig. 5
Fig. 5. In vivo therapeutic effect of genistein released from the smart contact lens.
The eyes of diabetic rabbits were treated with (i) an eye drop of PBS (control), (ii) an eye drop of genistein, (iii) intravitreal injection of genistein, (iv) intravitreal injection of Avastin, and (v) genistein released from the smart contact lens. (A) Electron micrographs of the retinal vessels. L, lumen of vessel; EC, endothelial cell; RBC, red blood cell. Scale bar, 1 μm. (B) Fluorescence angiograms of the retina (arrowheads, retinal vessels). Scale bar, 0.2 mm. (C) Histological analysis for the damage to the retinal pigment epithelium (RPE) and choroidal vessels (CVs) (arrowheads, damage in CV). Scale bar, 0.1 mm. (D) Apoptosis detection in retina by TUNEL assay. Scale bar, 0.1 mm. (E) Merged images of immunohistochemistry staining for collagen type 4 (red) and PECAM-1 (green) with nuclear staining by 4′,6-diamidino-2-phenylindole (blue). Scale bar, 0.1 mm. (F) Fluorescence intensity of retinal choroidal neovascularization lesion quantified from the images of (B). (G) Fluorescence intensity of TUNEL assay quantified from the images of (D). (H) Immunochemical fluorescence intensity (E) of collagen type 4 (filled box) quantified from the images in fig. S9A (red) and PECAM-1 (dashed box) quantified from the images in fig. S9B (green) [n = 3, *P < 0.05 and **P < 0.01 versus the control sample of (i)].

References

    1. Chu B., Burnett W., Chung J. W., Bao Z., Bring on the bodyNET. Nature 549, 328–330 (2017). - PubMed
    1. Someya T., Bao Z., Malliaras G. G., The rise of plastic bioelectronics. Nature 540, 379–385 (2016). - PubMed
    1. Kim J., Campbell A. S., de Ávila B. E.-F., Wang J., Wearable biosensors for healthcare monitoring. Nat. Biotechnol. 37, 389–406 (2019). - PMC - PubMed
    1. Yamagishi K., Kirino I., Takahashi I., Amano H., Takeoka S., Morimoto Y., Fujie T., Tissue-adhesive wirelessly powered optoelectronic device for metronomic photodynamic cancer therapy. Nat. Biomed. Eng. 3, 27–36 (2019). - PubMed
    1. Lee H., Choi T. K., Lee Y. B., Cho H. R., Ghaffari R., Wang L., Choi H. J., Chung T. D., Lu N., Hyeon T., Choi S. H., Kim D.-H., A graphene-based electrochemical device with thermoresponsive microneedles for diabetes monitoring and therapy. Nat. Nanotechnol. 11, 566–572 (2016). - PubMed

Publication types

LinkOut - more resources