. 2020 May 13;6(20):eaaz3559.
doi: 10.1126/sciadv.aaz3559. eCollection 2020 May.

A novel proangiogenic B cell subset is increased in cancer and chronic inflammation

Affiliations

A novel proangiogenic B cell subset is increased in cancer and chronic inflammation

Willem van de Veen et al. Sci Adv. .

Abstract

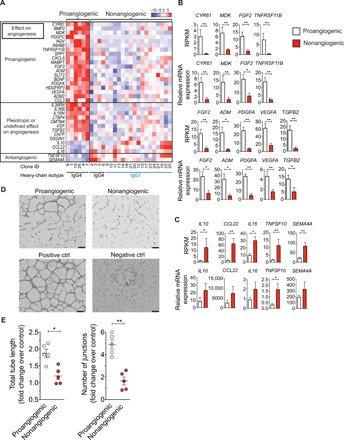
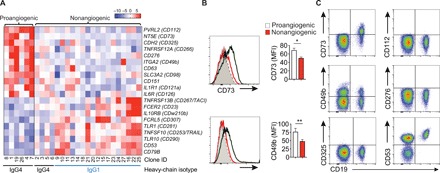
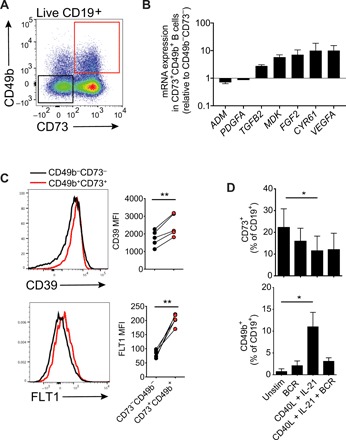
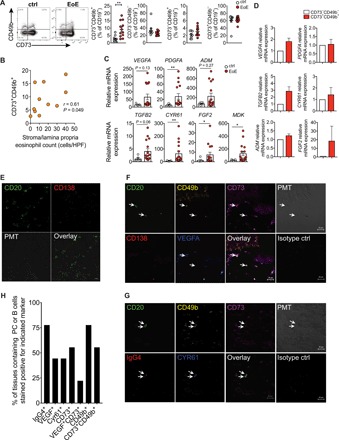
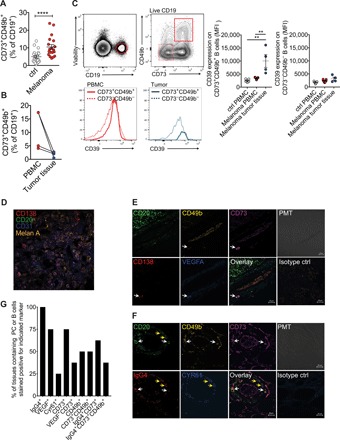
B cells contribute to immune responses through the production of immunoglobulins, antigen presentation, and cytokine production. Several B cell subsets with distinct functions and polarized cytokine profiles have been reported. In this study, we used transcriptomics analysis of immortalized B cell clones to identify an IgG4+ B cell subset with a unique function. These B cells are characterized by simultaneous expression of proangiogenic cytokines including VEGF, CYR61, ADM, FGF2, PDGFA, and MDK. Consequently, supernatants from these clones efficiently promote endothelial cell tube formation. We identified CD49b and CD73 as surface markers identifying proangiogenic B cells. Circulating CD49b+CD73+ B cells showed significantly increased frequency in patients with melanoma and eosinophilic esophagitis (EoE), two diseases associated with angiogenesis. In addition, tissue-infiltrating IgG4+CD49b+CD73+ B cells expressing proangiogenic cytokines were detected in patients with EoE and melanoma. Our results demonstrate a previously unidentified proangiogenic B cell subset characterized by expression of CD49b, CD73, and proangiogenic cytokines.


Figures

Fig. 1
Fig. 1. A subset of B cells promotes angiogenesis.
(A) Heat map showing gene-scaled (z score) log2 normalized counts of genes encoding secreted immunomodulatory proteins that are differentially expressed between proangiogenic B and nonangiogenic B cell clones (FDR < 0.01, log2 fold change > 0.5). The top box indicates genes with known proangiogenic effects, the middle box indicates genes with unknown or pleiotropic effects on angiogenesis, and the bottom box indicates genes with known anti-angiogenic effects. (B and C) Reads per kilobase million (RPKM) expression values from normal goat serum data (top) and real-time qPCR gene expression after prolonged (>3 weeks) in vitro expansion (bottom) of proangiogenic (n = 5) and nonangiogenic (n = 5) clones (mean ± SEM). *P < 0.05 and **P < 0.01, Mann-Whitney test. (B) Genes that were up-regulated in proangiogenic clones. (C) Genes that were down-regulated in proangiogenic clones. (D) Representative images of HUVEC tube formation assay to quantify proangiogenic effect of B cell clones (scale bars, 400 μm). Negative control, IMDM +2% FCS; positive control, EGM medium with growth factors. (E) Quantitative analysis of rate of HUVEC tube formation induced by supernatants of pro- and nonangiogenic B cell clones (mean ± SEM). *P < 0.05 and **P < 0.01, Mann-Whitney test.
Fig. 2
Fig. 2. Proangiogenic B cells are characterized by expression of CD49b and CD73.
(A) Heat map showing gene-scaled (z score) log2 normalized counts of CD marker–encoding genes that are differentially expressed between proangiogenic B and nonangiogenic B cell clones (FDR < 0.01, log2 fold change > 0.5). (B) Flow cytometry analysis of CD73 and CD49b surface expression on proangiogenic (black line) (n = 5) and nonangiogenic (red line) B cell clones (n = 20) (mean ± SEM). Grey dotted line indicates isotype control. *P < 0.05 and **P < 0.01, Mann-Whitney test. (C) Flow cytometry analysis of surface expression of CD73 and CD49b on freshly isolated peripheral blood B cells.
Fig. 3
Fig. 3. CD49b+CD73+ B cells form a distinct population of B cells and express proangiogenic cytokines.
(A) Gating of CD49b+CD73+ B cells in PBMCs of healthy donor. (B) mRNA expression of proangiogenic cytokines in B cell populations sorted based on their expression of CD49b and CD73 (n = 4). (C) Flow cytometric analysis of CD39 and FLT1 expression on CD49b+CD73+ B cells stained directly ex vivo. (D) Effect of 3-day in vitro stimulation of primary B cells on the expression of CD49b and CD73 (n = 4).
Fig. 4
Fig. 4. Proangiogenic B cell frequency is elevated in patients with EoE and correlates with esophageal eosinophil counts.
(A) Frequencies of circulating CD73+CD49b+, CD73CD49b, CD73CD49b+, and CD73+CD49b B cells in patients with EoE (n = 12) compared to healthy controls (n = 10). Dot plots show representative stainings of CD49b and CD73 among CD19+ live cells from healthy controls or patients with EoE. (B) Correlation of circulating CD73+CD49b+ B cell frequencies and stroma/lamina propria eosinophil count. HPF, high-power field. (C) mRNA expression of proangiogenic cytokines in esophageal biopsies of patients with EoE (n = 18). (D) mRNA expression of proangiogenic cytokines in purified peripheral CD73CD49b and CD73+CD49b+ B cells from patients with EoE (n = 4). (E) Confocal microscopy staining for CD20 and CD138 on an esophageal biopsy from a patient with EoE. (F) Confocal microscopy staining of CD20, CD49b, CD73, CD138, and VEGF on EoE esophageal biopsy. (G) Confocal microscopy staining of CD20, CD49b, CD73, IgG4, and CYR61 on EoE esophageal biopsy. (H) Frequencies of tissues stained positive for B cells expressing different markers. The percentage of tissues in which CD20+ or CD138+ cells expressing indicated markers were detected is shown (n = 9).
Fig. 5
Fig. 5. Proangiogenic B cells in patients with melanoma.
(A) Frequency of circulating CD73+CD49b+ B cells in patients with melanoma (n = 19) compared to healthy controls (n = 20). (B) Frequency of CD73+CD49b+ B cells in matched PBMC and tumor-derived single-cell suspensions. (C) Expression level of CD39 on CD73CD49b and CD73+CD49b+ B cells from PBMCs and tumor tissue. (D) Confocal microscopy staining for CD20, CD138, and Melan A on melanoma tumor tissue. (E) Confocal microscopy staining of CD20, CD49b, CD73, IgG4, and VEGFA on melanoma tumor tissue. Arrows indicate CD138+ plasma cells positive for CD49b, CD73, and VEGFA. (F) Confocal microscopy staining of CD20, CD49b, CD73, IgG4, and CYR61 on melanoma tumor tissue. White arrows indicate CD20+ B cells positive for CD49b, CD73, and IgG4. Yellow arrows indicate CD20+ B cells stained positive for IgG4 and CYR61. (G) Frequencies of tissues stained positive for B cells expressing different markers. The percentage of tissues in which CD20+ or CD138+ cells expressing indicated markers were detected is shown (n = 8).

References

    1. van de Veen W., Stanic B., Wirz O. F., Jansen K., Globinska A., Akdis M., Role of regulatory B cells in immune tolerance to allergens and beyond. J. Allergy Clin. Immunol. 138, 654–665 (2016). - PubMed
    1. Harris D. P., Haynes L., Sayles P. C., Duso D. K., Eaton S. M., Lepak N. M., Johnson L. L., Swain S. L., Lund F. E., Reciprocal regulation of polarized cytokine production by effector B and T cells. Nat. Immunol. 1, 475–482 (2000). - PubMed
    1. Bermejo D. A., Jackson S. W., Gorosito-Serran M., Acosta-Rodriguez E. V., Amezcua-Vesely M. C., Sather B. D., Singh A. K., Khim S., Mucci J., Liggitt D., Campetella O., Oukka M., Gruppi A., Rawlings D. J., Trypanosoma cruzi trans-sialidase initiates a program independent of the transcription factors RORγt and Ahr that leads to IL-17 production by activated B cells. Nat. Immunol. 14, 514–522 (2013). - PMC - PubMed
    1. Jour G., Ivan D., Aung P. P., Angiogenesis in melanoma: An update with a focus on current targeted therapies. J. Clin. Pathol. 69, 472–483 (2016). - PubMed
    1. De Palma M., Biziato D., Petrova T. V., Microenvironmental regulation of tumour angiogenesis. Nat. Rev. Cancer 17, 457–474 (2017). - PubMed

Publication types