. 2020 May 13;6(20):eaaz9165.
doi: 10.1126/sciadv.aaz9165. eCollection 2020 May.

Identification of distinct pathological signatures induced by patient-derived α-synuclein structures in nonhuman primates

Affiliations

Identification of distinct pathological signatures induced by patient-derived α-synuclein structures in nonhuman primates

M Bourdenx et al. Sci Adv. .

Abstract

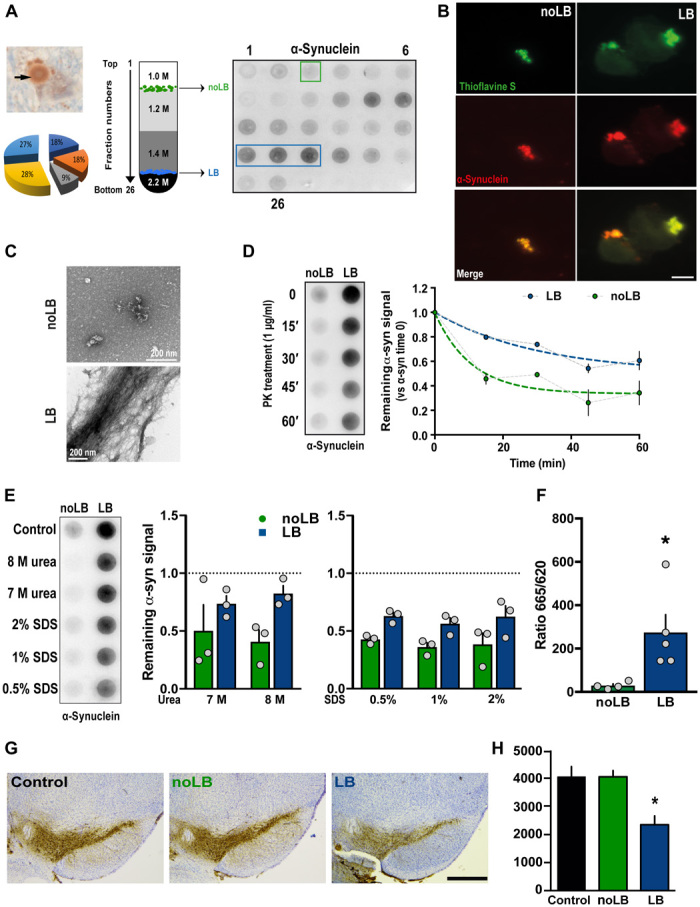
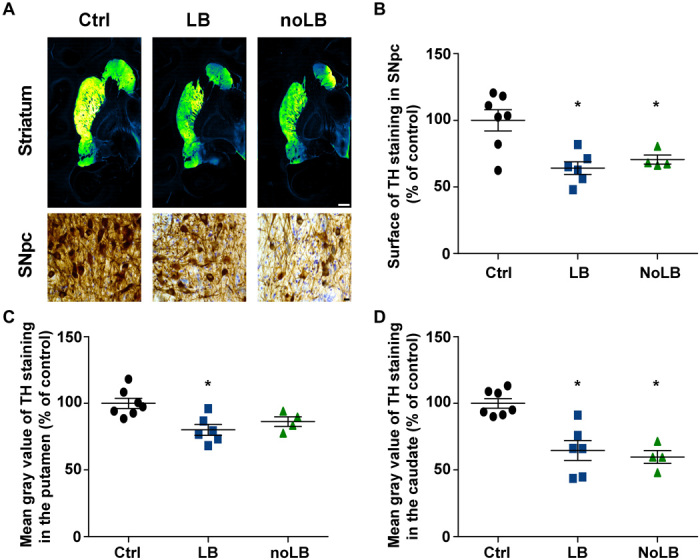
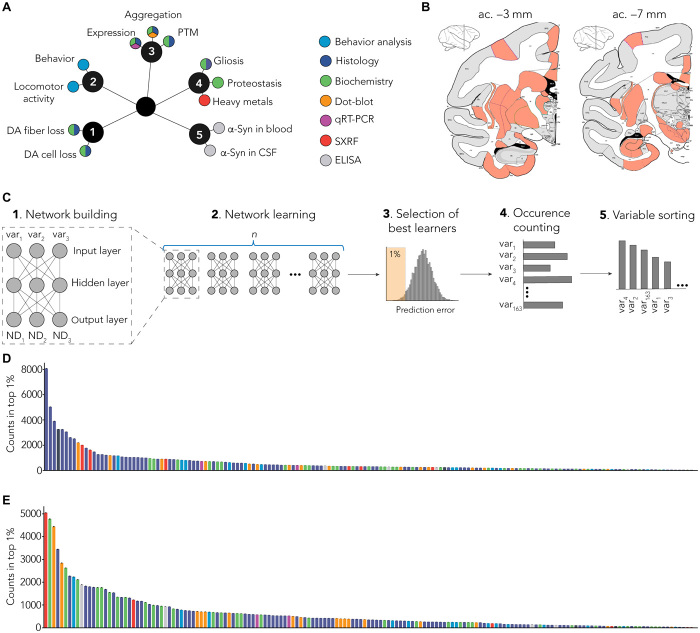
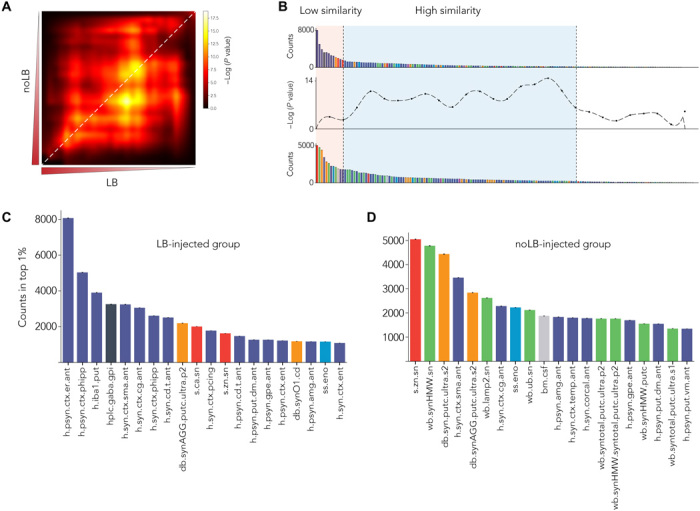
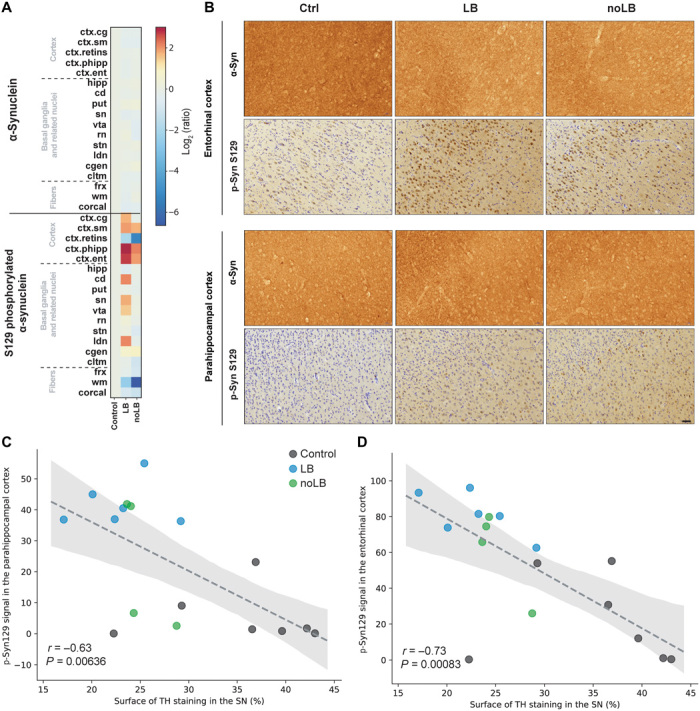
Dopaminergic neuronal cell death, associated with intracellular α-synuclein (α-syn)-rich protein aggregates [termed "Lewy bodies" (LBs)], is a well-established characteristic of Parkinson's disease (PD). Much evidence, accumulated from multiple experimental models, has suggested that α-syn plays a role in PD pathogenesis, not only as a trigger of pathology but also as a mediator of disease progression through pathological spreading. Here, we have used a machine learning-based approach to identify unique signatures of neurodegeneration in monkeys induced by distinct α-syn pathogenic structures derived from patients with PD. Unexpectedly, our results show that, in nonhuman primates, a small amount of singular α-syn aggregates is as toxic as larger amyloid fibrils present in the LBs, thus reinforcing the need for preclinical research in this species. Furthermore, our results provide evidence supporting the true multifactorial nature of PD, as multiple causes can induce a similar outcome regarding dopaminergic neurodegeneration.


Figures

Fig. 1
Fig. 1. Purification and characterization of LBs and noLB inocula from PD brains.
(A) Left: Immunohistochemistry image of α-syn–positive LB (arrows) in nigral postmortem brain samples (PD #1; α-syn in brown and neuromelanin in dark brown) before sucrose gradient purification. The pie chart indicates the relative contribution of the five patients to the final pool of LB and noLB inocula. Middle: Schematic representation of the sucrose gradient fractionation procedure used to purify LB/noLB-containing fractions from freshly frozen postmortem nigral brain tissue of five sporadic patients with PD. Right: Filter retardation assay probed with a human α-syn antibody to assess the presence of α-syn aggregates in the different fractions obtained by sucrose gradient fractionation from freshly frozen postmortem nigral brain tissue from sporadic patients with PD (PD #1). Green square indicates noLB-containing fraction, and blue rectangle highlights LB-containing fraction selected to prepare the mixture used for injections. (B) Confocal examination of purified noLB and LB fractions with α-syn immunofluorescence (red) and thioflavin S (green) staining. Both LB and noLB present thioflavin S–positive aggregates but much smaller in noLB fractions. Scale bar, 10 μm. (C) Ultrastructural examination of noLB and LB fractions by electron microscopy showing massive fibrils in LB fractions, while noLB fractions contain, besides soluble α-syn, some punctiform small-size aggregates. (D) noLB and LB fractions derived from PD brains (left) were treated with proteinase K (PK) (1 μg/ml) for 0, 15, 30, 45, and 60 min and analyzed by immunoblotting with syn211 antibody. The median effective concentration (EC50) value was determined as the concentration at which this ratio is decreased by 50%. The corresponding EC50 value for LB (>60 min) was approximately fourfold greater than with noLB (15.23 min). (E) noLB and LB fractions were treated for 6 hours with increasing concentrations of either urea or SDS or buffer as control. Syn211 was used to detect the forms of α-syn. The LB fractions appear to be more resistant to breakdown compared with noLB fractions in both urea (F1,8 = 6.063, P = 0.0392) and SDS treatments (F1,12 = 17.41, P = 0.0013). The dotted lines show levels of control fractions. Comparison was made using two-way analysis of variance (ANOVA). (F) TR-FRET immunoassay analysis of noLB and LB fractions. Fluorescence measurements were taken 20 hours after antibody. Analysis by unpaired Student’s t test (t7 = 2623, P = 0.0343). *P < 0.05. Means ± SEM, n = 4 to 5. (G) Representative pictures of tyrosine hydroxylase (TH)–positive SNpc neurons (brown; Nissl staining in purple) in noninjected and noLB- or LB-injected mice at 4 months after injections. Scale bar, 500 μm. (H) Quantification of TH-positive SNpc neurons by stereology in control and LB- and noLB-injected mice. Control mice, n = 10; LB-injected mice at 4 months, n = 10; noLB-injected mice at 4 months, n = 10. Comparison was made using one-way ANOVA followed by Tukey test for multiple comparisons. *P < 0.05 compared with control and noLB-injected mice at 4 months.
Fig. 2
Fig. 2. Intrastriatal injection of LB and noLB fractions from patients with PD induces nigrostriatal neurodegeneration in baboon monkeys.
(A) TH staining at striatum and SNpc levels. A green fire blue LUT (lookup table) was used to enhance contrast and highlight the difference between noninjected and LB- and noLB-injected baboon monkeys at the striatum level. Scale bars: 5 mm (striatum) and 10 μm (SNpc). (B) Scatter plot of TH immunostaining in SNpc (F2,14 = 9.439, P = 0.0025; control versus LB-injected, P = 0.0029; control versus noLB-injected, P = 0.0248). (C and D) Scatter plots of mean gray values of striatal TH immunoreactivity in the putamen (F2,14 = 7.313, P = 0.0067; control versus LB-injected, P = 0.0059) (C) and in the caudate (F2,14 = 16.25, P = 0.0002; control versus LB-injected, P = 0.0008; control versus noLB-injected, P = 0.0008) (D) in noninjected and LB- and noLB-injected baboon monkeys. The horizontal line indicates the average value per group ± SEM (n = 7 from control animals; n = 6 for LB-injected animals; n = 4 for noLB-injected animals). Comparison was made using one-way ANOVA and Tukey’s correction for multiple comparisons. *P < 0.05 compared with control animals.
Fig. 3
Fig. 3. MLP-based identification of specific signature.
(A) Several end points (n = 180) were measured using multiple methods (colors). End points can be grouped as clusters: (1) dopaminergic degeneration, (2) behavior, (3) α-syn–related pathology, (4) non–α-syn–related pathology, and (5) putative biomarkers. PTM, posttranslational modification; CSF, cerebrospinal fluid; qRT-PCR, quantitative reverse transcription polymerase chain reaction; DA, dopamine. (B) Multiple brain regions (n = 40) were investigated from coronal sections at two levels: anterior commissure (ac.), −3 mm (striatum and entorhinal cortex) and −7 mm (SNpc and hippocampus). SXRF, nano-synchrotron X-Ray fluorescence. (C) Detailed methodology. (1) Representative scheme of one MLP predicting three neurodegeneration-related variables (ND1, ND2, and ND3) with three experimental variables as input (var1, var2, and var3). Of the 180 variables measured in total, 163 were used as inputs for the MLP. (2) One MLP was trained for every unique combination of three variables. (3) Combinations were ranked on the basis their prediction error, and top 1% was selected for further analysis. (4) Combinations were deconvoluted to extract single variables and count occurrence of individual variables. (5) Variables were sorted on the basis of the number of occurrences in the top 1% of the best combination. (D) Raw ranking obtained for LB-injected animals. Color code highlights measurement methods as in (A). (E) Raw ranking obtained for noLB-injected animals. Color code highlights measurement methods as in (A).
Fig. 4
Fig. 4. Direct comparison of MLP-derived signatures shows specific pattern between experiment groups.
(A) RRHO test between variable sorting of LB- and noLB-injected animals. Highly enriched variables are in the lower left corner. Diagonal (highlighted by white dashed line) was extracted to do a bin-to-bin comparison between LB and noLB signatures. (B) Signatures were aligned with RRHO and show low similarity in highly enriched variables (light orange background) and higher similarity for lower rank variables (pale blue background). (C and D) First 20 enriched variables for both LB-injected animals (C) and noLB-injected animals (D). Color code is similar to Fig. 2A. Detailed of variable names can be found in table S1. Bars are means ± 99% confidence interval estimated by bootstrap.
Fig. 5
Fig. 5. Levels of α-syn and phosphorylated α-syn in different brain regions.
(A) Heat map representing the surface of α-syn and S129 phosphorylated α-syn immunostaining intensity in the brain of noninoculated and LB- and noLB-inoculated baboon monkeys. The heat maps show all brain regions measured and are organized according in three main groups: cortical, basal ganglia, and subcortical areas. From top to bottom: cingulate cortex (ctx.cg), sensorimotor cortex (ctx.sm), retro-insular cortex (ctx.retins), parahippocampal cortex (ctx.phipp), entorhinal cortex (ctx.ent), hippocampus (hipp), caudate nucleus (cd), putamen (put), substantia nigra (sn), ventral tegmental area (vta), red nucleus (rn), subthalamic nucleus (stn), lateral dorsal nucleus (ldn), lateral geniculate nucleus (cgen), claustrum (cltm), fornix (frx), white matter (wm), and corpus callosum (corcal). The color bars represent the log2 value of the ratio of each brain regions. (B) Representative pictures of α-syn and phosphorylated α-syn (p-Syn S129) staining in the entorhinal and parahippocampal cortices. (C and D) Correlation between levels of phosphorylated α-syn in the parahippocampal cortex (C) and the entorhinal cortex (D) with levels of TH staining in the substantia nigra (SN). Dashed lines indicate the linear regression. Gray area indicates the 95% confidence interval around of the linear regression.
Fig. 6
Fig. 6. Association metric shows independence of strong predictors and beneficial association of weaker predictors.
Both network plots were built using number of counts in the top 1% as node size and color and lift (association measure) as edges. To allow better visualization, only 10% of the strongest edges are shown. (A) Network plot for LB-injected animals showing independence of strong predictors: S129 phosphorylated α-syn (psyn) in the entorhinal (h.psyn.ctx.er) and the parahippocampal cortex (h.psyn.ctx.phipp), microglia activation in the putamen (h.iba1.put), α-syn in the cingulate cortex (h.syn.ctx.cg), and the supplementary motor area (h.syn.ctx.sma) and γ-aminobutyric acid (GABA) levels in the internal part of the globus pallidus (hlpc.gaba.gpi). Inset #1 highlights the association between actimetry measure (actim) and a scan-sampling measure of body direction toward a closed environment (ss.enf) with α-syn levels in the caudate nucleus (h.syn.cd), the red nucleus (h.syn.rn), and psyn in the sensorimotor cortex (h.psyn.ctx.sm). Inset #2 highlights the association between pathological α-syn in the putamen (wb.syn.put and db.syn.put) and the SNpc (db.syn.sn) as well as psyn in the ventral tegmental area (h.psyn.vta) and peripheral levels of α-syn in the plasma (bm.plasma). (B) Network plot for noLB-injected animals showing independence of strong predictors: levels of Zn in the SNpc (s.zn.sn), pathological α-syn in the putamen (db.syn.put), α-syn in the supplementary motor area (h.syn.ctx.sma), and aggregated α-syn in the SNpc (wb.synHMW.sn). Inset #3 highlights the association between autophagosomes (wb.lc3.put) and lysosomes (wb.lamp2.put) levels in the putamen and α-syn in the SNpc (wb.syn.sn). Inset #4 highlights the association between GABA levels in the internal part of the globus pallidus (hlpc.gaba.gpi), α-syn in the caudate nucleus (wb.syn.cd), and microglia activation in the entorhinal cortex (h.iba1.ctx.er). Inset #5 highlights the association between soluble (wb.syn.putc) and aggregated (wb.synHMW.putc) levels of α-syn in the putamen.

References

    1. Braak H., Del Tredici K., Rüb U., de Vos R. A. I., Jansen Steur E. N. H., Braak E., Staging of brain pathology related to sporadic Parkinson’s disease. Neurobiol. Aging 24, 197–211 (2003). - PubMed
    1. Kordower J. H., Chu Y., Hauser R. A., Freeman T. B., Olanow C. W., Lewy body-like pathology in long-term embryonic nigral transplants in Parkinson’s disease. Nat. Med. 14, 504–506 (2008). - PubMed
    1. Li J. Y., Englund E., Holton J. L., Soulet D., Hagell P., Lees A. J., Lashley T., Quinn N. P., Rehncrona S., Björklund A., Widner H., Revesz T., Lindvall O., Brundin P., Lewy bodies in grafted neurons in subjects with Parkinson’s disease suggest host-to-graft disease propagation. Nat. Med. 14, 501–503 (2008). - PubMed
    1. Mendez I., Viñuela A., Astradsson A., Mukhida K., Hallett P., Robertson H., Tierney T., Holness R., Dagher A., Trojanowski J. Q., Isacson O., Dopamine neurons implanted into people with Parkinson’s disease survive without pathology for 14 years. Nat. Med. 14, 507–509 (2008). - PMC - PubMed
    1. Dehay B., Vila M., Bezard E., Brundin P., Kordower J. H., Alpha-synuclein propagation: New insights from animal models. Mov. Disord. 31, 161–168 (2016). - PubMed

Publication types