

Interaction with single-stranded DNA-binding protein localizes ribonuclease HI to DNA replication forks and facilitates R-loop removal
- PMID: 32426857
- PMCID: PMC7934204
- DOI: 10.1111/mmi.14529
Interaction with single-stranded DNA-binding protein localizes ribonuclease HI to DNA replication forks and facilitates R-loop removal
Abstract
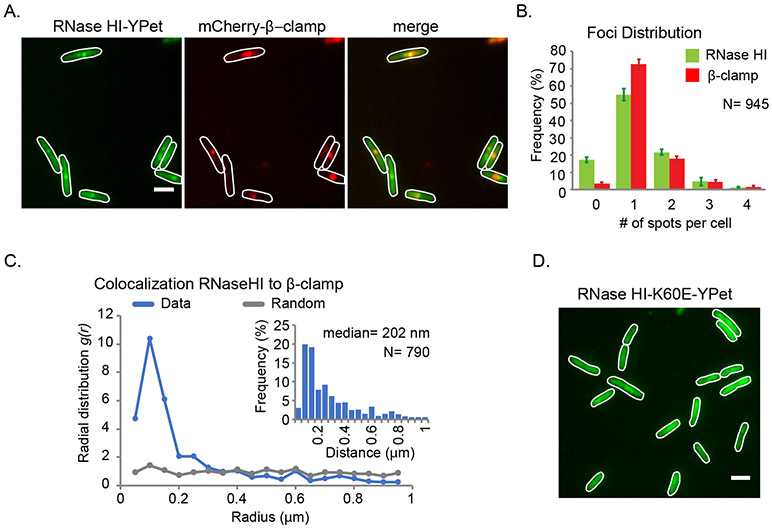
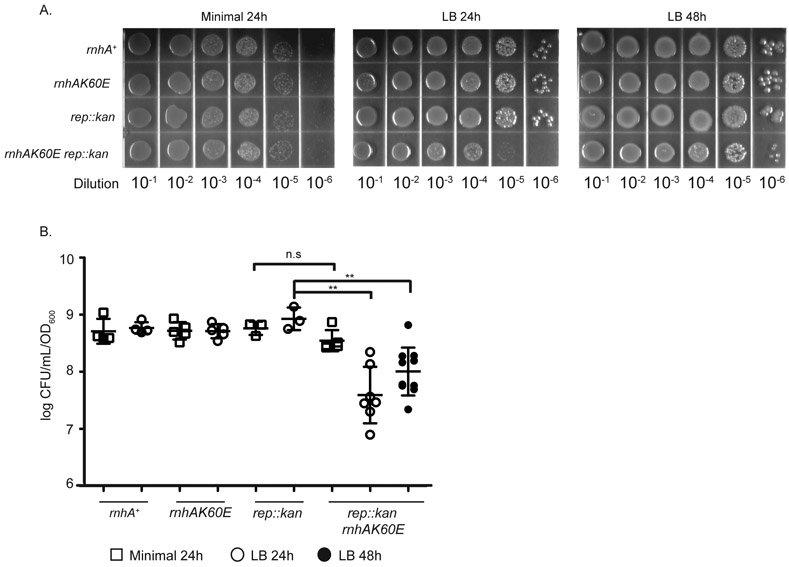
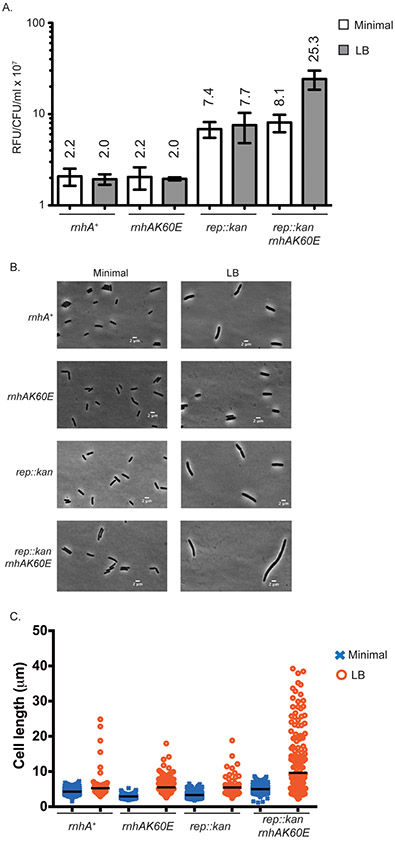
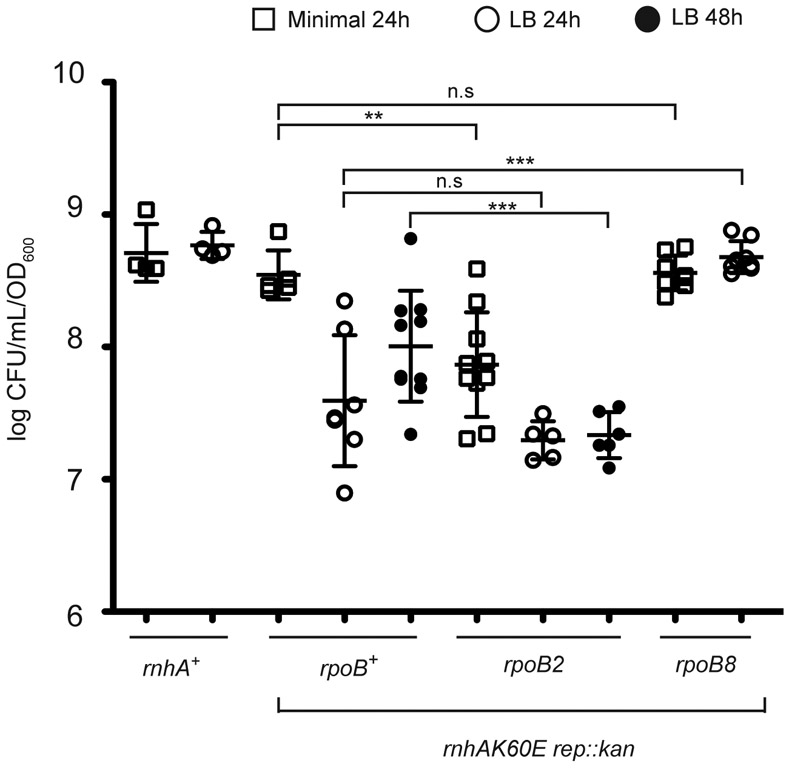
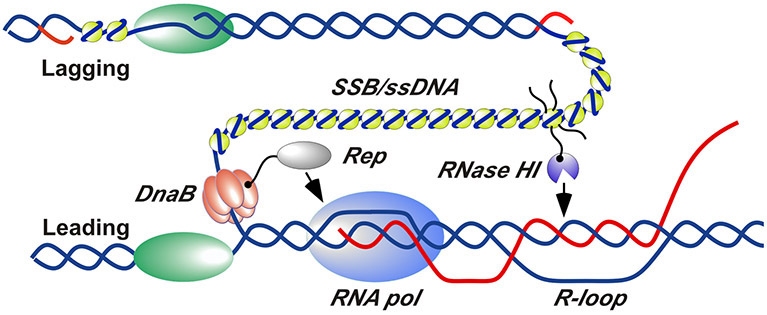
DNA replication complexes (replisomes) routinely encounter proteins and unusual nucleic acid structures that can impede their progress. Barriers can include transcription complexes and R-loops that form when RNA hybridizes with complementary DNA templates behind RNA polymerases. Cells encode several RNA polymerase and R-loop clearance mechanisms to limit replisome exposure to these potential obstructions. One such mechanism is hydrolysis of R-loops by ribonuclease HI (RNase HI). Here, we examine the cellular role of the interaction between Escherichia coli RNase HI and the single-stranded DNA-binding protein (SSB) in this process. Interaction with SSB localizes RNase HI foci to DNA replication sites. Mutation of rnhA to encode an RNase HI variant that cannot interact with SSB but that maintains enzymatic activity (rnhAK60E) eliminates RNase HI foci. The mutation also produces a media-dependent slow-growth phenotype and an activated DNA damage response in cells lacking Rep helicase, which is an enzyme that disrupts stalled transcription complexes. RNA polymerase variants that are thought to increase or decrease R-loop accumulation enhance or suppress, respectively, the growth phenotype of rnhAK60E rep::kan strains. These results identify a cellular role for the RNase HI/SSB interaction in helping to clear R-loops that block DNA replication.
Keywords: DNA replication; genome maintenance; transcription.
© 2020 John Wiley & Sons Ltd.
Figures
Similar articles
-
Interaction with Single-stranded DNA-binding Protein Stimulates Escherichia coli Ribonuclease HI Enzymatic Activity.J Biol Chem. 2015 Jun 5;290(23):14626-36. doi: 10.1074/jbc.M115.655134. Epub 2015 Apr 22. J Biol Chem. 2015. PMID: 25903123 Free PMC article.
-
Mutations reducing replication from R-loops suppress the defects of growth, chromosome segregation and DNA supercoiling in cells lacking topoisomerase I and RNase HI activity.DNA Repair (Amst). 2016 Apr;40:1-17. doi: 10.1016/j.dnarep.2016.02.001. Epub 2016 Feb 27. DNA Repair (Amst). 2016. PMID: 26947024
-
Escherichia coli RecG and RecA proteins in R-loop formation.EMBO J. 1995 May 15;14(10):2385-92. doi: 10.1002/j.1460-2075.1995.tb07233.x. EMBO J. 1995. PMID: 7774596 Free PMC article.
-
R-loop-dependent replication and genomic instability in bacteria.DNA Repair (Amst). 2019 Dec;84:102693. doi: 10.1016/j.dnarep.2019.102693. Epub 2019 Aug 21. DNA Repair (Amst). 2019. PMID: 31471263 Review.
-
Pif1 family DNA helicases: A helpmate to RNase H?DNA Repair (Amst). 2019 Dec;84:102633. doi: 10.1016/j.dnarep.2019.06.004. Epub 2019 Jun 17. DNA Repair (Amst). 2019. PMID: 31231063 Free PMC article. Review.
Cited by
-
RPA transforms RNase H1 to a bidirectional exoribonuclease for processive RNA-DNA hybrid cleavage.Nat Commun. 2024 Aug 29;15(1):7464. doi: 10.1038/s41467-024-51984-5. Nat Commun. 2024. PMID: 39198528 Free PMC article.
-
Escherichia coli DNA replication: the old model organism still holds many surprises.FEMS Microbiol Rev. 2024 Jun 20;48(4):fuae018. doi: 10.1093/femsre/fuae018. FEMS Microbiol Rev. 2024. PMID: 38982189 Free PMC article. Review.
-
Interaction with the carboxy-terminal tip of SSB is critical for RecG function in E. coli.Nucleic Acids Res. 2023 May 8;51(8):3735-3753. doi: 10.1093/nar/gkad162. Nucleic Acids Res. 2023. PMID: 36912097 Free PMC article.
-
The Impact of RNA-DNA Hybrids on Genome Integrity in Bacteria.Annu Rev Microbiol. 2022 Sep 8;76:461-480. doi: 10.1146/annurev-micro-102521-014450. Epub 2022 Jun 2. Annu Rev Microbiol. 2022. PMID: 35655343 Free PMC article. Review.
-
Analysis of the PcrA-RNA polymerase complex reveals a helicase interaction motif and a role for PcrA/UvrD helicase in the suppression of R-loops.Elife. 2021 Jul 19;10:e68829. doi: 10.7554/eLife.68829. Elife. 2021. PMID: 34279225 Free PMC article.
References
-
- Aguilera A, & Garcia-Muse T (2012). R loops: from transcription byproducts to threats to genome stability. Mol Cell, 46(2), 115–124. - PubMed
-
- Alberts BM (1987). Prokaryotic DNA replication mechanisms. Philosophical Transactions of the Royal Society of London. Series B, Biological Sciences, Vol. 317, pp. 395–420. - PubMed
Publication types
MeSH terms
Substances
Grants and funding
LinkOut - more resources
Full Text Sources
