. 2021 Feb;33(2):180-194.
doi: 10.1162/jocn_a_01580. Epub 2020 May 19.

Combining Multiple Functional Connectivity Methods to Improve Causal Inferences

Affiliations

Combining Multiple Functional Connectivity Methods to Improve Causal Inferences

Ruben Sanchez-Romero et al. J Cogn Neurosci. 2021 Feb.

Abstract

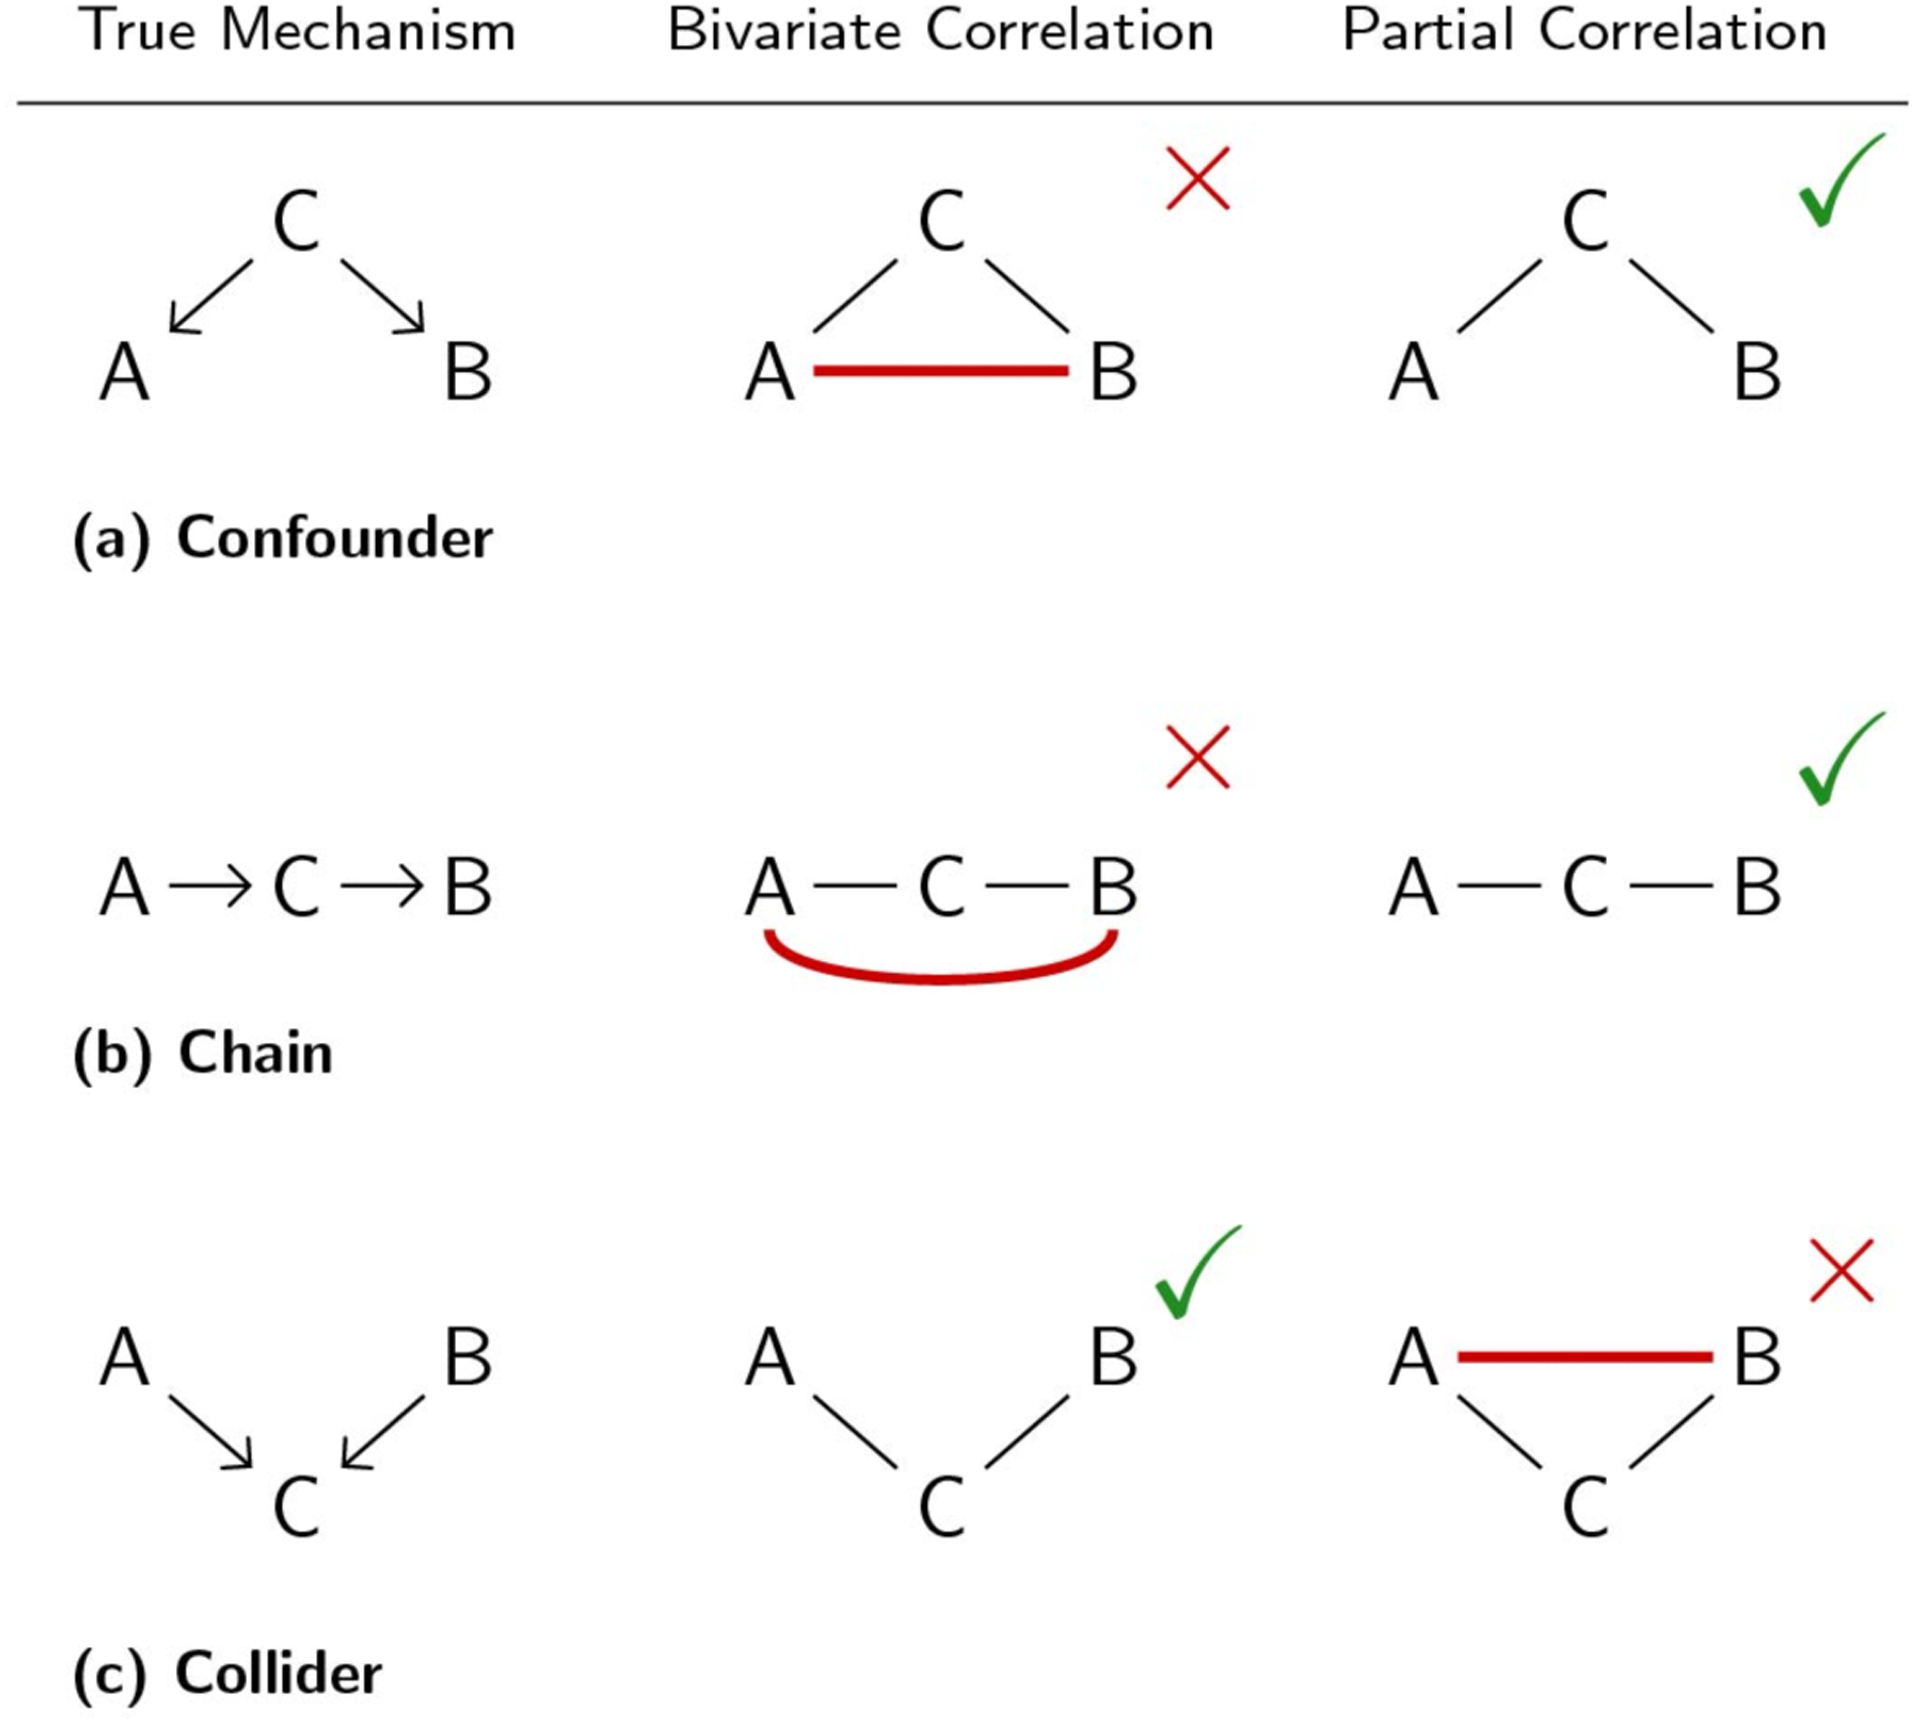
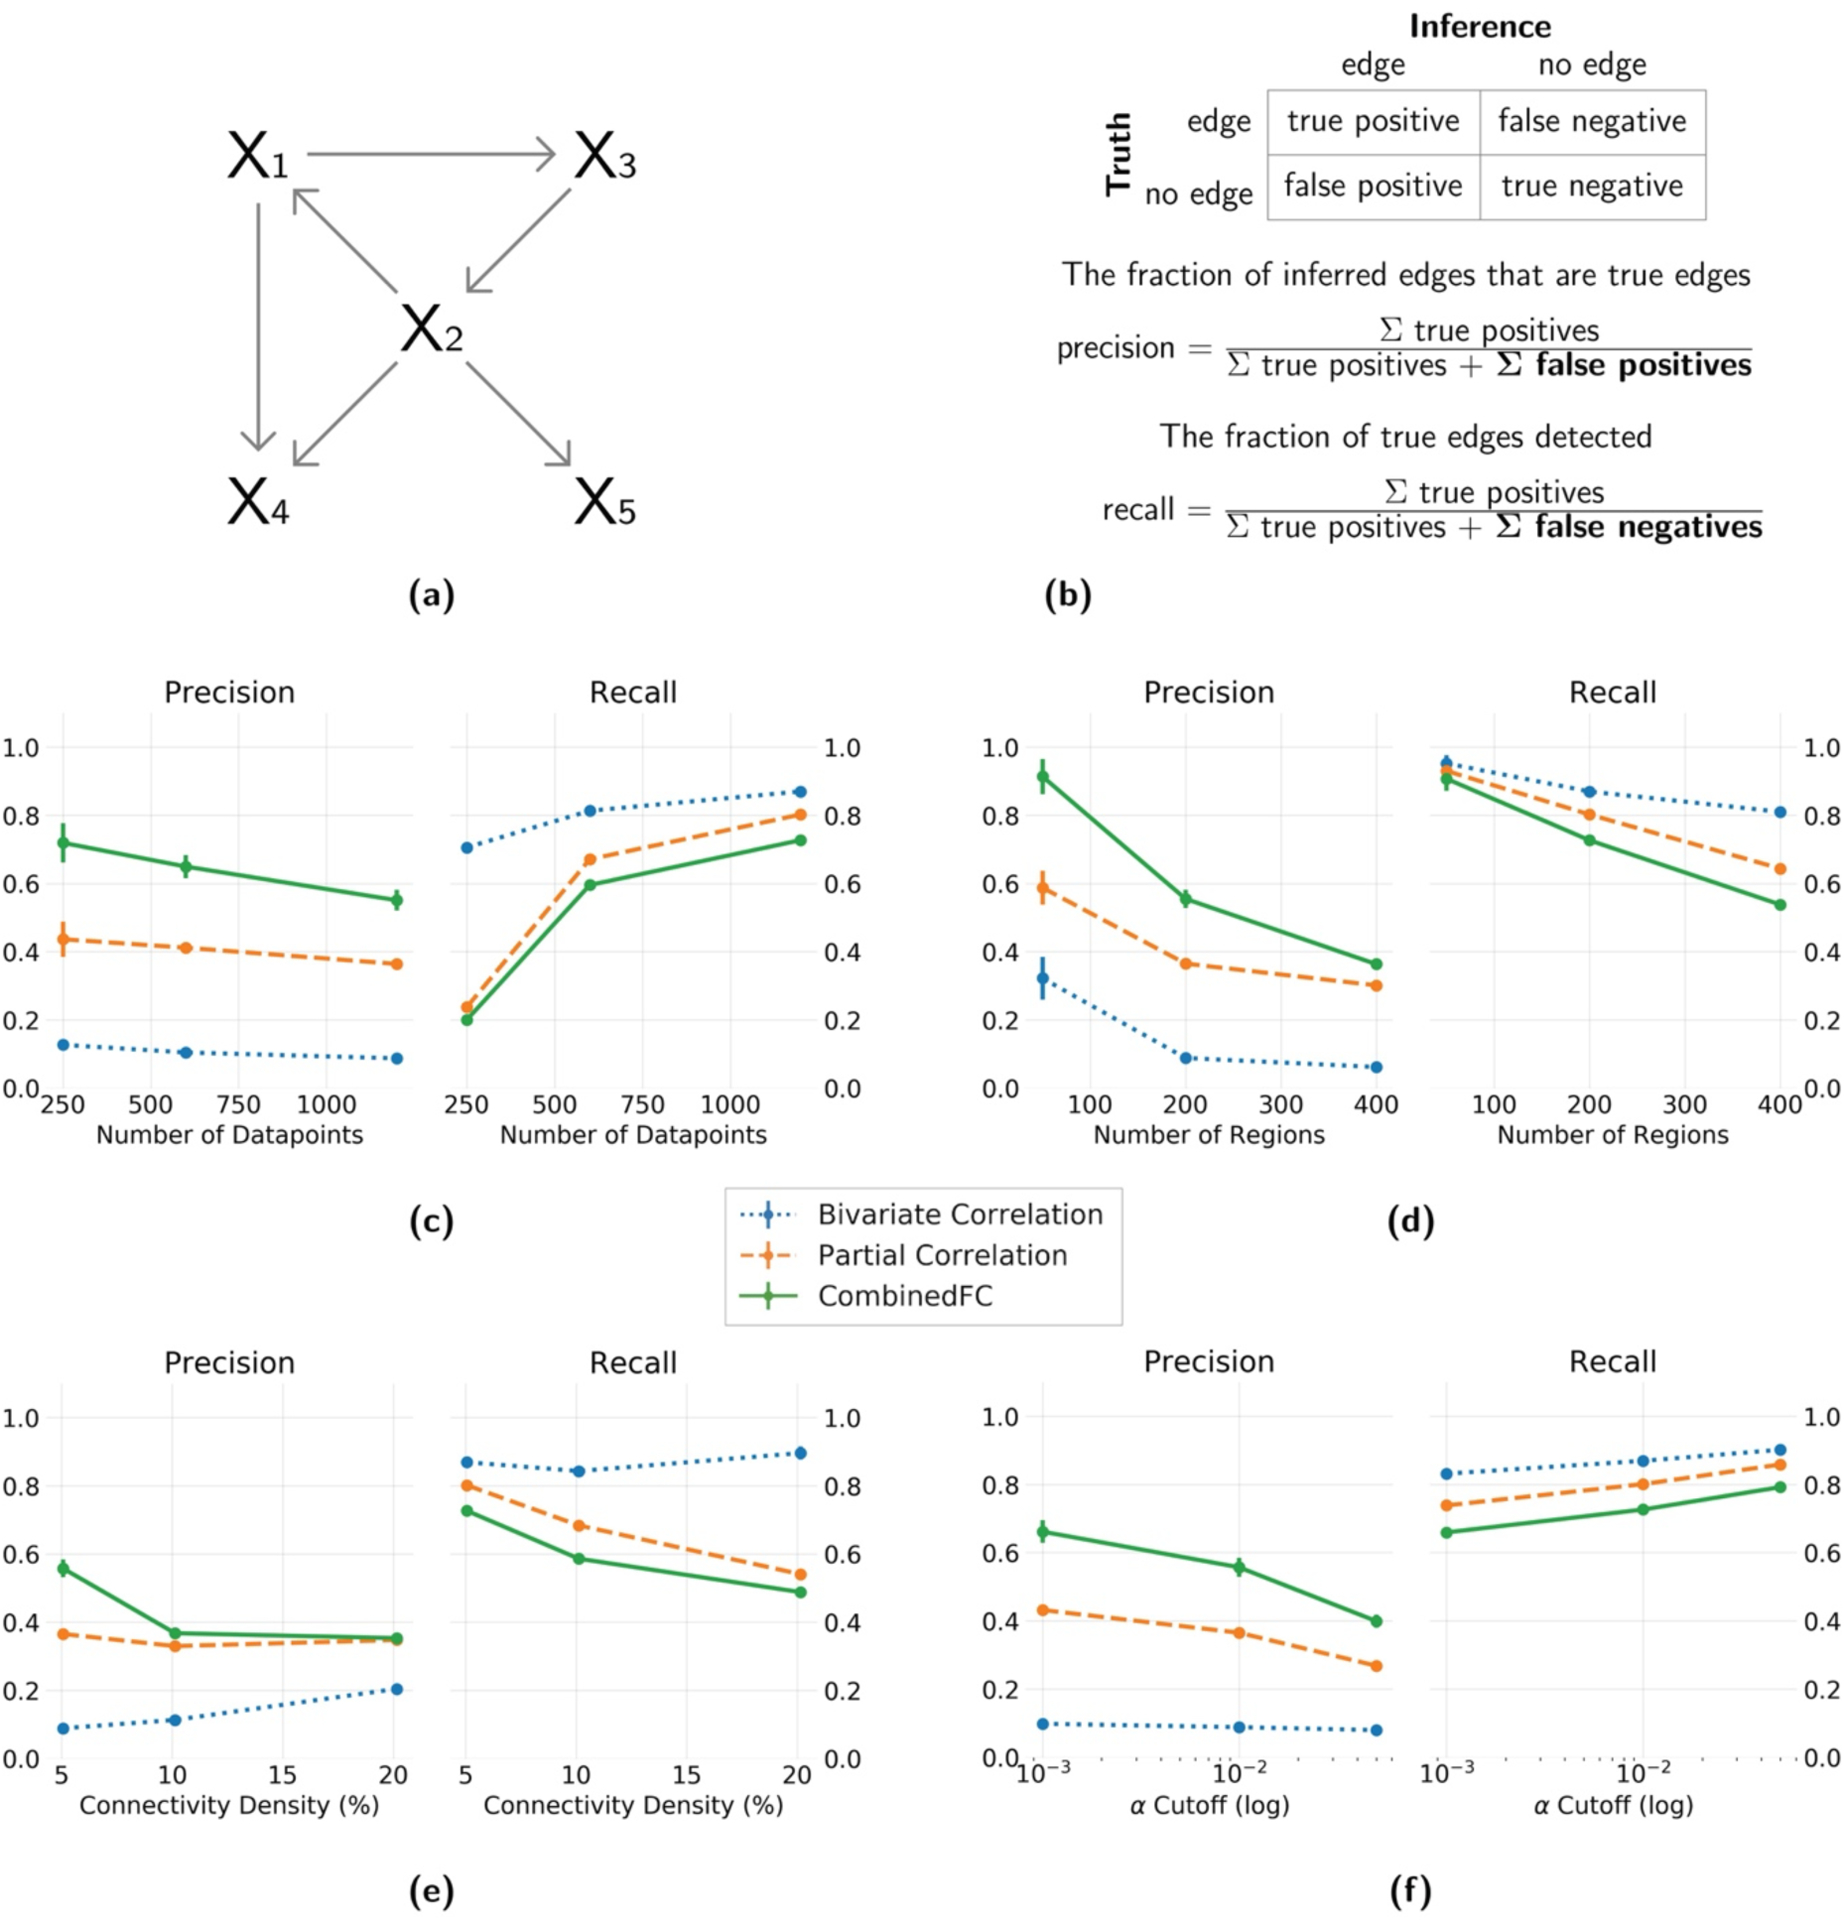
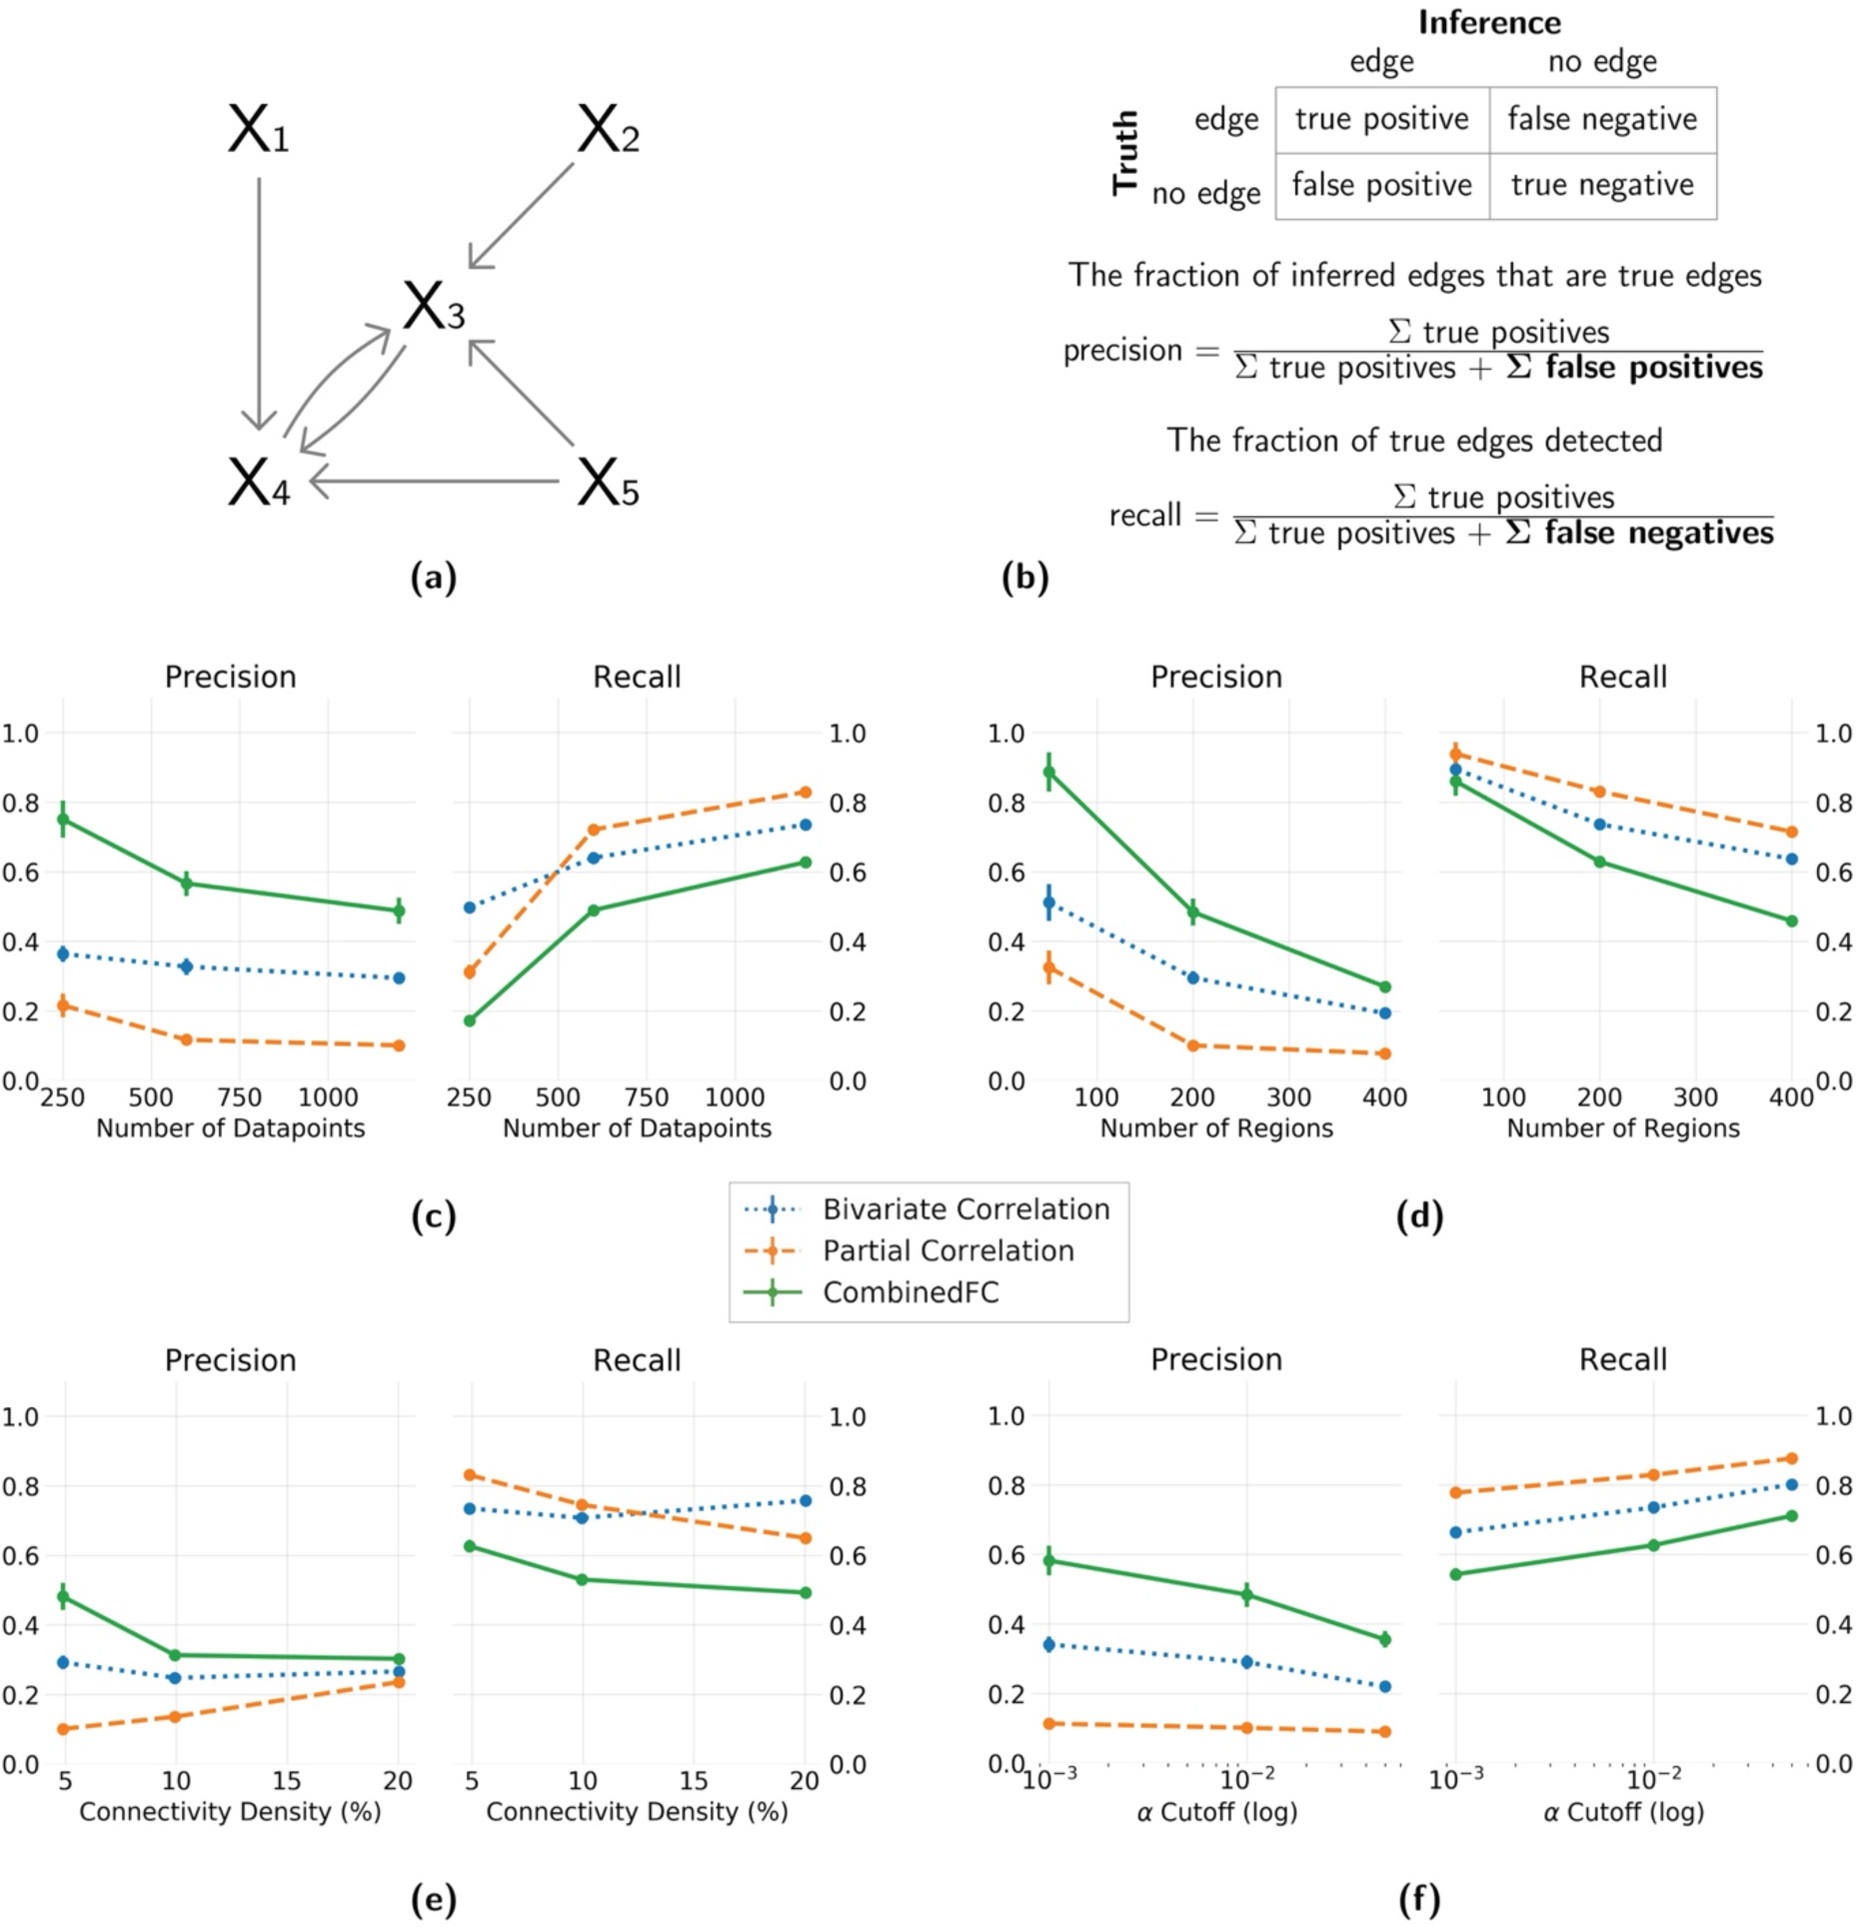
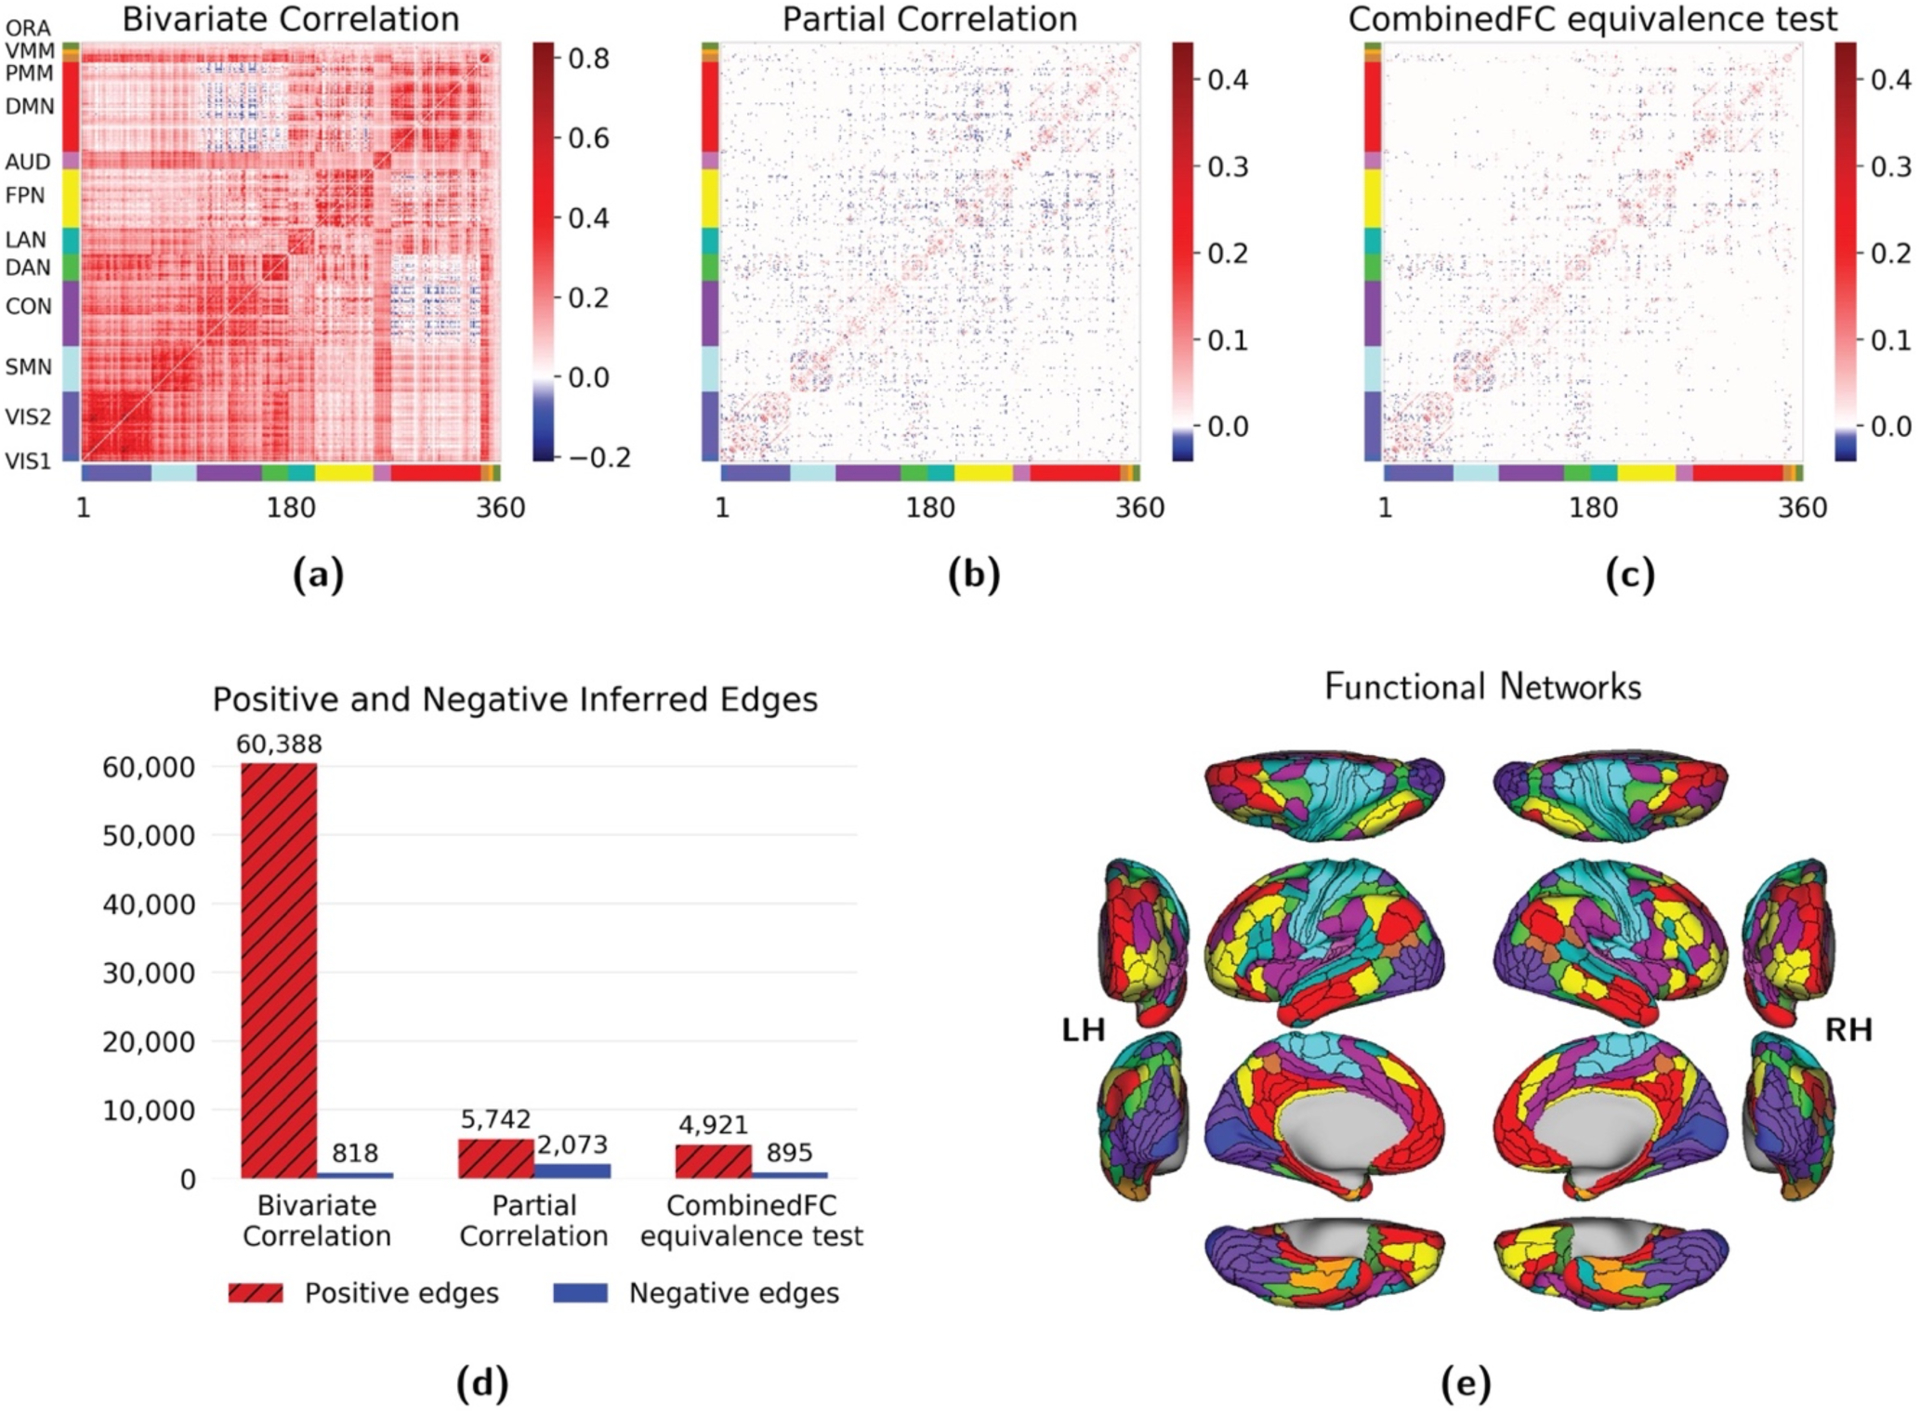
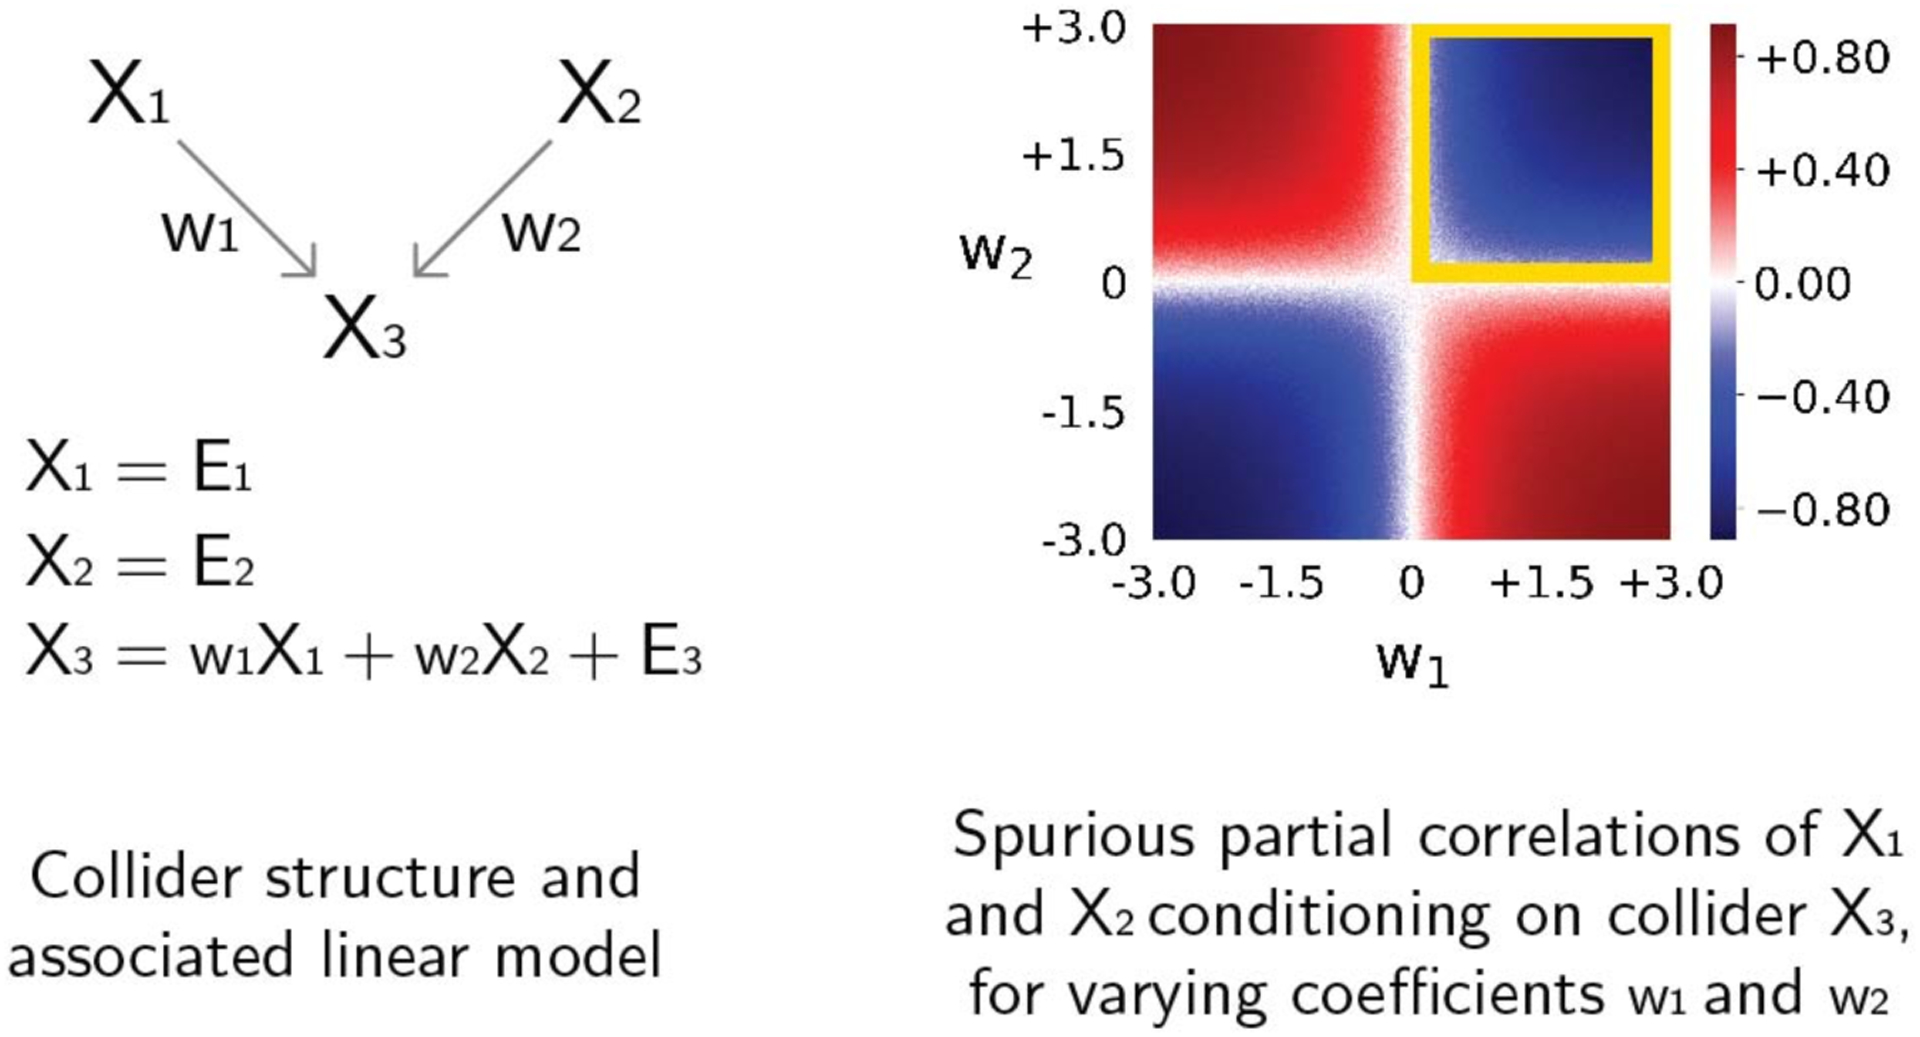
Cognition and behavior emerge from brain network interactions, suggesting that causal interactions should be central to the study of brain function. Yet, approaches that characterize relationships among neural time series-functional connectivity (FC) methods-are dominated by methods that assess bivariate statistical associations rather than causal interactions. Such bivariate approaches result in substantial false positives because they do not account for confounders (common causes) among neural populations. A major reason for the dominance of methods such as bivariate Pearson correlation (with functional MRI) and coherence (with electrophysiological methods) may be their simplicity. Thus, we sought to identify an FC method that was both simple and improved causal inferences relative to the most popular methods. We started with partial correlation, showing with neural network simulations that this substantially improves causal inferences relative to bivariate correlation. However, the presence of colliders (common effects) in a network resulted in false positives with partial correlation, although this was not a problem for bivariate correlations. This led us to propose a new combined FC method (combinedFC) that incorporates simple bivariate and partial correlation FC measures to make more valid causal inferences than either alone. We release a toolbox for implementing this new combinedFC method to facilitate improvement of FC-based causal inferences. CombinedFC is a general method for FC and can be applied equally to resting-state and task-based paradigms.


Figures

Figure 1.
Figure 1.. The pattern of spurious causal inferences for bivariate and partial correlations.
Switching from correlation to partial correlation improves causal inference (but is not perfect). We propose integrating inferences from both correlation and partial correlation, which we predict will produce further improvements to causal inferences. Red lines indicate spurious causal inferences. Note that, in the case of a collider, when A → C and B → C are positive then the spurious A – B connection induced by partial correlation will be negative (this becomes relevant in the Results. See also Figure 6).
Figure 2.
Figure 2.. Precision and recall for simulated networks with a larger number of confounders and chains than colliders.
(a) An example of a 5 node network generated with an Erdos-Renyi process, with more confounders and chains than colliders. (b) Formulas for precision and recall based on the sum of true positive, false positive and false negative inferred edges, relative to a true network. Results show average and standard deviation across 100 instantiations. Four different parameters are varied independently: (c) number of datapoints = {250, 600, 1200}, (d) number of regions = {50, 200, 400}, (e) connectivity density = {5%, 10%, 20%} and (f) α cutoff for the significance test = {0.001, 0.01, 0.05}. In panel f the values are plotted in logarithmic scale for better visualization. When one parameter was varied the other three were fixed at the value in bold.
Figure 3.
Figure 3.. Precision and recall for simulated networks with a larger number of colliders than confounders and chains.
(a) An example of a 5 node network generated with a power law process, with more colliders than confounders and chains. (b) Formulas for precision and recall based on the sum of true positive, false positive and false negative inferred edges, relative to a true network. Results show average and standard deviation across 100 instantiations. Four different parameters are varied independently: (c) number of datapoints = {250, 600, 1200}, (d) number of regions = {50, 200, 400}, (e) connectivity density = {5%, 10%, 20%} and (f) α cutoff for the significance test = {0.001, 0.01, 0.05}. In panel f the values are plotted in logarithmic scale for better visualization. When one parameter was varied the other three were fixed at the value in bold.
Figure 4.
Figure 4.. Empirical data analyss comparing strategies to identify false connections due to colliders.
Number of inferred group edges for partial correlation and combinedFC implemented with non-significant correlations and with equivalence tests for the collider check. Only the equivalence test strategy identifies more false connections with a larger sample size, consistent with more data providing greater evidence of no (or a very small) bivariate correlation in these cases. See text for results with bivariate correlation.
Figure 5.
Figure 5.. Comparison of bivariate and partial correlation with combinedFC using empirical resting state fMRI data.
Results for (a) bivariate correlation, (b) partial correlation and (c) combinedFC with equivalence tests. (d) Number of positive and negative inferred edges by each method. Partial correlation removed a large number of positive edges and increased the number of negative edges relative to correlation. This increase may come from spurious edges from conditioning on colliders with same sign associations. Consistent with the removal of spurious partial connections caused by colliders, combinedFC removed 57% of the negative partial correlations and ended up with a number of negative edges close to the one of the bivariate correlation matrix, for which no spurious edges from colliders are present. (e) The 360 regions of interest are ordered according to 12 functional networks defined in Ji et al., (2019) using bivariate correlation: VIS1: primary visual; VIS2: secondary visual; SMN: somatomotor; CON: cingulo-opercular; DAN: dorsal attention; LAN: language; FPN: frontoparietal; AUD: auditory; DMN: default mode; PMM: posterior multimodal; VMM: ventral multimodal; ORA: orbito-affective.
Figure 6.
Figure 6.. Positive or negative spurious partial correlations when conditioning on a collider.
The left panel shows a collider causal structure from regions X1 and X2 to X3 and an associated linear model with connectivity coefficients w1 and w2, and Gaussian noise terms E. We simulated data from this linear model for values of w1 and w2 from −3 to +3, and report in the right panel the resulting spurious partial correlations of X1 and X2 conditioning on X3 for combinations of values of w1 (x-axis) and w2 (y-axis). When both connectivity coefficients have positive values the resulting spurious partial correlation will be negative (blue region indicated by a yellow square). Negative spurious partial correlations are also observed if both connectivity coefficients are negative. In contrast, when the connectivity coefficients have opposite sign, the resulting spurious partial correlation will be positive (red regions).

References

    1. Barbas H (2015). General Cortical and Special Prefrontal Connections: Principles from Structure to Function. Annual Review of Neuroscience, 38(1), 269–289. - PubMed
    1. Bishop CM (2006). Pattern recognition and machine learning. Springer.
    1. Bühlmann P, & Van De Geer S (2011). Statistics for high-dimensional data: Methods, theory and applications. Springer Science & Business Media.
    1. Chickering DM (2002). Optimal structure identification with greedy search. Journal of Machine Learning Research, 3(Nov), 507–554.
    1. Ciric R, Wolf DH, Power JD, Roalf DR, Baum GL, Ruparel K, Shinohara RT, Elliott MA, Eickhoff SB, Davatzikos C, Gur RC, Gur RE, Bassett DS, & Satterthwaite TD (2017). Benchmarking of participant-level confound regression strategies for the control of motion artifact in studies of functional connectivity. NeuroImage, 154, 174–187. - PMC - PubMed

Publication types