. 2020 Jun 19;48(11):5839-5848.
doi: 10.1093/nar/gkaa399.

Integrating NMR and simulations reveals motions in the UUCG tetraloop

Affiliations

Integrating NMR and simulations reveals motions in the UUCG tetraloop

Sandro Bottaro et al. Nucleic Acids Res. .

Abstract

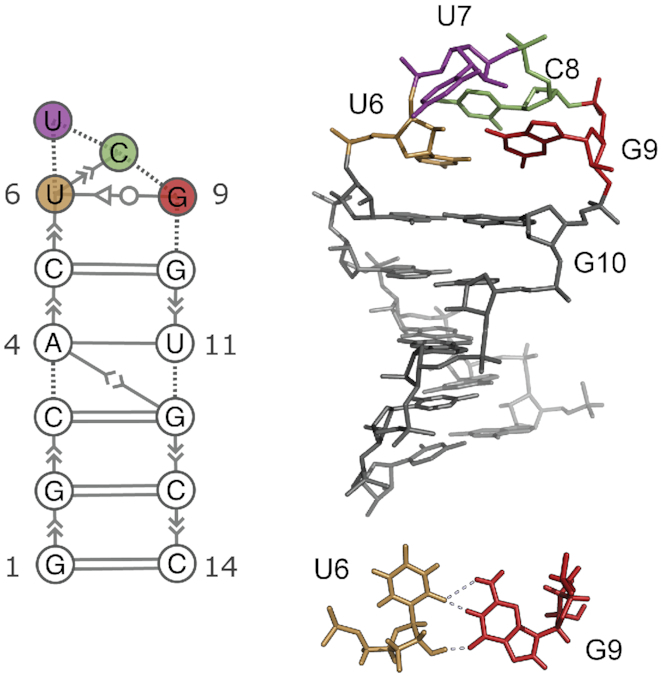
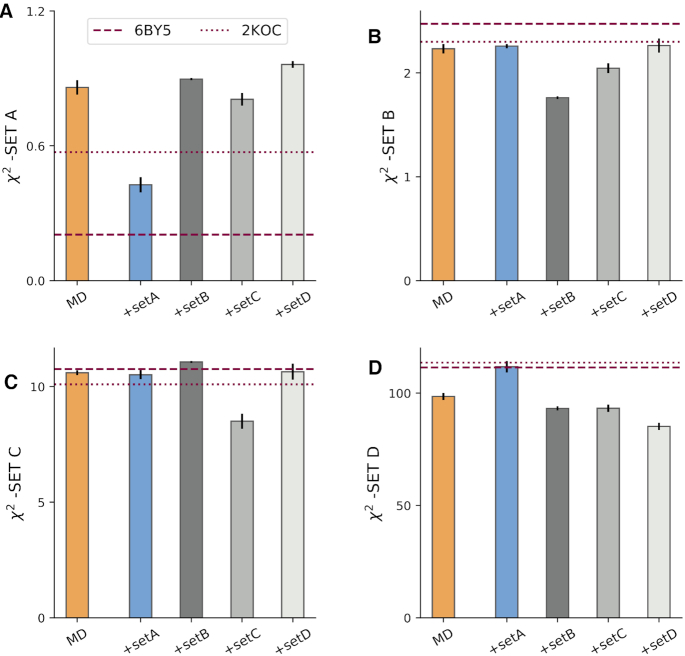
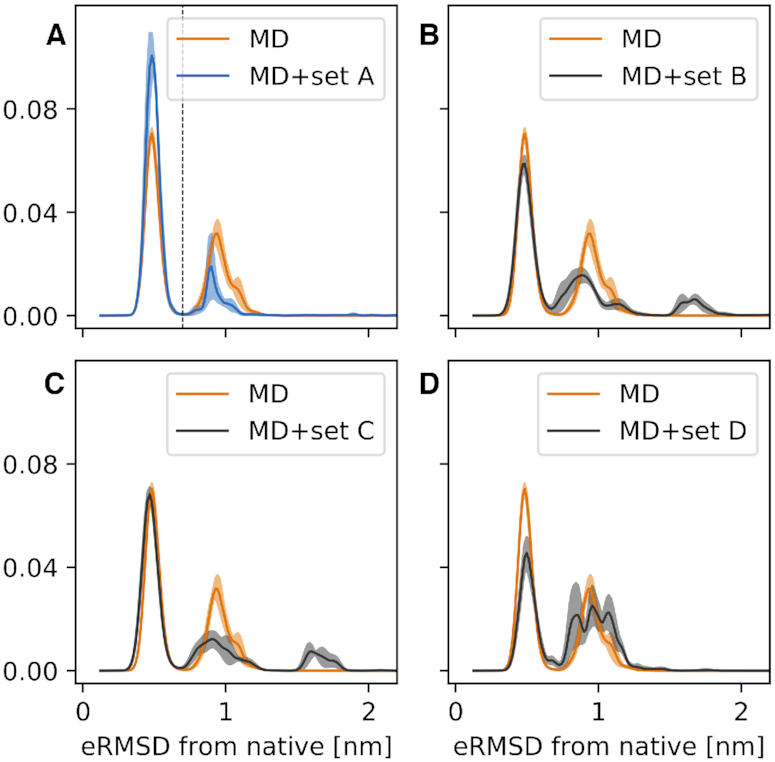
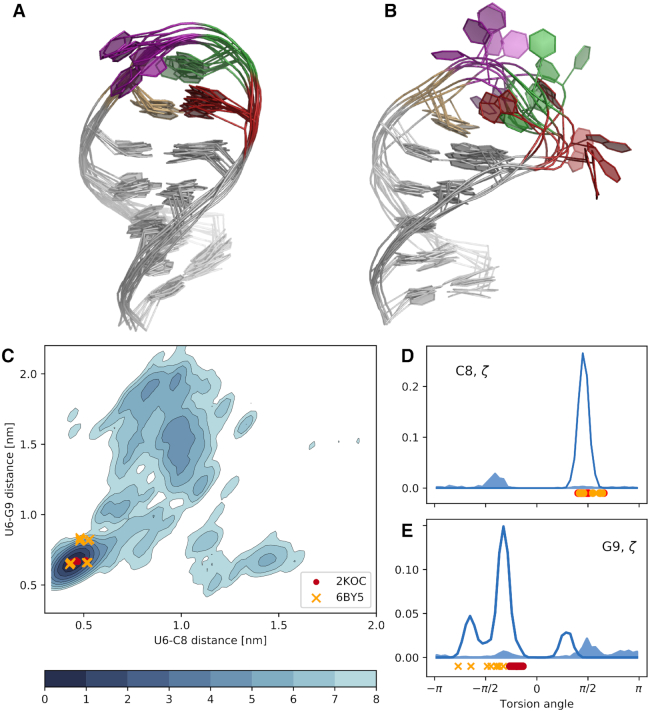
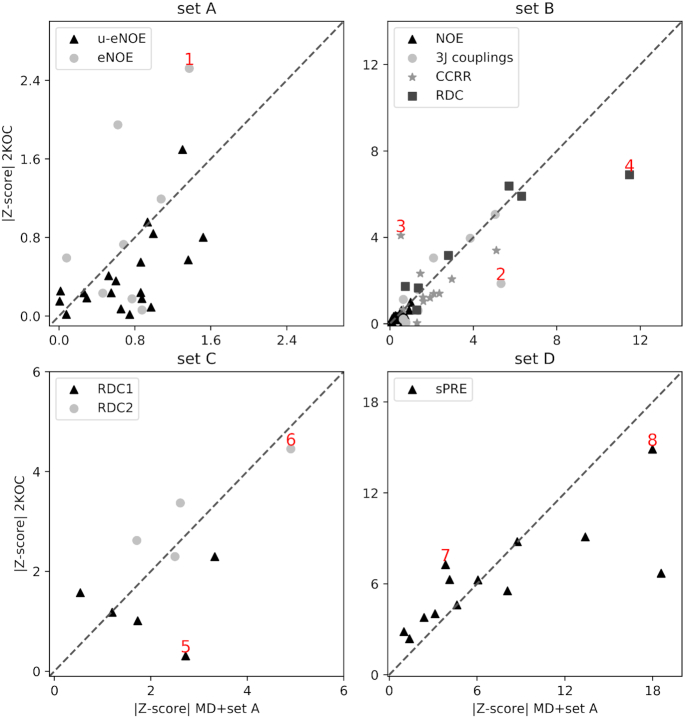
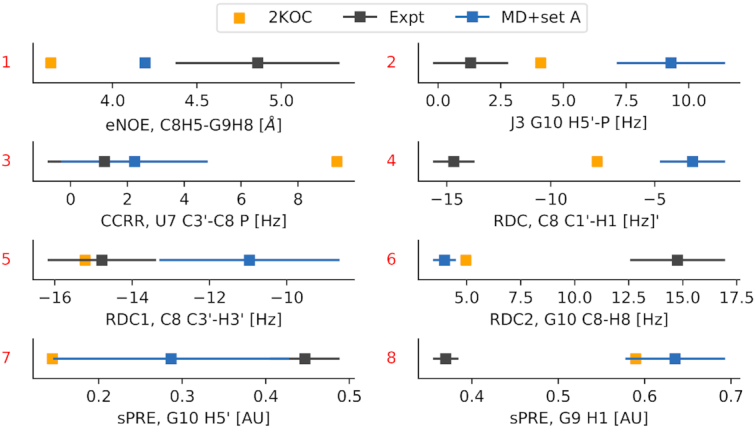
We provide an atomic-level description of the structure and dynamics of the UUCG RNA stem-loop by combining molecular dynamics simulations with experimental data. The integration of simulations with exact nuclear Overhauser enhancements data allowed us to characterize two distinct states of this molecule. The most stable conformation corresponds to the consensus three-dimensional structure. The second state is characterized by the absence of the peculiar non-Watson-Crick interactions in the loop region. By using machine learning techniques we identify a set of experimental measurements that are most sensitive to the presence of non-native states. We find that although our MD ensemble, as well as the consensus UUCG tetraloop structures, are in good agreement with experiments, there are remaining discrepancies. Together, our results show that (i) the MD simulation overstabilize a non-native loop conformation, (ii) eNOE data support its presence with a population of ≈10% and (iii) the structural interpretation of experimental data for dynamic RNAs is highly complex, even for a simple model system such as the UUCG tetraloop.


Figures

Figure 1.
Figure 1.
Consensus secondary structure (left) and three dimensional structure (right) of the UUCG tetraloop (7). The stem is formed by 5 consecutive Watson–Crick base-pairs capped by the loop U6–U7–C8–G9. One of the most distinctive feature of this structure is the trans-sugar–Watson interaction between U6 and G9 (bottom). Extended secondary structure annotation follows the Leontis–Westhof nomenclature (9).
Figure 2.
Figure 2.
Comparison between experiment and simulations. (A) χ2 between experimental dataset A against the MD ensemble (MD) and against the refined ensembles (MD+set A, MD+set B, MD+set C, MD+set D). As a reference, values calculated from all NMR models from PDB structures 2KOC and 6BY5 are shown as dashed lines. The agreement between the same ensembles and datasets B, C, D, are shown in panels (B), (C) and (D), respectively. Error bars show the standard error estimated using four blocks.
Figure 3.
Figure 3.
Histograms of the eRMSD from native. The original MD simulation (orange) is compared with the four refined ensembles: MD+set A in panel (A), MD+set B in panel (B), MD+set C in panel (C) and MD+set D in (D). Shades show the standard error estimated using four blocks. The vertical dashed line in panel (A) shows the separation between state A (eRMSD < 0.7) and state B (eRMSD ≥ 0.7).
Figure 4.
Figure 4.
(A) Representative (random) conformations sampled from state A. (B) Representative (random) conformations sampled from state B. The color code is identical to Figure 1: U6 in ochre, U7 in purple, C8 in green and G9 in red. (C) Free energy surface projected onto the the U6-C8/U6-G9 distance between ring centres. The units of the colorbar are in kBT. (D) Histogram of ζ dihedral angle in C8. The open filled area indicates conformations belonging to state A, and the filled area indicates conformations belonging to state B. (E) Histogram of ζ dihedral angle in G9.
Figure 5.
Figure 5.
Comparison between 2KOC and MD+set A ensemble on experimental data that are most sensitive to the presence of state B. Scatter plots show the Z-score calculated on the MD+set A ensemble (x-axis) versus the same quantity calculated on the PDB ensemble 2KOC (y-axis). The four panels show data belonging to the four datasets: set A in panel (A), set B in panel (B), set C in panel (C) and set D in panel (D). Points discussed in the main text and shown in Figure 6 are labeled in red.
Figure 6.
Figure 6.
Comparison between calculated and experimental data for selected measurements discussed in the text and labelled as in Figure 5.

References

    1. Wolters J. The nature of preferred hairpin structures in 16S-like rRNA variable regions. Nucleic Acids Res. 1992; 20:1843–1850. - PMC - PubMed
    1. Bottaro S., Lindorff-Larsen K.. Mapping the universe of RNA tetraloop folds. Biophys. J. 2017; 113:257–267. - PMC - PubMed
    1. Cheong C., Varani G., Tinoco I. Jr. Solution structure of an unusually stable RNA hairpin, 5GGAC (UUCG) GUCC. Nature. 1990; 346:680. - PubMed
    1. Woese C., Winker S., Gutell R.. Architecture of ribosomal RNA: constraints on the sequence of ‘tetra-loops’. Proc. Natl. Acad. Sci. U.S.A. 1990; 87:8467–8471. - PMC - PubMed
    1. Ferner J., Villa A., Duchardt E., Widjajakusuma E., Wöhnert J., Stock G., Schwalbe H.. NMR and MD studies of the temperature-dependent dynamics of RNA YNMG-tetraloops. Nucleic Acids Res. 2008; 36:1928–1940. - PMC - PubMed

Publication types