. 2020 Jul 9;48(12):6874-6888.
doi: 10.1093/nar/gkaa386.

NF90 modulates processing of a subset of human pri-miRNAs

Affiliations

NF90 modulates processing of a subset of human pri-miRNAs

Giuseppa Grasso et al. Nucleic Acids Res. .

Abstract

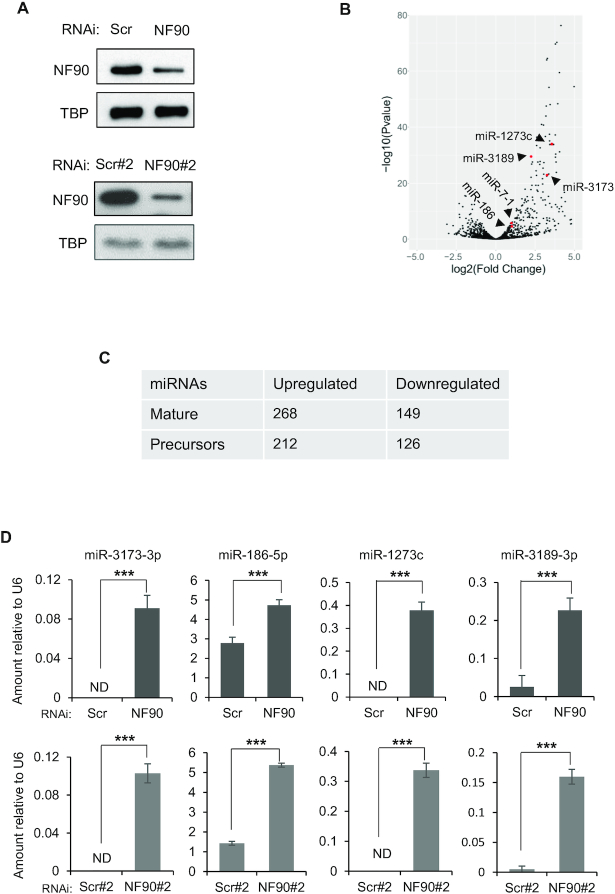
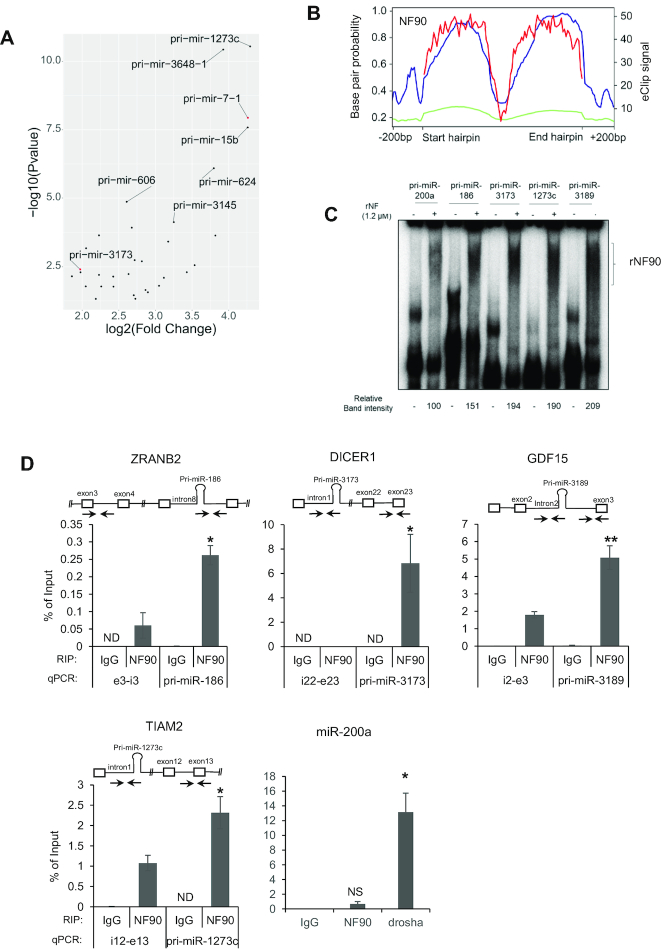
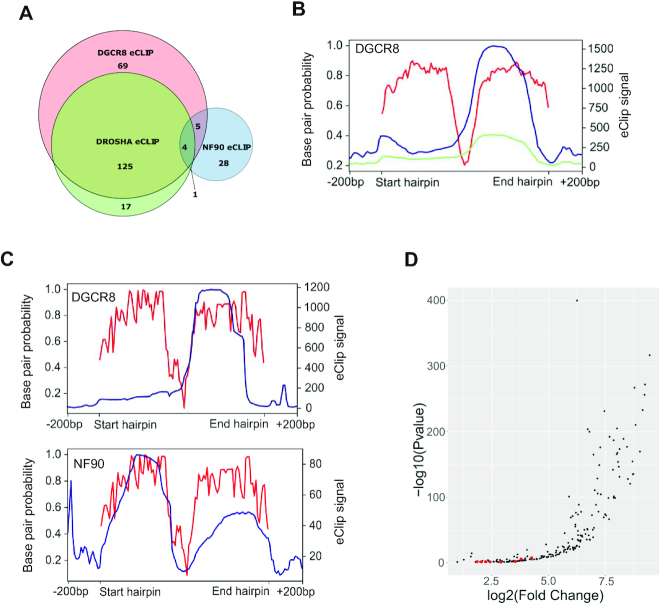
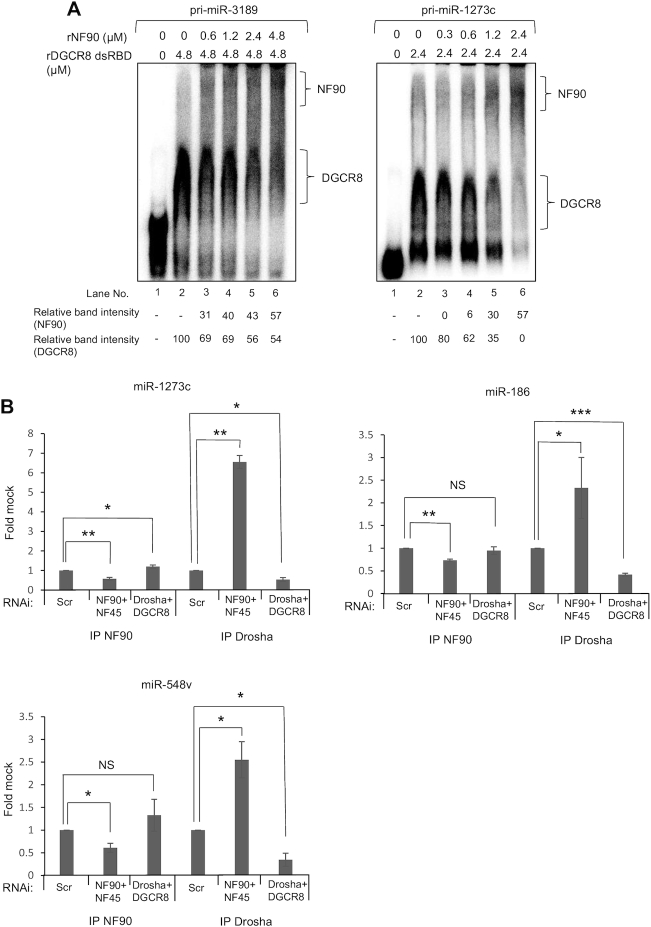
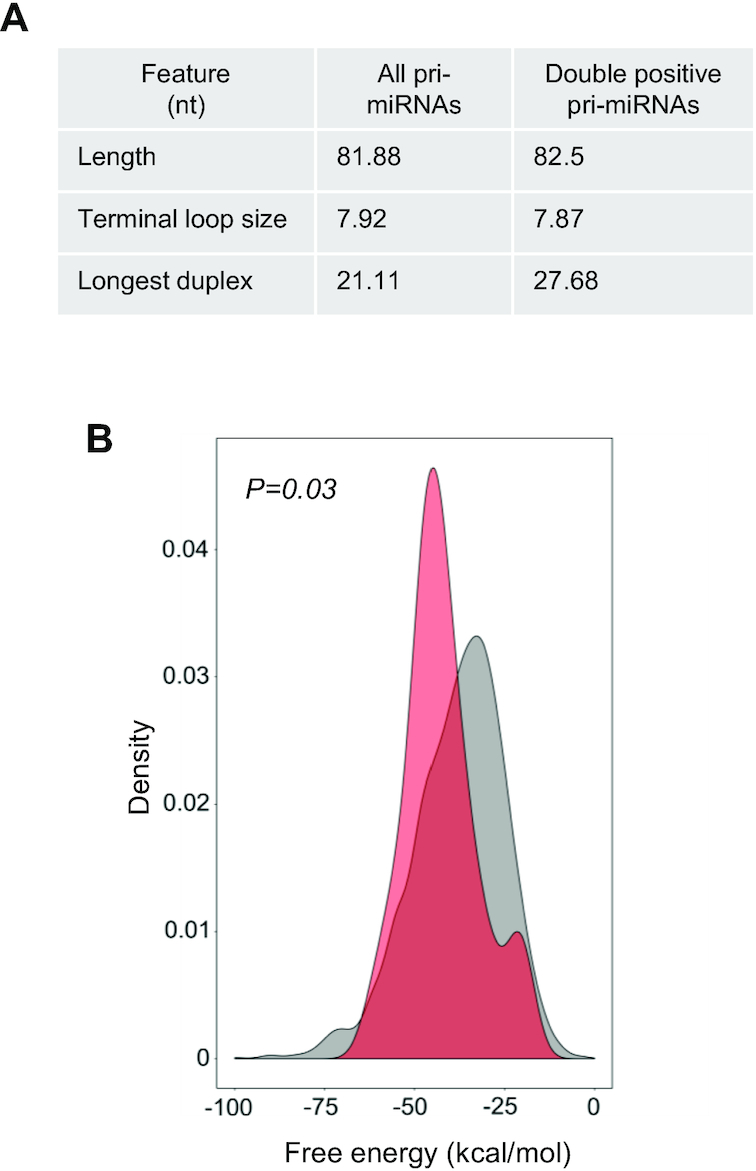
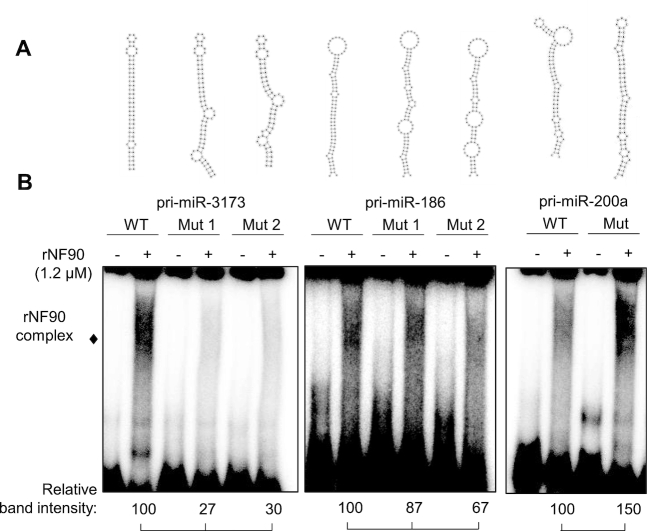
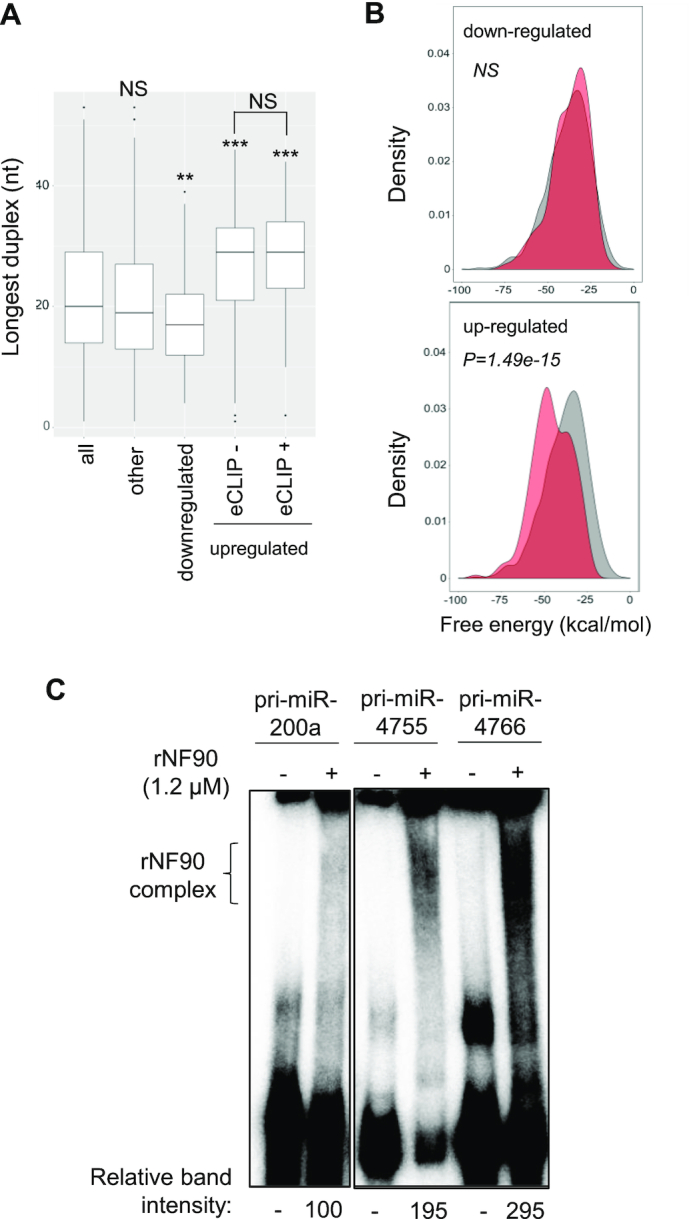
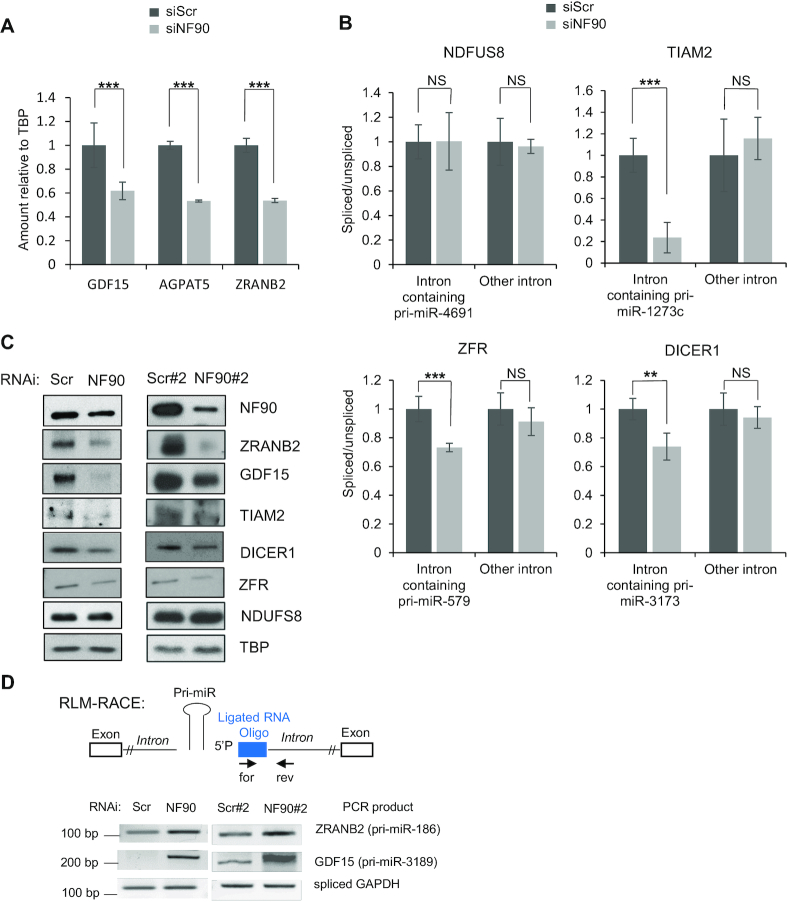
MicroRNAs (miRNAs) are predicted to regulate the expression of >60% of mammalian genes and play fundamental roles in most biological processes. Deregulation of miRNA expression is a hallmark of most cancers and further investigation of mechanisms controlling miRNA biogenesis is needed. The double stranded RNA-binding protein, NF90 has been shown to act as a competitor of Microprocessor for a limited number of primary miRNAs (pri-miRNAs). Here, we show that NF90 has a more widespread effect on pri-miRNA biogenesis than previously thought. Genome-wide approaches revealed that NF90 is associated with the stem region of 38 pri-miRNAs, in a manner that is largely exclusive of Microprocessor. Following loss of NF90, 22 NF90-bound pri-miRNAs showed increased abundance of mature miRNA products. NF90-targeted pri-miRNAs are highly stable, having a lower free energy and fewer mismatches compared to all pri-miRNAs. Mutations leading to less stable structures reduced NF90 binding while increasing pri-miRNA stability led to acquisition of NF90 association, as determined by RNA electrophoretic mobility shift assay (EMSA). NF90-bound and downregulated pri-miRNAs are embedded in introns of host genes and expression of several host genes is concomitantly reduced. These data suggest that NF90 controls the processing of a subset of highly stable, intronic miRNAs.


Figures

Figure 1.
Figure 1.
NF90 modulates the expression level of a subset of miRNAs in HepG2 cells. (A) Extracts of HepG2 cells transfected with non-targeting control siRNAs (Scr, Scr#2) or siRNA targeting NF90 (NF90, NF90#2) as indicated were analyzed by immunoblot using the antibodies indicated. (B) Total RNA extracted from cells transfected with siScr or siNF90 were analyzed by small RNA-seq. Results are shown as log2 fold change versus –log10P-value. (C) Table summarizing the number of mature miRNAs and pri-miRNAs modulated in HepG2 cell line upon loss of NF90, according to small-RNA seq. (D) Total RNA extracted from cells described in (A) were analyzed by Taqman RT-qPCR as indicated. Results were normalized by those obtained for U6 abundance in the same samples. ND indicates ‘not detected’. Data represent mean ± SEM obtained from three independent experiments (***P < 0.001, independent Student's t test).
Figure 2.
Figure 2.
NF90 is associated with a subset of pri-miRNAs in HepG2 cells. (A) Dot plot representation of eCLIP data showing the 38 pri-miRNAs significantly associated with NF90 in HepG2 cells. Graph shows log2 fold change versus –log10P-value. (B) Distribution of NF90 eCLIP reads along the region ±200 bp of NF90-associated pri-miRNAs (blue) or all miRNAs (green) and base pair probability of NF90-associated hairpins (red). (C) RNA EMSA performed using recombinant NF90 was probed with radiolabelled pri-miRNAs as indicated. rNF90-pri-miRNA complexes are indicated on the figure. (D) RIP analysis of HepG2 cells transfected with NF90 targeting siRNA or a non-targeting control (Scr), as indicated using anti-NF90, anti-Drosha or a control IgG antibody. Immunoprecipitates were analyzed by RT-qPCR amplifying a region proximal or distal to the miRNAs. ND indicates ‘Not Detected’. NS indicates ‘Not Significant’. Data represent mean ± SEM obtained from 3 independent experiments (*P < 0.05, **P < 0.01, independent Student's t test).
Figure 3.
Figure 3.
NF90-associated pri-miRNAs are poorly associated with Microprocessor. (A) Venn diagram showing the number of pri-miRNAs associated with DGCR8, Drosha or NF90 detected by eCLIP, as indicated. (B) Distribution of DGCR8 eCLIP reads along the region ±200 bp of DGCR8-associated pri-miRNAs (blue) or all miRNAs (green) and base pair probability of DGCR8-associated hairpins (red). (C) Distribution of eCLIP reads along the region ±200 bp of pri-miRNAs associated with both DGCR8 and NF90 (blue) and base pair probability of the hairpins (red). Left panel shows DGCR8 eCLIP reads, right panel shows NF90 eCLIP reads in blue. (D) Dot plot representation of eCLIP data showing 203 pri-miRNAs significantly associated with DGCR8 in HepG2 cells. Graph shows log2 fold change versus −log10P-value. Red dots indicate pri-miRNAs that are also significantly associated with NF90.
Figure 4.
Figure 4.
NF90 competes with the Microprocessor for the binding to pri-miRNAs. (A) RNA EMSA carried out using rDGCR8 dsRBD either alone or together with increasing amounts of rNF90 and probed with radio-labelled pri-miR-3189 or pri-miR-1273c. (B) Immunoprecipitates obtained using anti-NF90, anti-Drosha or a control antibody were analyzed by RT-qPCR amplifying a region proximal to the pri-miRNAs. The fold change relative to the control antibody sample was calculated and results are presented relative to the control sample (siScr), which was attributed a value of 1. Data represent mean ± SEM obtained from three independent experiments (*P < 0.05, **P < 0.01, ***P < 0.001, NS ‘Not Significant’. independent Student's t test).
Figure 5.
Figure 5.
NF90 associates with a subset of highly stable pri-miRNAs. (A) Structural characteristics of all human pri-miRNAs and NF90 double positive pri-miRNAs. (B) Graph showing the free energy of all pri-miRNAs (grey) and NF90 double positive pri-miRNAs (red).
Figure 6.
Figure 6.
Modification of pri-miRNA structure alters NF90 binding. (A) Representations of wt or mutant pri-miRNAs sequences, as indicated. (B) RNA EMSA performed using recombinant NF90 and probed with radiolabelled pri-miRNAs as indicated. rNF90-pri-miRNA complexes are indicated on the figure. Relative band intensities (normalized to signal for wt) are shown below.
Figure 7.
Figure 7.
Pri-miRNAs whose mature products are upregulated following loss of NF90 share a similar structure. (A) Box plot representation of the longest duplex length of pri-miRNAs sorted into the indicated categories (*P < 0.05, ***P < 0.001, NS, not significant, Wilcoxon test). (B) Graphical representation of the free energy of pri-miRNAs whose mature products are downregulated or upregulated as indicated following loss of NF90 (red) compared to all pri-miRNAs (gray). (C) RNA EMSA performed using recombinant NF90 and probed with radiolabelled pri-miRNAs as indicated. rNF90-pri-miRNA complexes are indicated on the figure. Relative band intensities (normalized to pri-miR200a) are shown below.
Figure 8.
Figure 8.
NF90 impacts expression of genes hosting pri-miRNAs. (A) Extracts of HepG2 cells transfected with siRNA targeting NF90 or a non-targeting control (Scr) as indicated were analyzed by RNA-seq and DESeq2. Data represent mean ± SEM obtained from three independent samples (***P < 0.001, independent Student's t test). (B) The abundance of exon-intron junctions and exon-exon junctions in samples described in A was measured by RT-qPCR using PCR primers amplifying spliced or unspliced transcripts including introns containing pri-miRNAs or other introns. The splicing efficiency was calculated by the ratio of spliced to unspliced transcripts. Values obtained for the control sample (siScr) were attributed a value of 1. NS indicates ‘Not Significant’. The graphs represent the mean ± SEM obtained from three or more independent experiments (**P < 0.01, ***P < 0.001, independent Student's t test). (C) Extracts of HepG2 cells transfected with siRNA targeting NF90 (NF90, NF90#2) or a non-targeting control (Scr, Scr#2) as indicated were analyzed by immunoblot using the antibodies indicated. (D) NF90 modulates transcript cleavage at the region containing miRNA. Extracts of HepG2 cells transfected with siRNAs targeting NF90 (NF90, NF90#2) or non-targeting controls (Scr, Scr#2) as indicated were analyzed by modified 5′ RLM-RACE. Forward and reverse primers used, and the predicted sizes of the PCR products are indicated.

References

    1. Ebert M.S., Sharp P.A.. Roles for microRNAs in conferring robustness to biological processes. Cell. 2012; 149:515–524. - PMC - PubMed
    1. Shenoy A., Blelloch R.H.. Regulation of microRNA function in somatic stem cell proliferation and differentiation. Nat. Rev. Mol. Cell. Biol. 2014; 15:565–576. - PMC - PubMed
    1. Denli A.M., Tops B.B., Plasterk R.H., Ketting R.F., Hannon G.J.. Processing of primary microRNAs by the Microprocessor complex. Nature. 2004; 432:231–235. - PubMed
    1. Gregory R.I., Yan K.P., Amuthan G., Chendrimada T., Doratotaj B., Cooch N., Shiekhattar R.. The Microprocessor complex mediates the genesis of microRNAs. Nature. 2004; 432:235–240. - PubMed
    1. Ha M., Kim V.N.. Regulation of microRNA biogenesis. Nat. Rev. Mol. Cell Biol. 2014; 15:509–524. - PubMed

Publication types

MeSH terms