. 2020 Aug 3;130(8):4266-4281.
doi: 10.1172/JCI131572.

Targeting the innate immunoreceptor RIG-I overcomes melanoma-intrinsic resistance to T cell immunotherapy

Affiliations

Targeting the innate immunoreceptor RIG-I overcomes melanoma-intrinsic resistance to T cell immunotherapy

Lina Such et al. J Clin Invest. .

Abstract

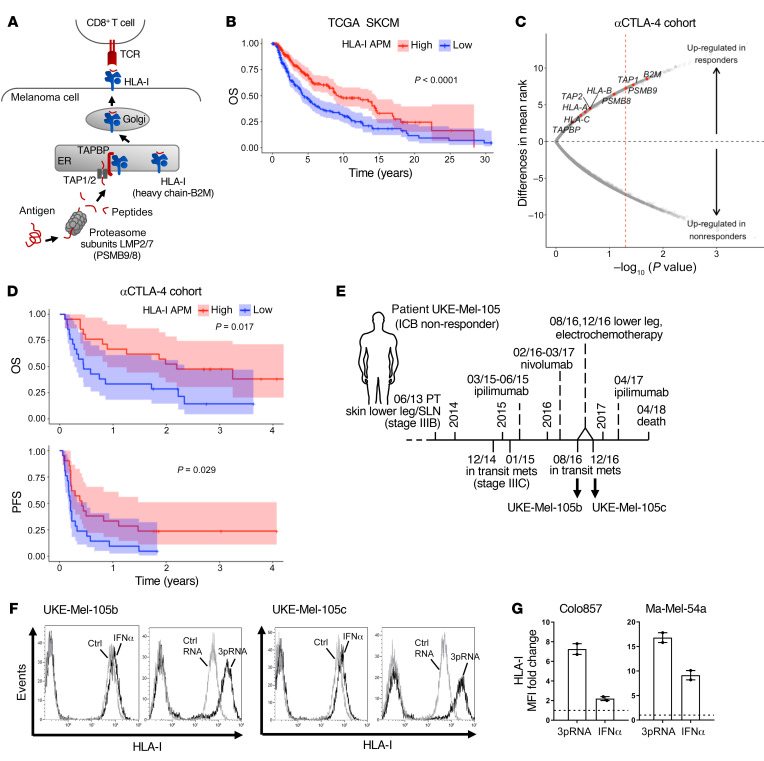
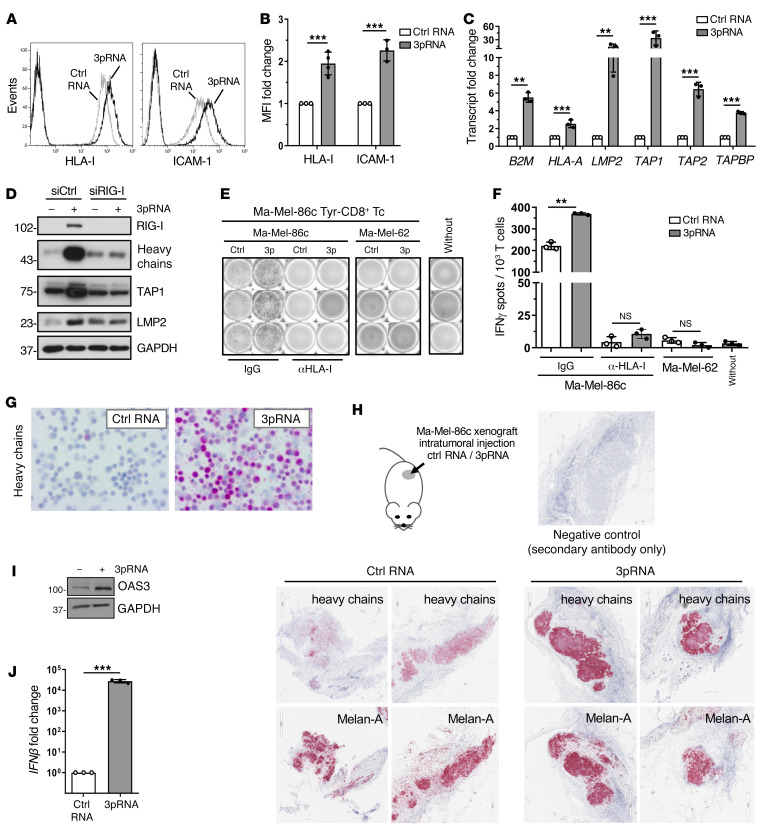
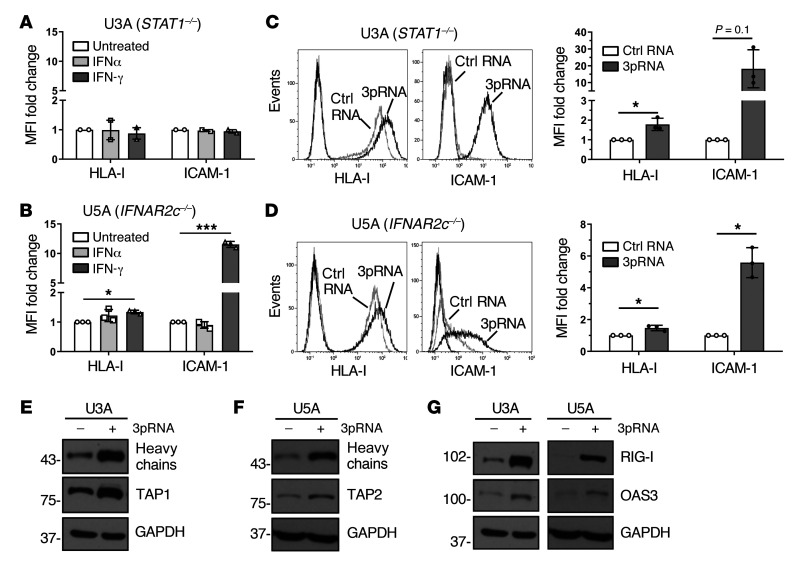
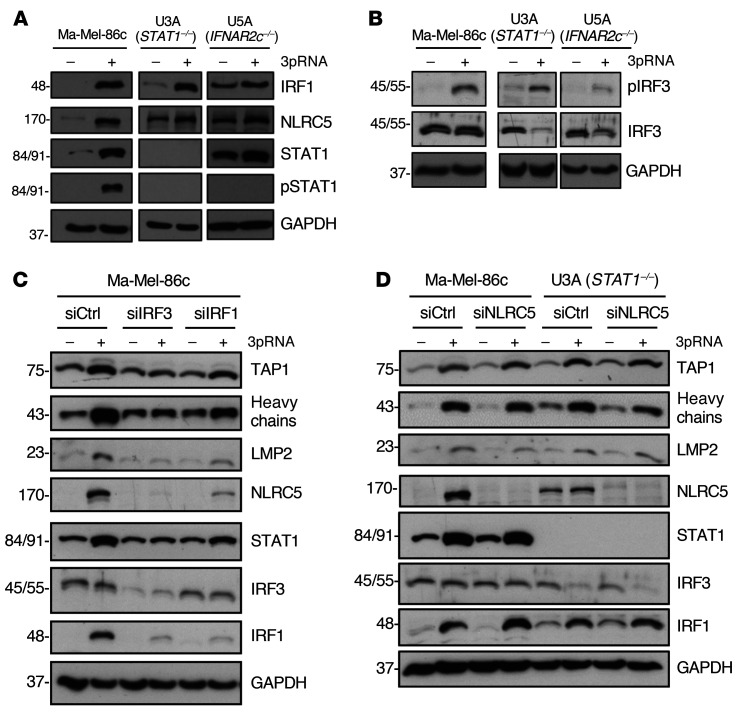
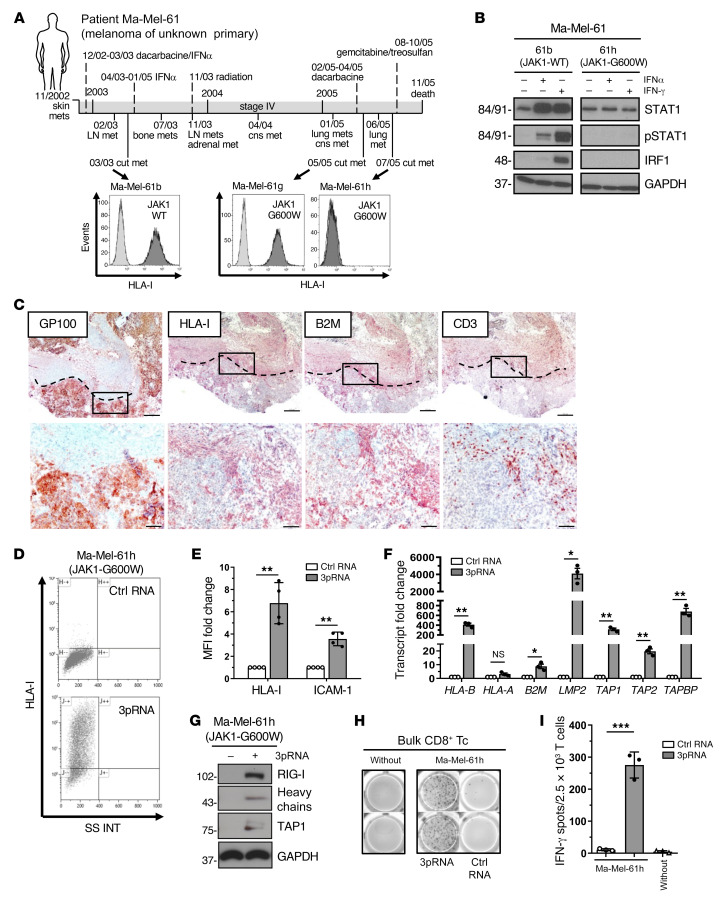
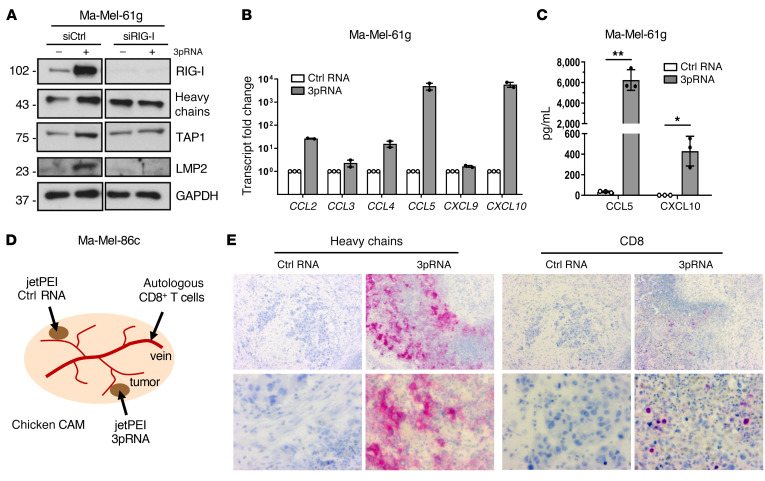
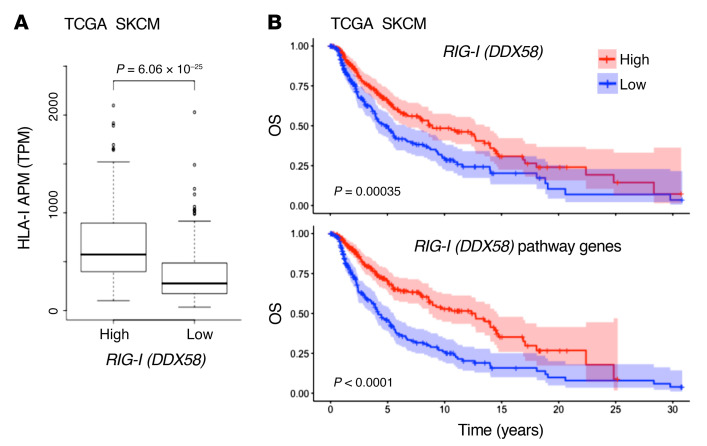
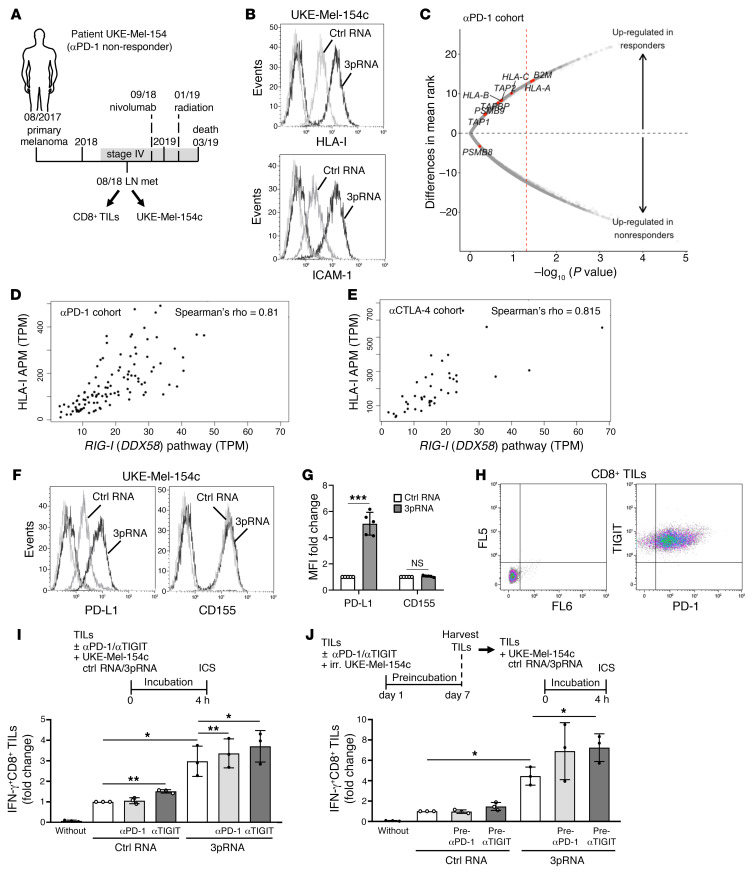
Understanding tumor resistance to T cell immunotherapies is critical to improve patient outcomes. Our study revealed a role for transcriptional suppression of the tumor-intrinsic HLA class I (HLA-I) antigen processing and presentation machinery (APM) in therapy resistance. Low HLA-I APM mRNA levels in melanoma metastases before immune checkpoint blockade (ICB) correlated with nonresponsiveness to therapy and poor clinical outcome. Patient-derived melanoma cells with silenced HLA-I APM escaped recognition by autologous CD8+ T cells. However, targeted activation of the innate immunoreceptor RIG-I initiated de novo HLA-I APM transcription, thereby overcoming T cell resistance. Antigen presentation was restored in interferon-sensitive (IFN-sensitive) but also immunoedited IFN-resistant melanoma models through RIG-I-dependent stimulation of an IFN-independent salvage pathway involving IRF1 and IRF3. Likewise, enhanced HLA-I APM expression was detected in RIG-Ihi (DDX58hi) melanoma biopsies, correlating with improved patient survival. Induction of HLA-I APM by RIG-I synergized with antibodies blocking PD-1 and TIGIT inhibitory checkpoints in boosting the antitumor T cell activity of ICB nonresponders. Overall, the herein-identified IFN-independent effect of RIG-I on tumor antigen presentation and T cell recognition proposes innate immunoreceptor targeting as a strategy to overcome intrinsic T cell resistance of IFN-sensitive and IFN-resistant melanomas and improve clinical outcomes in immunotherapy.

Keywords: Antigen presentation; Immunology; Melanoma; Oncology.


Conflict of interest statement

Conflict of interest: AP reports research grant support and provision of reagents from Bristol-Myers Squibb (BMS). EMVA reports advisory relationships and consulting with Tango Therapeutics, Genome Medical, Invitae, Illumina, and Ervaxx; research support from Novartis and BMS; equity in Tango Therapeutics, Genome Medical, Syapse, Ervaxx, and Microsoft; and travel reimbursement from Roche and Genentech. JCB has received speaker honoraria, advisory board honoraria, and/or research funding from Alcedis Amgen, Boehringer Ingelheim, BMS, CureVac, eTheRNA, IQVIA, Merck Serono, Novartis, Pfizer, Sanofi, ReProTher, and 4SC. GH is a cofounder of Rigontec GmbH. KSL is a cofounder of Abalos Therapeutics. DL reports funding by a postdoctoral fellowship from the Society for Immunotherapy of Cancers, which is funded in part by an educational grant from BMS. DS declares grants, personal fees, and/or nonfinancial support from BMS, Roche, Novartis, Regeneron, Sanofi, Merck Sharp & Dohme (MSD), Amgen, 4SC, Merck-EMD, Array, Pierre-Fabre, Philogen, Incyte, and Pfizer. MS has received speaker honoraria, advisory board honoraria, and/or research funding from AstraZeneca, BMS, Boehringer Ingelheim, MSD, Novartis, Pierre Fabre, Roche, and Takeda. AS reports personal fees from Novartis Adboard. SU declares research support, speaker honoraria, advisory board honoraria, and/or travel support from BMS, Merck Serono, MSD, Novartis, and Roche.

Figures

Figure 1
Figure 1. Low HLA-I APM expression correlates with nonresponsiveness to anti–CTLA-4 therapy and poor clinical outcome.
(A) Schematic representation of HLA-I APM components. (B) Overall survival (OS) in the TCGA SKCM cohort (n = 462) stratified by high and low HLA-I APM (HLA-A, HLA-B, HLA-C, B2M, LMP2, LMP7, TAP1, TAP2, TAPBP) expression relative to the median, log-rank test. (C and D) Clinical relevance of altered HLA-I APM expression in an anti–CTLA-4–treated (αCTLA-4–treated) patient cohort (30). (C) Volcano plot showing overall upregulation of HLA-I APM genes in clinical responders (n = 14) versus nonresponders (n = 23) in the αCTLA-4–treated cohort. The x axis is the negative log10 value of the Mann-Whitney U P value; the y axis is the difference in mean rank between response groups. Red vertical dashed line, unadjusted P value of 0.05. (D) Kaplan-Meier survival curves of OS and PFS of high (n = 21) and low (n = 21) HLA-I APM expression groups, log-rank test. High and low expression groups were classified relative to the median HLA-I APM expression level in the entire cohort. (E) Clinical history of melanoma patient UKE-Mel-105 (ICB nonresponder). Horizontal line, time axis; above: diagnosis, therapeutic regimens, death; below: metastases development; arrows indicate cell lines established from metastases UKE-Mel-105b and UKE-Mel-105c. (F and G) Melanoma cells were transfected with 3pRNA, control (ctrl) RNA, or treated with IFNα-2a (IFNα) and subjected to further analysis following an incubation of 20 to 24 hours. HLA-I surface expression was measured by flow cytometry. (F) Representative histograms for UKE-Mel-105b and UKE-Mel-105c cells from 3 independent experiments. (G) HLA-I expression on Colo857 and Ma-Mel-54a melanoma cells. Relative MFI given as mean plus SEM, 2 independent experiments.
Figure 2
Figure 2. Targeted RIG-I activation enhances HLA-I APM expression and CD8+ T cell recognition of melanoma cells.
(AG, I and J) Melanoma Ma-Mel-86c cells were transfected with 3pRNA or control (ctrl) RNA and subjected to further analyses following an incubation of 20 to 24 hours. (A and B) HLA-I and ICAM-1 surface expression measured by flow cytometry. (A) Representative histograms, (B) relative MFI given as mean plus SEM from 3 independent experiments. (C) HLA-I APM component expression determined by qPCR. Relative expression given as mean plus SEM from 3 independent experiments. (D) Ma-Mel-86c cells were transfected with RIG-I (siRIG-I) or control (siCtrl) siRNA 24 hours before 3pRNA or ctrl RNA transfection and subsequently analyzed for APM component expression by immunoblot. GAPDH, loading control. Representative data from 3 independent experiments. (E and F) 3pRNA- and ctrl RNA–transfected Ma-Mel-86c cells, preincubated with blocking anti–HLA-I mAb W6/32 or control IgG, were cocultured with an autologous tyrosinase–specific CD8+ T cell clone (Tyr-CD8+ Tc). T cell activation by autologous Ma-Mel-86c and allogenic HLA-I–mismatched Ma-Mel-62 cells was determined by IFN ELISpot assay. (E) Representative ELISpot results and (F) mean IFN-γ spots (+ SEM) from 3 independent experiments. Without, T cells without tumor cells. (G) Representative immunocytochemical staining of Ma-Mel-86c cells for HLA-I heavy chains from 3 independent experiments. (H) Ma-Mel-86c tumors grown subcutaneously on NOD/SCID mice were injected once with ctrl RNA (n = 4) or 3pRNA (n = 4). After 24 hours, tumors were excised and analyzed by immunohistochemistry for expression of HLA-I heavy chains and melanoma marker Melan-A. Representative staining, original magnification ×20. (I) OAS3 expression analyzed by immunoblot. GAPDH, loading control. Representative data from 3 independent experiments. (J) IFNβ mRNA expression determined by qPCR. Relative expression given as mean plus SEM from 3 independent experiments. Significantly different experimental groups: **P < 0.01, ***P < 0.005 by 2-tailed paired t test.
Figure 3
Figure 3. RIG-I upregulates HLA-I APM expression in IFN-I–resistant tumor cells.
(A and B) Human fibrosarcoma cells U3A (STAT1–/–) (A) and U5A (IFNAR2c–/–) (B) were treated with IFNα or IFN-γ for 20 to 24 hours. Controls were left untreated. HLA-I and ICAM-1 surface expression was determined by flow cytometry. Relative MFI given as mean plus SEM of 2 (A) and 3 (B) independent experiments. (CG) U3A and U5A cells were transfected with 3pRNA or control (ctrl) RNA and subjected to further analyses following an incubation of 20 to 24 hours. (C and D) HLA-I and ICAM-1 surface expression of U3A (C) and U5A (D) cells measured by flow cytometry. Left, representative histogram; right, relative MFI given as mean plus SEM from 3 independent experiments. (E and F) HLA-I APM component expression in U3A (E) and U5A (F) cells analyzed by immunoblot. GAPDH, loading control. Representative data from 3 independent experiments. (G) RIG-I and OAS3 expression in U3A and U5A cells determined by immunoblot. GAPDH, loading control. Representative data from 3 independent experiments. Significantly different experimental groups: *P < 0.05, ***P < 0.005 by 2-tailed paired t test.
Figure 4
Figure 4. IRF1 and IRF3 mediate IFN-independent HLA-I APM upregulation upon RIG-I activation.
(AD) Melanoma cells Ma-Mel-86c and fibrosarcoma cells U3A (STAT1–/–) and U5A (IFNAR2c–/–) were transfected with 3pRNA (+) or control RNA (–) and subjected to further analysis following an incubation of 20 to 24 hours. (A and B) Representative (p)STAT1 (A), IRF1 (A), (p)IRF3 (B), and NLRC5 (A) immunoblots from 3 independent experiments. GAPDH, loading control. (C and D) Ma-Mel-86c and U3A cells were transfected with siRNA targeting IRF3 (siIRF3) (C), IRF1 (siIRF1) (C), NLRC5 (siNLRC5) (D), or control siRNA (siCtrl) (C and D) 24 hours before 3pRNA (+) or control RNA (–) transfection. Protein expression was analyzed by immunoblot. GAPDH, loading control. Representative data from 3 independent experiments.
Figure 5
Figure 5. Targeted RIG-I activation overcomes HLA-I APM silencing in IFN-I–resistant melanoma cells and restores T cell sensitivity.
(A) Clinical history of melanoma patient Ma-Mel-61. Horizontal line, time axis; above: diagnosis, therapeutic regimens, death; below: metastases development; arrows indicate cell lines established from metastases Ma-Mel-61b (JAK1-wildtype, JAK1-WT), Ma-Mel-61g (JAK1-mutant, JAK1-G600W) and Ma-Mel-61h (JAK1-mutant, JAK1-G600W). HLA-I surface expression on cell lines established from corresponding lesions was determined by flow cytometry. Representative histograms from 3 independent experiments. (B) Cell lines treated with IFNα-2b or IFN-γ for 48 hours were analyzed for (p)STAT1 and IRF1 expression by immunoblot. GAPDH, loading control. Representative data from 3 independent experiments. (C) Immunohistochemical staining of serial cryostat tissue sections from metastasis Ma-Mel-61g for melanoma marker GP100, HLA-I, B2M, and CD3. Top, tumor margin indicated by the dotted line; bottom, higher magnification of boxed regions; original magnifications: ×2.5 (top), ×10 (bottom). (DI) Ma-Mel-61h cells were transfected with 3pRNA or control (ctrl) RNA and subjected to further analysis following an incubation of 20 to 24 hours. (D and E) HLA-I and ICAM-1 surface expression measured by flow cytometry. (D) Representative HLA-I dot plot and (E) relative MFI given as mean plus SEM from 3 independent experiments. (F) mRNA expression of APM components analyzed by qPCR. Relative expression given as mean plus SEM from 3 independent experiments. (G) Expression of indicated proteins analyzed by immunoblot. GAPDH, loading control. Representative data from 3 independent experiments. (H and I) Activation of autologous CD8+ T cells by Ma-Mel-61h cells determined by IFN-γ ELISpot assay. (H) Representative ELISpot, (I) mean IFN-γ spots (+ SEM) from 3 independent experiments. without, incubation of T cells without tumor cells. Significantly different experimental groups: *P < 0.05, **P < 0.01, ***P < 0.005 by 2-tailed paired t test.
Figure 6
Figure 6. IFN-I–independent chemokine release and CD8+ T cell recruitment in response to RIG-I signaling.
(AC) Ma-Mel-61g cells were transfected with 3pRNA or control (ctrl) RNA and subjected to further analyses following an incubation of 20 to 24 hours. (A) Ma-Mel-61g cells were transfected with RIG-I siRNA (siRIG-I) or control siRNA (siCtrl) 24 hours before 3pRNA or ctrl RNA transfection and subsequently analyzed for protein expression by immunoblot. GAPDH, loading control. Representative data from 3 independent experiments. (B) Chemokine mRNA expression determined by qPCR. Relative expression given as mean plus SEM from 2 independent experiments. (C) Cell culture supernatants were analyzed for CCL5 and CXCL10 content by ELISA. Chemokine levels given as mean plus SEM from 3 independent experiments. Significantly different experimental groups: *P < 0.05, **P < 0.01 by 2-tailed paired t test. (D) Schematic representation of the chicken CAM model. Ma-Mel-86c cells transplanted onto 2 distant sites of each CAM, autologous tumor–reactive CD8+ T cells injected into accessible vein. (E) Human Ma-Mel-86c tumors grown on chicken CAM were analyzed by immunohistochemistry. The 2 tumors on each CAM were treated with either 3pRNA (n = 4) or ctrl RNA (n = 4) on 2 consecutive days. At 24 hours after RNA application, autologous T cells were injected into the blood vessels of the embryo. Tumors were harvested 20 hours after T cell injection. Representative CD8 and HLA-I heavy chain staining shown for each group; original magnifications: ×10 (top), ×40 (bottom).
Figure 7
Figure 7. RIG-I (DDX58) expression in melanoma correlates with HLA-I APM expression and patient survival.
(A) HLA-I APM expression in high and low RIG-I (DDX58) expression groups relative to the median RIG-I (DDX58) expression level in the TCGA SKCM cohort. Mann-Whitney U P value is shown. (B) Overall survival in the TCGA SKCM cohort (n = 462) stratified by high and low expression of RIG-I (DDX58) (top) and RIG-I (DDX58) pathway genes (bottom) relative to the median. Log-rank P value shown.
Figure 8
Figure 8. Combination of 3pRNA and ICB improves TIL reactivity toward autologous melanoma cells.
(A) Clinical history of melanoma patient UKE-Mel-154. Horizontal line, time axis; above: diagnosis, therapeutic regimens, death; below: UKE-Mel-154c melanoma cell and CD8+ TILs obtained from lymph node (LN) metastasis. (B) HLA-I and ICAM-1 surface expression on 3pRNA- and ctrl RNA–transfected UKE-Mel-154c cells. Representative histograms from 3 independent experiments. (C) Volcano plot showing overall upregulation of HLA-I APM genes in clinical responders (n = 57) versus nonresponders (n = 62) in the αPD-1–treated cohort (39). The x axis is the negative log10 value of the Mann-Whitney U P value; the y axis is the difference in mean rank between response groups. Red vertical dashed line, unadjusted P value of 0.05. (D and E) Scatterplot of RIG-I (DDX58) pathway expression against HLA-I APM expression across all samples in the αPD-1 (n = 121) and αCTLA-4 (n = 42) cohort. (F and G) PD-L1 and CD155 surface expression on 3pRNA- or ctrl RNA–transfected UKE-Mel-154c cells. (F) Representative histograms, (G) relative MFI given as mean plus SEM from 3 independent experiments. (H) Representative PD-1 and TIGIT surface expression on TILs from 3 independent experiments. (I and J) Combination of targeted RIG-I activation and ICB enhances TIL reactivity toward autologous melanoma cells. (I) Concurrent treatment. TIL activation after 4-hour coincubation with 3pRNA- or ctrl RNA–treated UKE-Mel-154c cells in the presence of PD-1 or αTIGIT antibodies, by intracellular cytokines staining (ICS). (J) Sequential treatment. After 7-day preincubation with irradiated (irr.) UKE-Mel-154c cells in the absence or presence of αPD-1 or αTIGIT antibodies, TILs were harvested and activation was measured after 4-hour coincubation with 3pRNA- or ctrl RNA–treated UKE-Mel-154c cells. (I and J) Mean plus SEM fold change in frequency of IFN-γ+CD8+ T cells stimulated by ctrl RNA–transfected UKE-Mel-154c cells from 3 independent experiments. (G, I, and J) Significantly different experimental groups: *P < 0.05, **P < 0.01, ***P < 0.005 by 2-tailed paired t test.

Comment in

References

    1. Sucker A, et al. Genetic evolution of T-cell resistance in the course of melanoma progression. Clin Cancer Res. 2014;20(24):6593–6604. doi: 10.1158/1078-0432.CCR-14-0567. - DOI - PMC - PubMed
    1. Rooney MS, Shukla SA, Wu CJ, Getz G, Hacohen N. Molecular and genetic properties of tumors associated with local immune cytolytic activity. Cell. 2015;160(1–2):48–61. doi: 10.1016/j.cell.2014.12.033. - DOI - PMC - PubMed
    1. Zhao F, et al. Melanoma lesions independently acquire T-cell resistance during metastatic latency. Cancer Res. 2016;76(15):4347–4358. doi: 10.1158/0008-5472.CAN-16-0008. - DOI - PubMed
    1. Zaretsky JM, et al. Mutations associated with acquired resistance to PD-1 blockade in melanoma. N Engl J Med. 2016;375(9):819–829. doi: 10.1056/NEJMoa1604958. - DOI - PMC - PubMed
    1. Tran E, et al. T-cell transfer therapy targeting mutant KRAS in cancer. N Engl J Med. 2016;375(23):2255–2262. doi: 10.1056/NEJMoa1609279. - DOI - PMC - PubMed

Publication types

MeSH terms