. 2020 Jun 18;5(12):e136007.
doi: 10.1172/jci.insight.136007.

TrkB agonists prevent postischemic emergence of refractory neonatal seizures in mice

Affiliations

TrkB agonists prevent postischemic emergence of refractory neonatal seizures in mice

Pavel A Kipnis et al. JCI Insight. .

Abstract

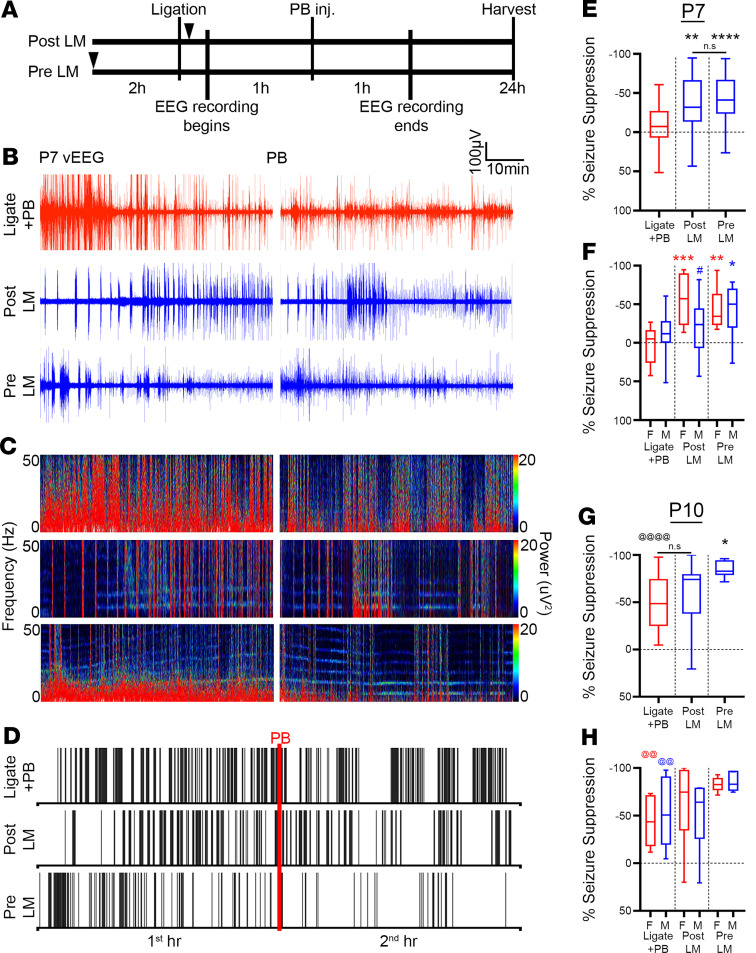
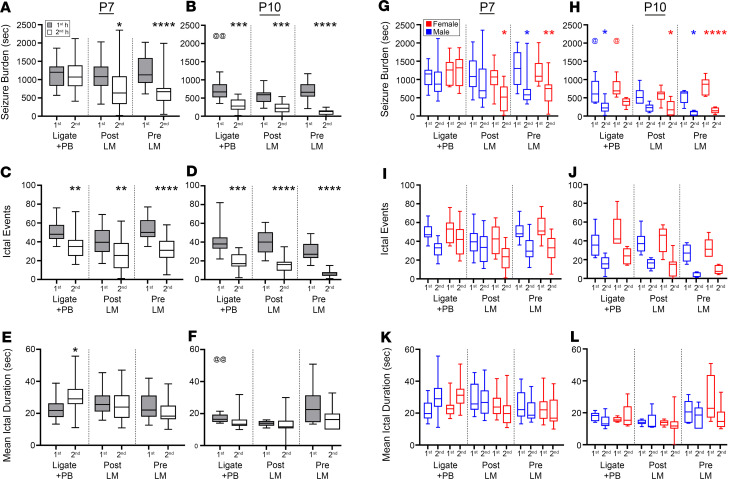
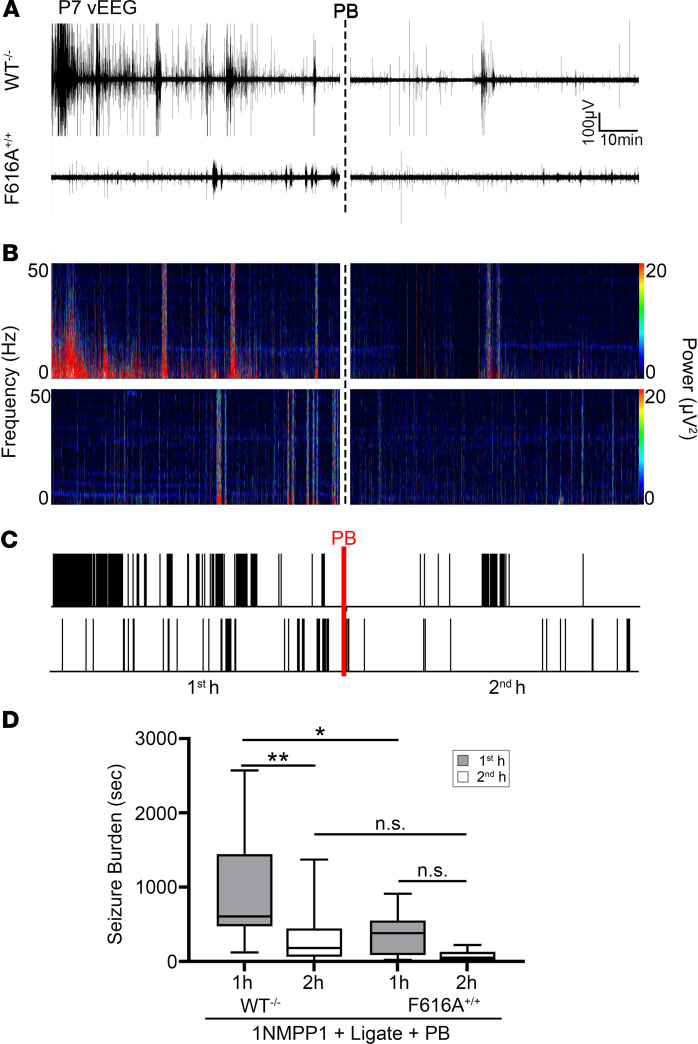
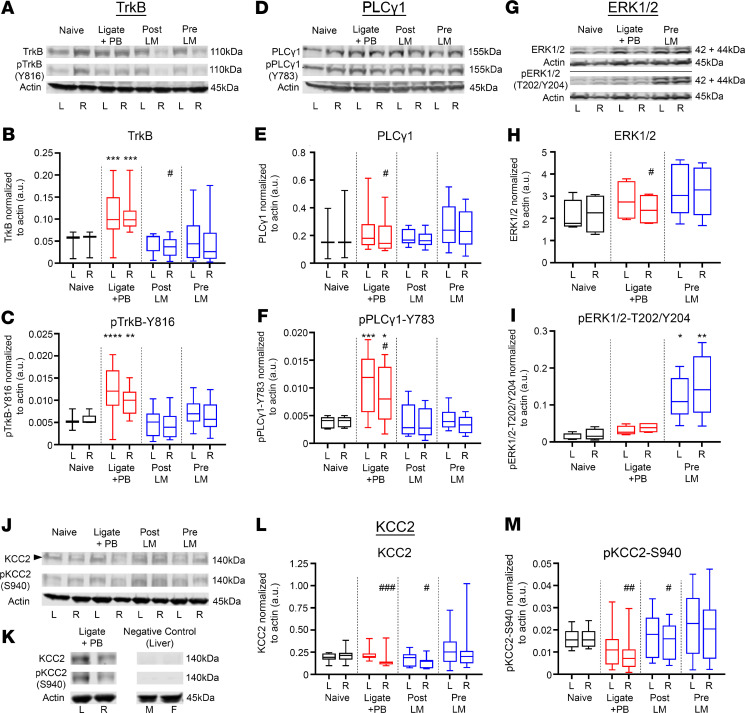
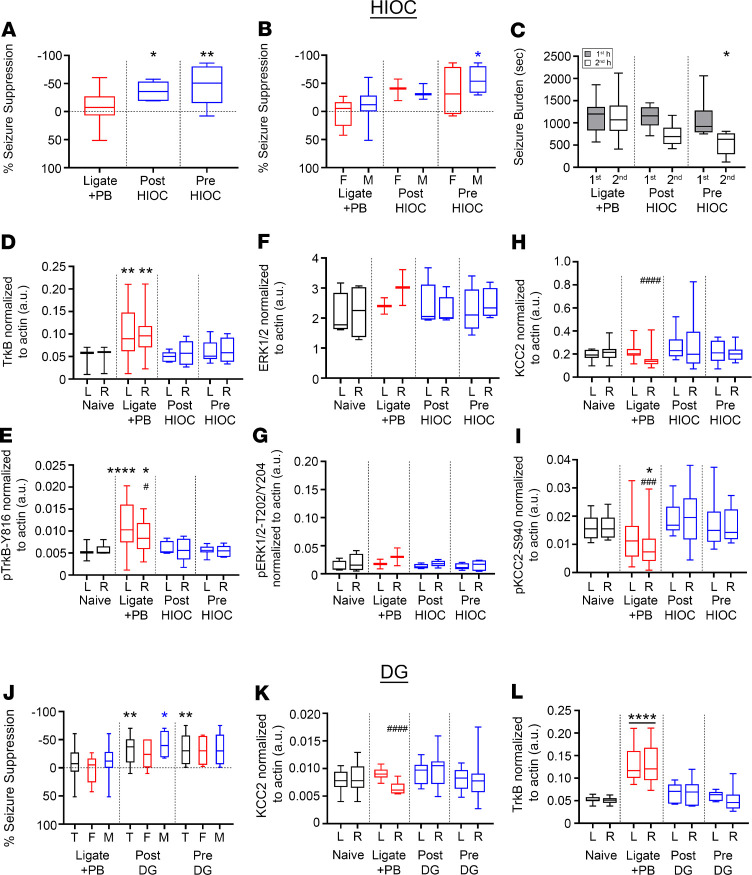
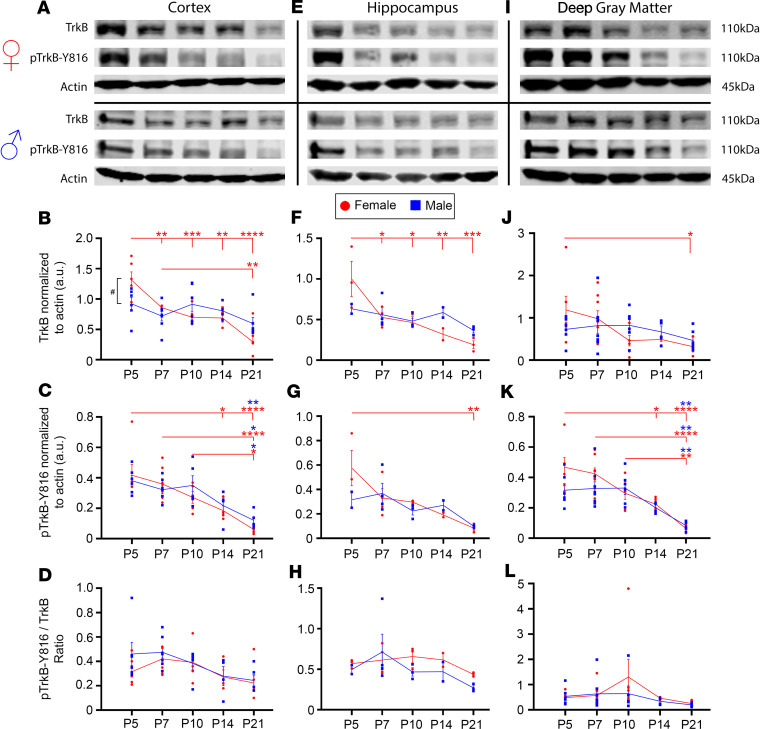
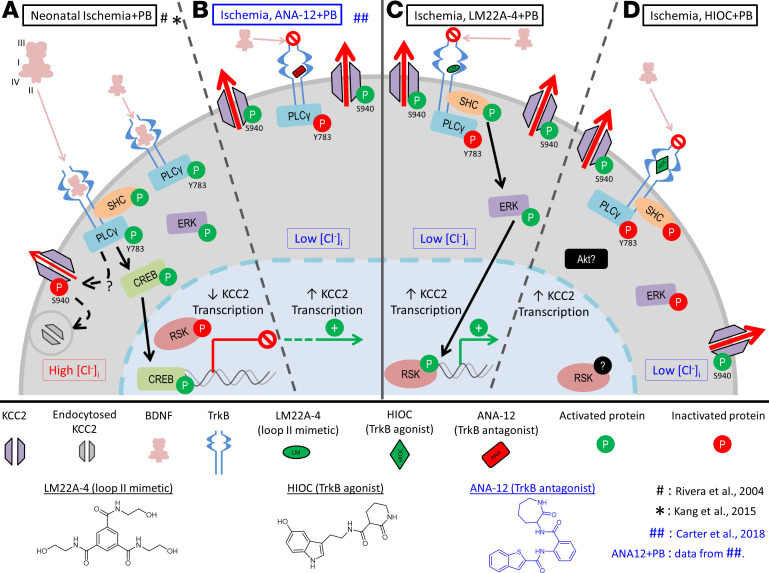
Refractory neonatal seizures do not respond to first-line antiseizure medications like phenobarbital (PB), a positive allosteric modulator for GABAA receptors. GABAA receptor-mediated inhibition is dependent upon electroneutral cation-chloride transporter KCC2, which mediates neuronal chloride extrusion and its age-dependent increase and postnatally shifts GABAergic signaling from depolarizing to hyperpolarizing. Brain-derived neurotropic factor-tyrosine receptor kinase B activation (BDNF-TrkB activation) after excitotoxic injury recruits downstream targets like PLCγ1, leading to KCC2 hypofunction. Here, the antiseizure efficacy of TrkB agonists LM22A-4, HIOC, and deoxygedunin (DG) on PB-refractory seizures and postischemic TrkB pathway activation was investigated in a mouse model (CD-1, P7) of refractory neonatal seizures. LM, a BDNF loop II mimetic, rescued PB-refractory seizures in a sexually dimorphic manner. Efficacy was associated with a substantial reduction in the postischemic phosphorylation of TrkB at Y816, a site known to mediate postischemic KCC2 hypofunction via PLCγ1 activation. LM rescued ischemia-induced phospho-KCC2-S940 dephosphorylation, preserving its membrane stability. Full TrkB agonists HIOC and DG similarly rescued PB refractoriness. Chemogenetic inactivation of TrkB substantially reduced postischemic neonatal seizure burdens at P7. Sex differences identified in developmental expression profiles of TrkB and KCC2 may underlie the sexually dimorphic efficacy of LM. These results support a potentially novel role for the TrkB receptor in the emergence of age-dependent refractory neonatal seizures.

Keywords: Development; Neuroscience; Seizures.


Conflict of interest statement

Conflict of interest: SDK is listed as an author on US patent 10525024B2, “Methods for rescuing phenobarbital-resistance of seizures by ANA-12 or ANA-12 in combination with CLP290.”

Figures

Figure 1
Figure 1. LM significantly rescued PB refractoriness.
(A) Experimental paradigm to evaluate LM efficacy in a mouse model of ischemic neonatal seizures. Pups were randomly assigned to treatment groups (see Supplemental Table 1 for sample sizes). Black arrowheads indicate time point of LM intervention. (B) Representative EEG traces, (C) power spectrograms (0–50 Hz), and (D) raster plots showing significantly rescued PB refractoriness in post- and pre-LM0.25 pups. Red line, time point of PB administration. (E) EEG percentage of seizure suppression for ligate+PB–, post-LM–, and pre-LM–treated P7 pups. **P < 0.01 (post-LM vs. ligate+PB), ****P < 0.0001 (pre-LM vs. ligate+PB) by 1-way ANOVA. Number of mice n = 28 (ligate+PB), 26 (post-LM), 27 (pre-LM). (F) EEG percentage of seizure suppression by sex for ligate+PB–, post-LM–, and pre-LM–treated P7 pups. *P < 0.05 (male pre-LM vs. male ligate+PB), **P < 0.01 (female pre-LM vs. female ligate+PB), ***P < 0.001 (female post-LM vs. female ligate+PB) by 2-way ANOVA. The # indicates within-group sex differences; #P < 0.05 by 2-tailed t test. n = 16/12 (ligate+PB [M/F]), 14/12 (post-LM), 14/13 (pre-LM). (G) EEG percentage of seizure suppression for ligate+PB–, post-LM–, and pre-LM–treated P10 pups. *P < 0.01 (pre-LM vs. ligate+PB) by 1-way ANOVA. The @ indicates difference between P7 and P10; @@@@P < 0.0001 by 2-tailed t test. n = 11 (ligate+PB), 13 (post-LM), 11 (pre-LM). (H) EEG percentage of seizure suppression by sex for ligate+PB–, post-LM–, and pre-LM–treated P10 pups. The @ indicates sex differences between P7 and P10; @@P < 0.01 by 2-tailed t test. n = 6/5 (ligate+PB [M/F]), 6/7 (post-LM), 5/6 (pre-LM). Box-and-whisker plots show quartiles with median and minima and maxima at the bottom and top whiskers, respectively.
Figure 2
Figure 2. LM efficacy was sexually dimorphic and driven by significant reduction of ictal events, but not ictal durations, at both P7 and P10.
(A) EEG seizure burdens for ligate+PB–, post-LM0.25–, and pre-LM0.25–treated P7 pups. *P < 0.05 (second post-LM vs. first post-LM); ****P < 0.0001 (second pre-LM vs. first pre-LM) by 2-way ANOVA. (B) EEG seizure burdens for ligate+PB–, post-LM–, and pre-LM–treated P10 pups. ***P < 0.001 (second ligate+PB vs. first ligate+PB, and second post-LM vs. first post-LM); ****P < 0.0001 (second pre-LM vs. first pre-LM) by 2-way ANOVA. The @ indicates differences between P7 and P10; @@P < 0.01 by 2-tailed t test. (C) EEG ictal events for ligate+PB–, post-LM–, and pre-LM–treated P7 pups. **P < 0.001 (second ligate+PB vs. first ligate+PB, and second post-LM vs. first post-LM); ****P < 0.0001 (second pre-LM vs. first pre-LM) by 2-way ANOVA. (D) EEG ictal events for ligate+PB–, post-LM–, and pre-LM–treated P10 pups. ***P < 0.001 (second ligate+PB vs. first ligate+PB), ****P < 0.0001 (second post-LM vs. first post-LM, and second pre-LM vs. first pre-LM) by 2-way ANOVA. (E) EEG mean ictal durations for ligate+PB–, post-LM–, and pre-LM–treated P7 pups. *P < 0.05 (second ligate+PB vs. first ligate+PB) by 2-way ANOVA. (F) EEG mean ictal durations for ligate+PB–, post-LM–, and pre-LM–treated P10 pups. @@P < 0.01 by 2-tailed t test. (G) EEG seizure burdens by sex for ligate+PB–, post-LM–, and pre-LM–treated P7 pups. *P < 0.05 (second female post-LM vs. first female post-LM, and second male pre-LM vs. first male pre-LM); **P < 0.01 (second female pre-LM vs. first female pre-LM) by 2-way ANOVA. (H) EEG seizure burdens by sex for ligate+PB–, post-LM–, and pre-LM–treated P10 pups. *P < 0.05 (second male ligate+PB vs. first male ligate+PB, second female post-LM vs. first female post-LM, and second male pre-LM vs. first male pre-LM); ****P < 0.0001 (second female pre-LM vs. first female pre-LM) by 2-way ANOVA; @P < 0.05 by 2-tailed t test. (I) EEG ictal events by sex for ligate+PB–, post-LM–, and pre-LM–treated P7 and (J) P10 pups. (K) EEG mean ictal durations by sex for ligate+PB–, post-LM–, and pre-LM–treated P7 and (L) P10 pups. Number of P7 mice: n = 28 [16/12] (ligate+PB [M/F]), 26 [14/12] (post-LM), 27 [14/13] (pre-LM). Number of P10 mice: n = 11 [6/5] (ligate+PB), 13[6/7] (post-LM), 11 [5/6] (pre-LM). Box-and-whisker plots show quartiles with median with minima and maxima at the bottom and top whiskers, respectively.
Figure 3
Figure 3. Postischemic TrkB activation underlies neonatal seizure susceptibility.
(A) Representative EEG traces in WT–/– and F616A+/+ pups, (B) power spectrograms (0.5–50 Hz), and (C) raster plots showed significantly lower first-hour postischemic EEG seizure burdens in F616A+/+. Dotted black and red lines indicate time point of PB administration. (D) EEG seizure burdens during first and second hours after ligation in WT–/– and F616A+/+ pups. *P < 0.05, **P < 0.01 by 2-way ANOVA. Number of mice: n = 18 [9/9] (WT–/– [M/F]), 10 [6/4] (F616A+/+). Box-and-whisker plots show quartiles with median with minima and maxima at the bottom and top whiskers, respectively.
Figure 4
Figure 4. LM rescued postischemic TrkB/PLCγ1 pathway activation, activated the TrkB/ERK1/2 pathway, and rescued ipsilateral KCC2 degradation.
All proteins of interest were normalized to housekeeping protein β-actin. Phosphoproteins were also normalized to their respective total protein (see Supplemental Figure 3). The * indicates differences between treatment group and naive controls; the # indicates differences between contralateral and ipsilateral hemispheres within groups. (A) Representative Western blots showing TrkB and p–TrkB-Y816 expression for all treatment groups. (B) Contralateral (L) and ipsilateral (R) TrkB expression 24 hours after ischemic insult. ***P < 0.001 by 1-way ANOVA. #P < 0.05 by 2-tailed t test. (C) Contralateral (L) and ipsilateral (R) p–TrkB-Y816 expression 24 hours after ischemic insult. **P < 0.01, ****P < 0.0001 by 1-way ANOVA. (D) Representative Western blots showing PLCγ1 and p–PLCγ1-Y783 expression. (E) Contralateral (L) and ipsilateral (R) PLCγ1 expression 24 hours after ischemic insult. #P < 0.05 by 2-tailed t test. (F) Contralateral (L) and ipsilateral (R) p–PLCγ1-Y783 expression 24 hours after ischemic insult. *P < 0.05, ***P < 0.001 by 1-way ANOVA. #P < 0.05 by 2-tailed t test. (G) Representative Western blots showing ERK1/2 and p-ERK1/2-T202/Y204 expression. (H) Contralateral (L) and ipsilateral (R) ERK1/2 expression 24 hours after ischemic insult. #P < 0.05 by 2-tailed t test. (I) Contralateral (L) and ipsilateral (R) p-ERK1/2-T202/Y204 expression 24 hours after ischemic insult. *P < 0.05, **P < 0.01 by 1-way ANOVA. (J) Representative Western blots showing KCC2 and p–KCC2-S940 expression. (K) Representative Western blot showing lack of KCC2 and p–KCC2-S940 band in liver samples from P7 pups. (L) Contralateral (L) and ipsilateral (R) KCC2 expression 24 hours after ischemic insult. #P < 0.05, ###P < 0.001 by 2-tailed t test. (M) Contralateral (L) and ipsilateral (R) p–KCC2-S940 expression 24 hours after ischemic insult. #P < 0.05, ##P < 0.01 by 2-tailed t test. Number of mice: n = 13 [6/7] (naive [M/F]), 19 [10/9] (ligate+PB), 13 [5/8] (post-LM), 22 [11/11] (pre-LM). Box-and-whisker plots show quartiles with median with minima and maxima at the bottom and top whiskers, respectively.
Figure 5
Figure 5. HIOC and DG significantly rescued PB-refractory seizures at P7.
(A) EEG percentage of seizure suppression for ligate+PB–, post-HIOC–, and pre-HIOC–treated P7 pups. *P < 0.05, **P < 0.01 by 1-way ANOVA. Number of mice (EEG): n = 28 [16/12] (ligate+PB [M/F]), 6 [3/3] (post-HIOC), 8 [4/4] (pre-HIOC). (B) EEG percentage of seizure suppression by sex for ligate+PB–, post-HIOC–, and pre-HIOC–treated P7 pups. *P < 0.05 by 2-way ANOVA. (C) EEG seizure burdens for ligate+PB–, post-HIOC–, and pre-HIOC–treated P7 pups. *P < 0.05 by 2-way ANOVA. (D) Contralateral (L) and ipsilateral (R) TrkB expression 24 hours after ischemic insult for all treatment groups. **P < 0.01 by 1-way ANOVA. All proteins were normalized to housekeeping protein β-actin. Number of mice (Western blot): n = 13 [6/7] (naive), 19 [10/9] (ligate+PB), 5 [3/2] (post-HIOC), 6 [4/2] (pre-HIOC). (E) Contralateral (L) and ipsilateral (R) p–TrkB-Y816 expression 24 hours after ischemic insult. *P < 0.05. ****P < 0.0001 by 1-way ANOVA. The # indicates differences between contralateral and ipsilateral hemispheres within groups; #P < 0.05 by 2-tailed t test. (F) Contralateral (L) and ipsilateral (R) ERK1/2 expression 24 hours after ischemic insult. (G) Contralateral (L) and ipsilateral (R) p-ERK1/2-T202/Y204 expression 24 hours after ischemic insult. (H) Contralateral (L) and ipsilateral (R) KCC2 expression 24 hours after ischemic insult. ####P < 0.0001 by 2-tailed t test. (I) Contralateral (L) and ipsilateral (R) p–KCC2-S940 expression 24 hours after ischemic insult. *P < 0.05 by 1-way ANOVA. ###P < 0.001 by 2-tailed t test. (J) EEG percentage of seizure suppression for ligate+PB, post-DG, and pre-DG treatment groups plotted as total data and split by sex. (T, total). *P < 0.05, **P <0.01 by 2-way ANOVA. Horizontal dotted line represents 0% suppression. Number of mice (EEG): n = 28 [16/12] (ligate+PB), 16 [8/8] (post-DG), 15 [10/5] (pre-DG). (K) Contralateral (L) and ipsilateral (R) KCC2 expression 24 hours after ischemic insult. The # signifies hemispheric differences within treatment groups. ####P < 0.0001 by 2-tailed t test. Number of mice (Western blot): n = 13 [6/7] (naive), 19 [10/9] (ligate+PB), 6 [4/2] (post-DG), 7 [4/3] (pre-DG). (L) Contralateral (L) and ipsilateral (R) TrkB expression 24 hours after ischemic insult. ****P < 0.0001 by 1-way ANOVA. Box-and-whisker plots show quartiles with median with minima and maxima at the bottom and top whiskers, respectively.
Figure 6
Figure 6. TrkB expression significantly decreased from P5 to P21 in a region-specific manner in naive female pups.
All proteins were normalized to β-actin. (A) Representative Western blots showing TrkB and p–TrkB-Y816 expression in cortex for all female and male age groups. (B) TrkB expression in cortical tissue from P5 to P21. #P < 0.05 signifies difference between sexes at a given age. **P < 0.01, ***P < 0.001, ****P < 0.0001 by 2-way ANOVA. (C) p–TrkB-Y816 expression in cortical tissue from P5 to P21. *P < 0.05, **P < 0.01, ****P < 0.0001 by 2-way ANOVA. (D) p–TrkB-Y816 normalized to total TrkB in cortical tissue from P5 to P21. (E) Representative Western blots showing TrkB and p–TrkB-Y816 expression in hippocampus for all female and male age groups. (F) TrkB expression in hippocampal tissue from P5 to P21. *P < 0.05, **P < 0.01, ***P < 0.001 by 2-way ANOVA. (G) p–TrkB-Y816 expression in hippocampal tissue from P5 to P21. **P < 0.01 by 2-way ANOVA. (H) p–TrkB-Y816 normalized to total TrkB in cortical tissue from P5 to P21. (I) Representative Western blots showing TrkB and p–TrkB-Y816 expression in deep gray matter for all female and male age groups. (J) TrkB expression in deep gray matter from P5 to P21. *P < 0.05 by 2-way ANOVA. (K) p–TrkB-Y816 expression in deep gray matter from P5 to P21. *P < 0.05, **P < 0.01, ****P < 0.0001 by 2-way ANOVA. (L) p–TrkB-Y816 normalized to total TrkB in deep gray matter from P5 to P21. Number of mice per age group and region: n ≥ 4 [2/2] (cortex [M/F]), ≥ 3 [1/2] (hippocampus), ≥ 4 [2/2] (deep gray matter). Dot plots show all data and the mean ± 1 SEM. Red (female) and blue (male) lines connect the means across age groups.
Figure 7
Figure 7. Summary schematic of TrkB signaling pathways after neonatal ischemia.
(A) Endogenous postischemic BDNF release results in activation of the TrkB/PLCγ1 pathway, thereby downregulating KCC2 expression (data summarized from refs. 12, 15) 24 hours after ischemia. (B) Treatment with the small-molecule TrkB antagonist ANA12 rescued postischemic TrkB/PLCγ1 pathway activation–mediated KCC2 degradation (data summarized from ref. 5). (C) Intervention with LM22A-4, a TrkB partial agonist, also rescued TrkB/PLCγ1 pathway activation, similar lyto ANA12, and activated the TrkB/ERK1/2 pathway instead. (D) Treatment with full TrkB agonist HIOC replicated the LM findings and rescued TrkB/PLCγ1 pathway activation but did not activate the TrkB/ERK1/2 pathway, indicating that TrkB site–specific engagement dictates downstream cascades.

References

    1. Aloyz R, Fawcett JP, Kaplan DR, Murphy RA, Miller FD. Activity-dependent activation of TrkB neurotrophin receptors in the adult CNS. Learn Mem. 1999;6(3):216–231. - PMC - PubMed
    1. Kang SK, Johnston MV, Kadam SD. Acute TrkB inhibition rescues phenobarbital-resistant seizures in a mouse model of neonatal ischemia. Eur J Neurosci. 2015;42(10):2792–2804. doi: 10.1111/ejn.13094. - DOI - PMC - PubMed
    1. He XP, Minichiello L, Klein R, McNamara JO. Immunohistochemical evidence of seizure-induced activation of TrkB receptors in the mossy fiber pathway of adult mouse hippocampus. J Neurosci. 2002;22(17):7502–7508. doi: 10.1523/JNEUROSCI.22-17-07502.2002. - DOI - PMC - PubMed
    1. Kowiański P, Lietzau G, Czuba E, Waśkow M, Steliga A, Moryś J. BDNF: a key factor with multipotent impact on brain signaling and synaptic plasticity. Cell Mol Neurobiol. 2018;38(3):579–593. doi: 10.1007/s10571-017-0510-4. - DOI - PMC - PubMed
    1. Carter BM, Sullivan BJ, Landers JR, Kadam SD. Dose-dependent reversal of KCC2 hypofunction and phenobarbital-resistant neonatal seizures by ANA12. Sci Rep. 2018;8(1):11987. doi: 10.1038/s41598-018-30486-7. - DOI - PMC - PubMed

Publication types

Substances