. 2020 May 19;11(1):2488.
doi: 10.1038/s41467-020-16191-y.

Neutrophil extracellular traps released by neutrophils impair revascularization and vascular remodeling after stroke

Affiliations

Neutrophil extracellular traps released by neutrophils impair revascularization and vascular remodeling after stroke

Lijing Kang et al. Nat Commun. .

Abstract

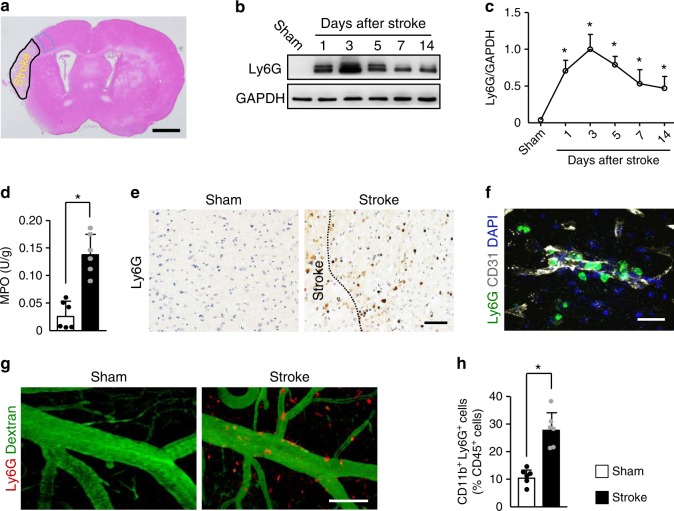
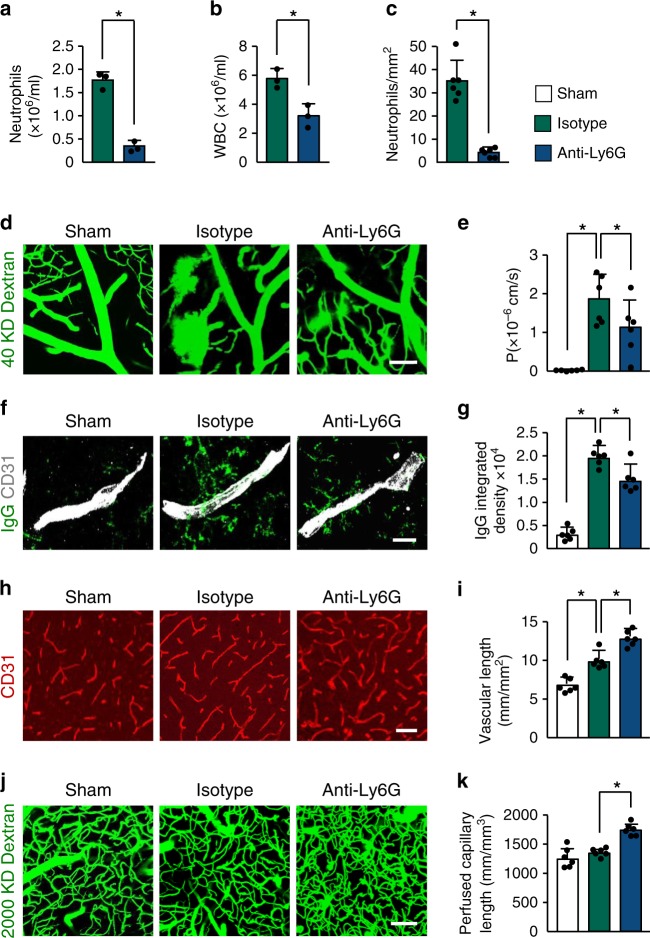
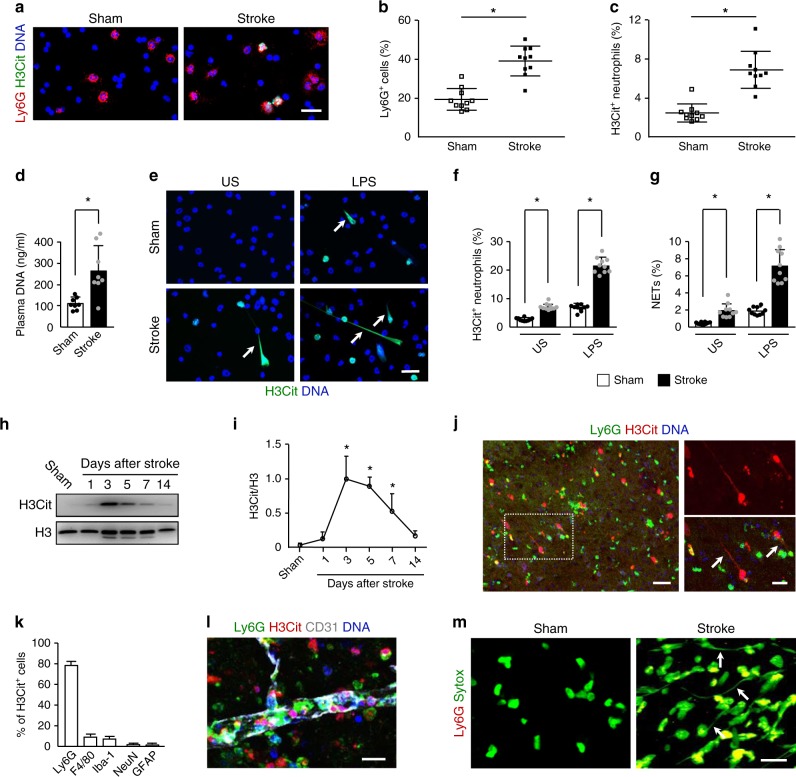
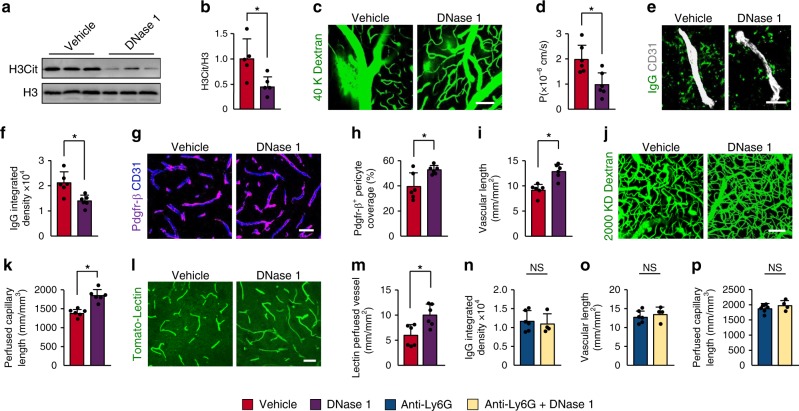
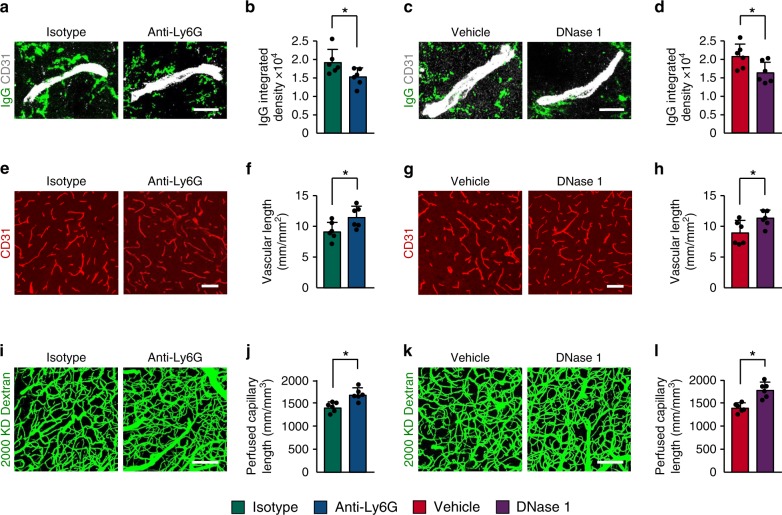
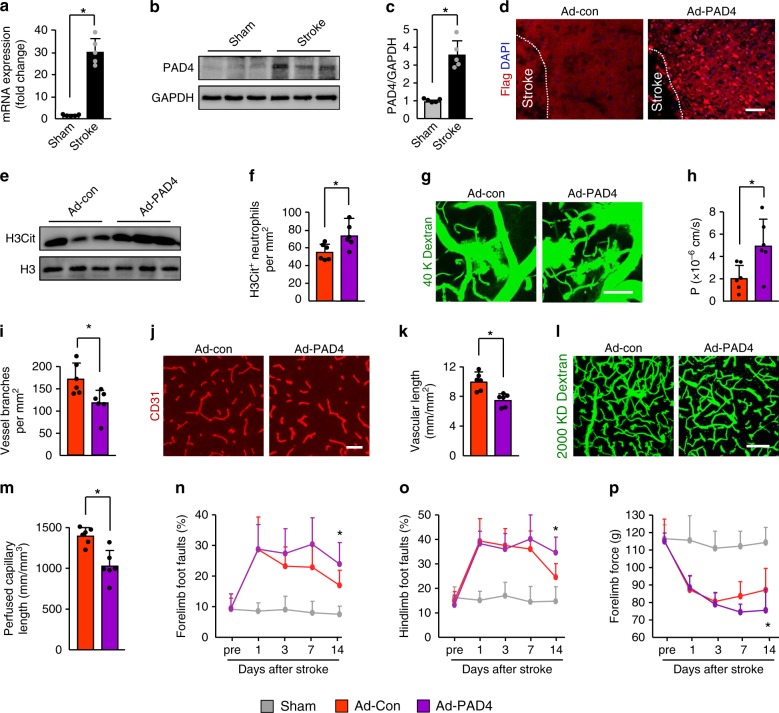
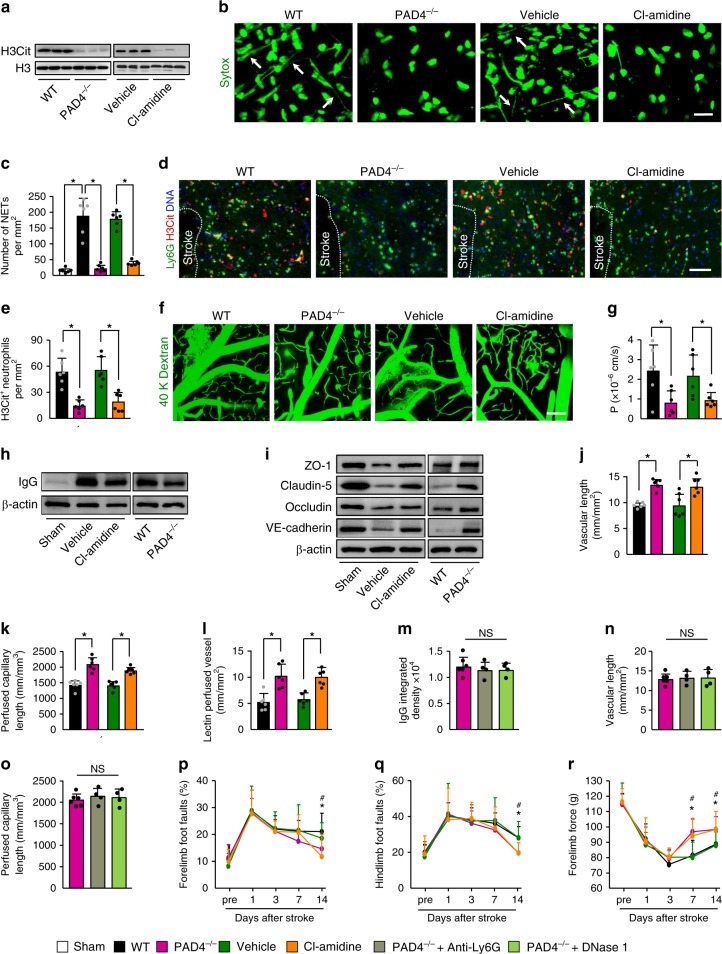
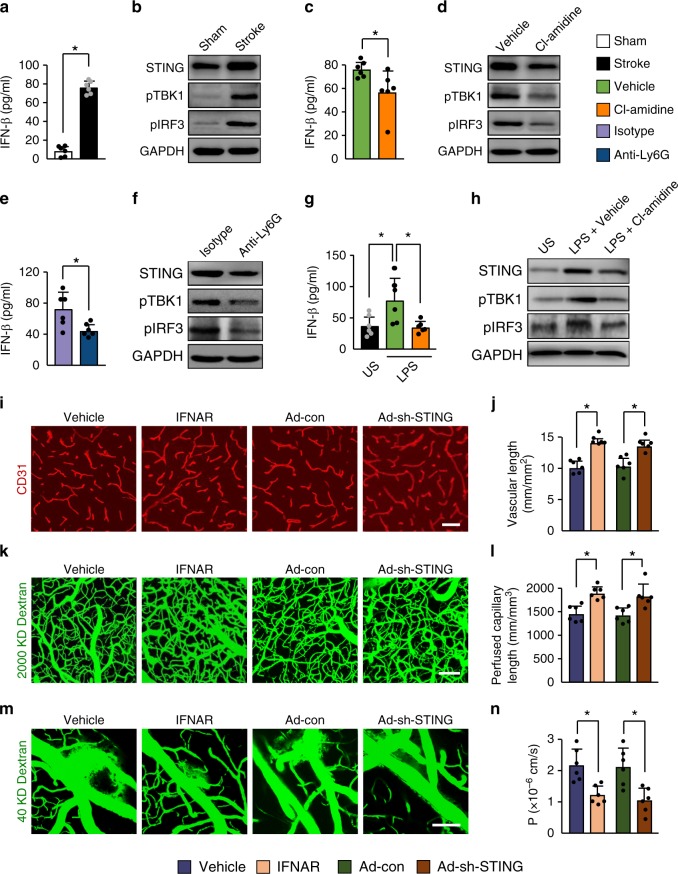
Neovascularization and vascular remodeling are functionally important for brain repair after stroke. We show that neutrophils accumulate in the peri-infarct cortex during all stages of ischemic stroke. Neutrophils producing intravascular and intraparenchymal neutrophil extracellular traps (NETs) peak at 3-5 days. Neutrophil depletion reduces blood-brain barrier (BBB) breakdown and enhances neovascularization at 14 days. Peptidylarginine deiminase 4 (PAD4), an enzyme essential for NET formation, is upregulated in peri-ischemic brains. Overexpression of PAD4 induces an increase in NET formation that is accompanied by reduced neovascularization and increased BBB damage. Disruption of NETs by DNase 1 and inhibition of NET formation by genetic ablation or pharmacologic inhibition of PAD increases neovascularization and vascular repair and improves functional recovery. Furthermore, PAD inhibition reduces stroke-induced STING-mediated production of IFN-β, and STING knockdown and IFN receptor-neutralizing antibody treatment reduces BBB breakdown and increases vascular plasticity. Collectively, our results indicate that NET release impairs vascular remodeling during stroke recovery.


Conflict of interest statement

The authors declare no competing interests.

Figures

Fig. 1
Fig. 1. Neutrophils accumulate in the brain during all stages of ischemic stroke.
a Hematoxylin and eosin-stained coronal section shows the zone (broken blue line) used for measurements of IgG extravasation, capillary length, and in-vivo multiphoton microscopy in the peri-infarct cortical areas. Bar = 1 mm. Independent experiments are repeated at least three times. b, c Representative immunoblots of the time course of neutrophils appearance (b) and quantification of the amount of neutrophil (c) in the peri-infarct cortex of mice subjected to stroke, compared with sham-operated mice (n = 5). One-way ANOVA test was applied with *P < 0.0001 (Sham vs. 1d), *P < 0.0001 (Sham vs. 3d), *P < 0.0001 (Sham vs. 5d), *P = 0.0003 (Sham vs. 7d), *P = 0.0015 (Sham vs. 14d). d Quantification of MPO activity in the brain of mice at 3 days after stroke or sham operation (n = 6), unpaired two-tailed Student’s t-test was applied with *P = 0.0001. e Representative images of Ly6G-positive neutrophils in the peri-infarct cortex of mice at 3 days after stroke, compared with sham-operated mice. Bar = 50 μm. Independent experiments are repeated at least three times. f Representative confocal images of Ly6G-labeled neutrophils (green) and CD31-positive microvessels (white) in the peri-infarct cortex of mice at 3 days. Nuclei were visualized with Hoechst. Neutrophils were observed within brain vessels and migrated into the parenchyma. Bar = 40 μm. Independent experiments are repeated at least three times. g Representative in-vivo multiphoton microscopy images of neutrophils (red) and cerebral angiopathy (green) in the peri-infarct cortex of mice at 3 days. Neutrophils were localized in brain vessels and the parenchyma. Blood vessels (green) were labeled by intravenous injection of FITC-dextran (MW = 2000,000 Da). Neutrophils (red) were labeled by intravenous injection of PE-conjugated monoclonal Ly6G antibody. Bar = 100 µm. Independent experiments are repeated at least three times. h Flow cytometric quantification of neutrophils (CD11b+Ly6G+ cells) in peripheral blood at 3 days after stroke, expressed as percentage of total leukocytes (CD45+ cells) (n = 6), unpaired two-tailed Student’s t-test was applied with *P = 0.0001. Data are presented as mean ± SD. Source data underlying graph bd and h are provided as a Source Data file.
Fig. 2
Fig. 2. Neutrophil depletion reduces BBB breakdown and increases neovascularization after stroke.
a, b Neutrophil and white blood cell counts in peripheral blood at 14 days after stroke in mice treated with control antibody or anti-Ly6G antibody (n = 3), unpaired two-tailed Student’s t-test was applied with *P = 0.0003 (a), *P = 0.012 (b). WBC, white blood cell. c Quantification of the number of neutrophils in the ischemic cortex at 14 days in mice treated with control antibody or anti-Ly6G antibody (n = 6 biologically independent experiments), Mann–Whitney test was applied with *P = 0.0022. d, e Representative in-vivo multiphoton microscopic images of intravenously injected FITC-dextran (MW = 40,000 Da; green) leakage in cortical vessels (d) at 14 days in sham-operated mice and ischemic mice treated with control antibody or anti-Ly6G antibody, and quantification of the permeability (P) product of FITC-dextran for each group (e) (n = 6). One-way ANOVA test was applied with *P = 0.0001 (Sham vs. Isotype), *P = 0.0354 (Isotype vs. Anti-Ly6G). Bar = 100 μm. f, g Representative confocal images (f) and quantitative analysis of IgG extravascular deposits (g) in the peri-infarct cortex at 14 days in sham-operated mice and mice treated with control antibody or anti-Ly6G antibody (n = 6). One-way ANOVA test was applied with *P < 0.0001 (Sham vs. Isotype), *P = 0.0041 (Isotype vs. Anti-Ly6G). Bar = 15 μm. h, j Representative confocal images (h) of CD31-positive microvessels and in-vivo multiphoton microscopy images of perfused cortical capillaries with intravenously injected FITC-dextran (MW = 2000,000 Da) (j) in the peri-infarct cortex at 14 days in mice treated with control antibody or anti-Ly6G antibody, compared with sham-operated mice. Bar = 50 μm (e) and 100 µm (g). i, k Quantification of microvascular density (i) and perfused capillary length (k) for each group (n = 6). One-way ANOVA test was applied with *P = 0.0003 (Sham vs. Isotype (i)) *P = 0.0004 (Isotype vs. Anti-Ly6G (i)), *P = 0.0002 (Isotype vs. Anti-Ly6G (k)). Data are presented as mean ± SD. Source data underlying graph ac, e, g, i, and k are provided as a Source Data file.
Fig. 3
Fig. 3. Neutrophils form NETs presenting in the brain after stroke.
a Representative images of H3Cit (green) and Ly6G (red) double-positive cells in cytospins from sham-operated mice and ischemic mice at 3 days. DNA was visualized with Hoechst 33342 (blue). Bar = 30 μm. b, c Quantification of Ly6G-positive neutrophils in the total leukocyte population (b) and the percentage of H3Cit-positive neutrophils (c) in cytospins (n = 10 biologically independent experiments). Mann–Whitney test was applied with *P < 0.0001 (b), *P < 0.0001 (c). d Levels of plasma DNA were elevated at day 3 after stroke (n = 6 biologically independent experiments). Unpaired two-tailed Student’s t-test was applied with *P = 0.0026. e Representative immunofluorescence images of isolated peripheral blood neutrophils from sham-operated mice and ischemic mice at 3 days. Neutrophils were incubated in the presence or absence of LPS for 2.5 h and stained with Hoechst 33342 (blue) and H3Cit (green). Arrows indicate NETs. US, unstimulated. Bar = 30 μm. f, g Quantification of the percentage of H3Cit-positive neutrophils (f) and NETs (g) in isolated neutrophils (n = 10 biologically independent experiments). One-way ANOVA test was applied with *P < 0.0001 (Sham vs. Stoke in US (f)), *P < 0.0001 (Sham vs. Stoke in LPS group (f)), *P = 0.0235 (Sham vs. Stoke in US (g)), *P < 0.0001 (Sham vs. Stoke in LPS group (f)). US, unstimulated. h, i Representative immunoblots of the time course of NETs appearance (h) and quantification of the H3Cit levels (i) in the peri-infarct cortex of mice subjected to stroke or sham operation (n = 5). One-way ANOVA test was applied with *P < 0.0001 (Sham vs. 3d), *P < 0.0001 (Sham vs. 5d), *P = 0.0039 (Sham vs. 7d). j Representative confocal images showing NET formation in the peri-infarct cortex of mice at 3 days after stroke. Inset is magnified on the right side. Arrows indicate NETs. Bar = 40 μm (left) and 20 μm (right). Arrows indicate extracellular DNA fibers. k Graphs compare the number of H3Cit+Ly6G+ neutrophils, H3Cit+F4/80+ macrophages/microglial cells, H3Cit+Iba1+ microglial cells, H3Cit+NeuN+ neurons, and H3Cit+ GFAP+ astrocytes in mice at 3 days after stroke (n = 5 biologically independent experiments). l Representative confocal image showing the formation of intravascular and intraparenchymal NETs at 3 days after stroke. Bar = 15 μm. Independent experiments are repeated at least three times. m Representative in-vivo multiphoton microscopy images of extracellular DNA (green) and neutrophils in the peri-infarct cortex of mice at 3 days. Extracellular DNA (green) were labeled with intravenous injection of Sytox green and neutrophils (red) with intravenous injection of PE-conjugated monoclonal Ly6G antibody. Arrows indicate extracellular DNA fibers. Bar = 20 µm. Independent experiments are repeated at least three times. Data are presented as mean ± SD. Source data underlying graph bd, fi, and k are provided as a Source Data file.
Fig. 4
Fig. 4. DNase 1 reduces BBB breakdown and increases neovascularization after stroke.
a, b Representative immunoblots (a) and quantification of H3Cit levels (b) in the peri-infarct cortex at 3 days in mice treated with vehicle or DNase 1 (n = 5), unpaired two-tailed Student’s t-test was applied with *P = 0.0228. c Representative images of multiphoton microscopy of intravenously injected FITC-dextran (MW = 40,000 Da; green) leakage in cortical vessels at 14 days after stroke in mice treated with vehicle or DNase 1. Bar = 100 μm. d Quantification of the permeability (P) product of FITC-dextran for each group (n = 6 biologically independent animals), unpaired two-tailed Student’s t-test was applied with *P = 0.0083. e, f Representative images of IgG deposits and CD31-positive microvessels (e) at 14 days after stroke in mice treated with vehicle or DNase 1, and quantification of extravascular IgG deposits (f) for each group (n = 6 biologically independent animals), unpaired two-tailed Student’s t-test was applied with *P = 0.0052. Bar = 20 μm. g, h Representative images (g) and quantitative analysis (h) of Pdgfr-β-positive pericyte coverage on CD31-positive brain capillaries at 14 days (n = 6 biologically independent animals), unpaired two-tailed Student’s t-test was applied with *P = 0.0175. Bar = 40 μm. i Quantification of microvascular length in the peri-infarct cortex at 14 days (n = 6 biologically independent animals), unpaired two-tailed Student’s t-test was applied with *P = 0.0007. j, k In-vivo multiphoton microscopic images of perfused cortical capillaries with intravenously injected FITC-dextran (MW = 2000,000 Da) (j) and quantification of perfused capillary length (k) at 14 days (n = 6 biologically independent animals), unpaired two-tailed Student’s t-test was applied with *P = 0.0003. Bar = 100 μm. l, m Representative images of tomato-lectin perfused vessels (l) and quantification of lectin perfused vessels (m) at 14 days (n = 6), Mann–Whitney test was applied with *P = 0.0152). Bar = 40 μm. np Quantification of extravascular IgG deposits (n), microvascular length (o), and perfused capillary length (p) in the peri-infarct cortex at 14 days (n = 6 for Anti-Ly6G, n = 4 for Anti-Ly6G + DNase 1), unpaired two-tailed Student’s t-test was applied with P = 0.6496 (n), P = 0.5222 (o), P = 0.2844 (p). Data are presented as mean ± SD. Source data underlying graph a, b, d, f, h, i, k, and mp are provided as a Source Data file.
Fig. 5
Fig. 5. Increased vascular remodeling by delayed inhibition of NET formation.
ad Representative confocal images (a, c) and quantitative analysis of IgG extravascular deposits (b, d) in the peri-infarct cortex at 14 days. Mice were subjected to stroke and treated with either anti-Ly6G antibody, control antibody, DNase 1, or vehicle starting at 7 days (n = 6), unpaired two-tailed Student’s t-test was applied with *P = 0.0392 (b), *P = 0.0384 (d). Bar = 10 μm. el Representative confocal images (e, g) of CD31-positive microvessels and in-vivo multiphoton microscopy images of perfused cortical capillaries with intravenously injected FITC-dextran (i, k) in the peri-infarct cortex at 14 days in mice treated with either anti-Ly6G antibody, control antibody, DNase 1, or vehicle. Bar = 40 μm (e, g) and 100 µm (i, k). Quantification of microvascular density (f, h) and perfused capillary length (j, l) for each group (n = 6), unpaired two-tailed Student’s t-test was applied with *P = 0.00378 (f), *P = 0.0364 (h), *P = 0.0026 (j), *P = 0.0006 (l). Data are presented as mean ± SD. Source data underlying graph b, d, f, h, j, and l are provided as a Source Data file.
Fig. 6
Fig. 6. Overexpression of PAD4 exacerbates BBB breakdown and reduced revascularization.
a PAD4 mRNA expression was measured by quantitative real-time PCR in the peri-infarct cortex at 3 days, compared with sham-operated mice (n = 5); Mann–Whitney test was applied with *P = 0.0079. b, c Representative immunoblots (b) and quantification of PAD4 levels (c) in the peri-infarct cortex at 4 days after injection of control (Ad-Con) or PAD4 adenovirus (Ad-PAD4) (n = 5); Mann–Whitney test was applied with *P = 0.0079). d Representative images of recombinant Adeno-PAD4-flag-infected cells in the ischemic cortex. Mice were treated with recombinant Adeno-PAD4-flag (right panel) or empty adenovirus (left panel). At 4 days after injection, brain sections were stained with an antibody against Flag. Bar = 40 μm. e Representative immunoblots of H3Cit levels in the peri-infarct cortex at 3 days. f Quantification of the numbers of H3Cit-positive neutrophils in the peri-infarct cortex at 4 days after injection of control or PAD4 adenovirus (n = 6); unpaired two-tailed Student’s t-test was applied with *P = 0.0230. g In-vivo multiphoton microscopic images of intravenously injected FITC-dextran (MW = 40,000 Da; green) leakage in cortical vessels at 14 days. Bar = 100 μm. h Quantification of the permeability (P) product of FITC-dextran for each group (n = 6); unpaired two-tailed Student’s t-test was applied with *P = 0.0244. i Quantification of vascular branches in mice treated with control or PAD4 adenovirus at 14 days after stroke (n = 6), unpaired two-tailed Student’s t-test was applied with *P = 0.0170. j, k Confocal images of CD31-positive microvessels (j) and quantification of microvascular density (k) in the peri-infarct cortex at 14 days (n = 6), unpaired two-tailed Student’s t-test was applied with *P = 0.0019. Bar = 50 μm. l, m In-vivo multiphoton microscopic images of perfused cortical capillaries with intravenously injected FITC-dextran (l) and quantification of perfused capillary length (m) at 14 days after stroke (n = 6), unpaired two-tailed Student’s t-test was applied with *P = 0.0017. Bar = 100 μm. np Overexpression of PAD4 worsened neurological outcomes in beam walking test (n, o) and forelimb force test (p) (n = 10). One-way ANOVA test was applied with *P = 0.001 (n), *P = 0.0015 (o), *P < 0.0001 (p) (Sham and Ad-Con). *P = 0.0015 (n), *P = 0.0015 (o), *P = 0.0279 (p) (Ad-Con and. Ad-PAD4). Data are presented as mean ± SD. Source data underlying graph ac, e, f, h, i, k, mp are provided as a Source Data file.
Fig. 7
Fig. 7. PAD4 deficiency or pharmacologic inhibition promotes vascular remodeling after stroke.
a Representative immunoblots of H3Cit levels in the peri-infarct cortex at 3 days in WT and PAD4−/− mice, and WT mice treated with vehicle or the PAD inhibitor Cl-amidine. Independent experiments are repeated at least three times. b In-vivo multiphoton microscopic images of extracellular DNA (Sytox, green) in the peri-infarct cortex of mice at 3 days after stroke. Arrows indicate extracellular DNA fibers. Bar = 20 µm. Independent experiments are repeated at least three times. c Quantification of NETs for each group (n = 6). One-way ANOVA test was applied with *P < 0.0001 (Same vs. WT stroke), *P < 0.0001 (WT vs. PAD4−/−), *P < 0.0001 (Vehicle vs. Cl-amidine). d Representative confocal images of neutrophil (Ly6G, green) and H3Cit (red) immunostaining in the peri-infarct cortex at 3 days. DNA was stained with Hoechst 33342 (blue). Bar = 40 μm. e Quantification of the numbers of H3Cit-positive neutrophils in the peri-infarct cortex at 3 days in WT and PAD4−/− mice, and WT mice treated with vehicle or the PAD inhibitor Cl-amidine (n = 6), unpaired two-tailed Student’s t-test was applied with *P = 0.0002 (WT vs. PAD4−/−), *P = 0.0010 (Vehicle vs. Cl-amidine). f, g In-vivo multiphoton microscopic images (f) of intravenously injected FITC-dextran leakage in cortical vessels at 14 days and quantification of the permeability (P) product of FITC-dextran (g) for each group (n = 6), unpaired two-tailed Student’s t-test was applied with *P = 0.0197 (WT vs. PAD4−/−), *P = 0.0260 (Vehicle vs. Cl-amidine). Bar = 100 μm. h Representative immunoblots of IgG levels in capillary-depletion brain tissue at 14 days in WT and PAD4−/− mice, and WT mice treated with vehicle or Cl-amidine. Independent experiments are repeated at least three times. i Representative immunoblots of the tight-junction protein ZO-1, claudin-5, and occludin, and the adherens junction protein VE-cadherin in isolated brain microvessels at 14 days. Independent experiments are repeated at least three times. jl Quantification of microvascular density (j), perfused capillary length (k), and tomato-lectin perfused vessels (l) in the peri-infarct cortex at 14 days (n = 6). Unpaired two-tailed Student’s t-test was applied with *P < 0.0001 (WT vs. PAD4−/− (j)), *P = 0.0093 (Vehicle vs. Cl-amidine (j)), *P = 0.0001 (WT vs. PAD4−/− (k)), *P < 0.0001 (Vehicle vs. Cl-amidine (k)) *P = 0.0015 (WT vs PAD4−/− (l)), *P = 0.0013 (Vehicle vs. Cl-amidine (l)). mo Quantification of extravascular IgG deposits (m), microvascular length (n), and perfused capillary length (o) in the peri-infarct cortex at 14 days after stroke (n = 6 for PAD4−/−, n = 4 for PAD4−/− + Anti-Ly6G and PAD4−/− + DNase 1). One-way ANOVA test was applied with P = 0.7263 (m), P = 0.9547 (n), P = 0.7304 (o). pr PAD4 deficiency or Cl-amidine treatment improved neurological functions in beam walking test (p, q) and forelimb force test (r) (n = 10). One-way ANOVA test was applied with *P = 0.0407 (p), *P = 0.0056 (q), *P = 0.0013 (7d (r)) and *P = 0.0172 (14d (r)) (PAD4−/− and WT), #P = 0.0439 (p) and #P = 0.0210 (q), #P = 0.0091 (7d (r)) and #P = 0.0394 (14d (r)) (Cl-amidine and vehicle). Data are presented as mean ± SD. Source data underlying graph a, c, e, and gr are provided as a Source Data file.
Fig. 8
Fig. 8. STING-mediated effects on vascular remodeling are due to NETs.
a Levels of IFN-β were increased in the ischemic cortex at 3 days, compared with sham-operated brains (n = 6), unpaired two-tailed Student’s t-test was applied with *P < 0.0001. b Immunoblot analysis of STING, phosphorylated TBK1 (pTBK1), and pIRF3 in the cortex of mice without stroke or at day 3 after stroke. c Levels of IFN-β in the ischemic cortex at 3 days in mice treated with control or the PAD inhibitor Cl-amidine (n = 6). Mann–Whitney test was applied with *P = 0.0152. d Immunoblot analysis of STING, pTBK1, and pIRF3 in the ischemic cortex at day 3. e Levels of IFN-β in the ischemic cortex at 3 days in mice treated with control antibody or anti-Ly6G antibody (n = 6), unpaired two-tailed Student’s t-test was applied with *P = 0.0148. f Immunoblot analysis of STING, pTBK1, and pIRF3 in the ischemic cortex at day 3. g Levels of IFN-β in isolated bone marrow neutrophils from ischemic mice. Neutrophils were stimulated with LPS in the presence or absence of the PAD inhibitor Cl-amidine (n = 6). One-way ANOVA test was applied with *P = 0.0230 (Stoke vs. Vehicle), *P = 0.0160 (Vehicle vs. Cl-amidine). US, unstimulated. h Immunoblot analysis of STING, pTBK1, and pIRF3 in isolated neutrophils for each group (n = 5). i, j Confocal images of CD31-positive microvessels (i) and quantification of microvascular density (j) in the peri-infarct cortex at 14 days in mice treated with control IgG or IFNAR-neutralizing antibody, and STING shRNA or control adenovirus (n = 6), unpaired two-tailed Student’s t-test was applied with *P < 0.0001 (Vehicle vs. IFNAR), *P = 0.0007 (Ad-con vs. Ad-sh-STING). Bar = 40 μm. k, l In-vivo multiphoton microscopic images of perfused cortical capillaries with intravenously injected FITC-dextran (k) and quantification of perfused capillary length (l) at 14 days after stroke (n = 6), unpaired two-tailed Student’s t-test was applied with *P = 0.0006 (Vehicle vs. IFNAR), *P = 0.0080 (Ad-con vs. Ad-sh-STING). Bar = 100 μm. m, n In-vivo multiphoton microscopic images (m) of intravenously injected FITC-dextran leakage in cortical vessels at 14 days and quantification of the permeability (P) product of FITC-dextran (n) for each group (n = 6), unpaired two-tailed Student’s t-test was applied with *P = 0.0028 (Vehicle vs. IFNAR), *P = 0.0053 (Ad-con vs. Ad-sh-STING). Bar = 100 μm. Data are presented as mean ± SD. Source data underlying graph ah, j, l, and n are provided as a Source Data file.

Similar articles

Cited by

References

    1. Zhou M, et al. Cause-specific mortality for 240 causes in china during 1990–2013: A systematic subnational analysis for the global burden of disease study 2013. Lancet. 2016;387:251–272. doi: 10.1016/S0140-6736(15)00551-6. - DOI - PubMed
    1. Horie N, et al. Transplanted stem cell-secreted vascular endothelial growth factor effects poststroke recovery, inflammation, and vascular repair. Stem Cells. 2011;29:274–285. doi: 10.1002/stem.584. - DOI - PMC - PubMed
    1. Zhang ZG, Chopp M. Neurorestorative therapies for stroke: Underlying mechanisms and translation to the clinic. Lancet Neurol. 2009;8:491–500. doi: 10.1016/S1474-4422(09)70061-4. - DOI - PMC - PubMed
    1. Ohab JJ, Fleming S, Blesch A, Carmichael ST. A neurovascular niche for neurogenesis after stroke. J. Neurosci. 2006;26:13007–13016. doi: 10.1523/JNEUROSCI.4323-06.2006. - DOI - PMC - PubMed
    1. Borregaard N. Neutrophils, from marrow to microbes. Immunity. 2010;33:657–670. doi: 10.1016/j.immuni.2010.11.011. - DOI - PubMed

Publication types

MeSH terms