. 2020 May 19;10(1):8242.
doi: 10.1038/s41598-020-64803-w.

Evaluating White Matter Lesion Segmentations with Refined Sørensen-Dice Analysis

Affiliations

Evaluating White Matter Lesion Segmentations with Refined Sørensen-Dice Analysis

Aaron Carass et al. Sci Rep. .

Abstract

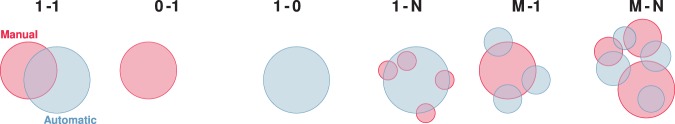
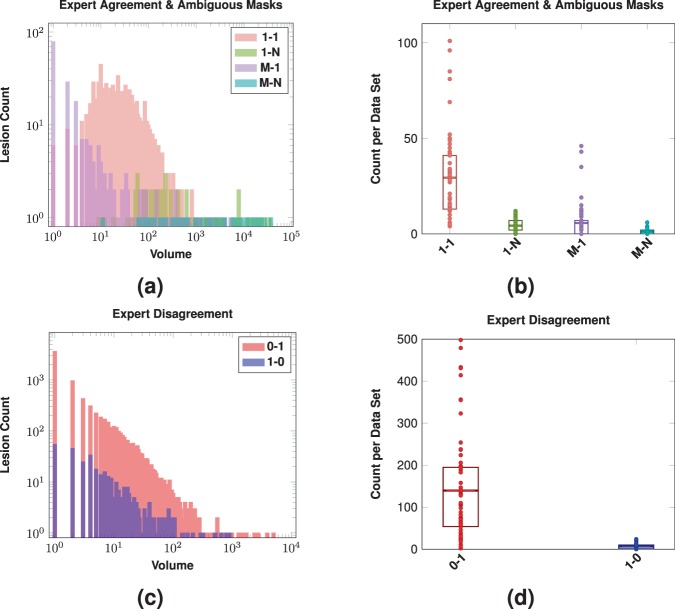
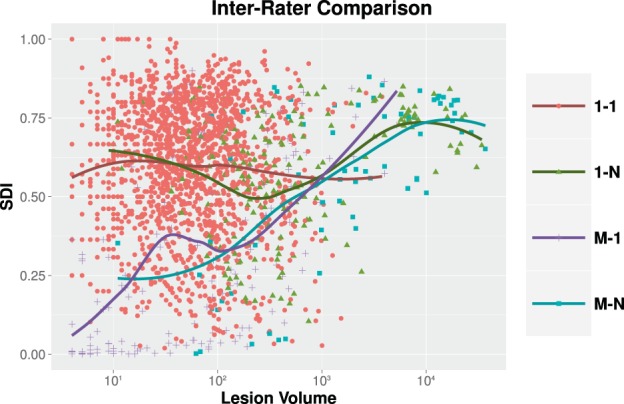
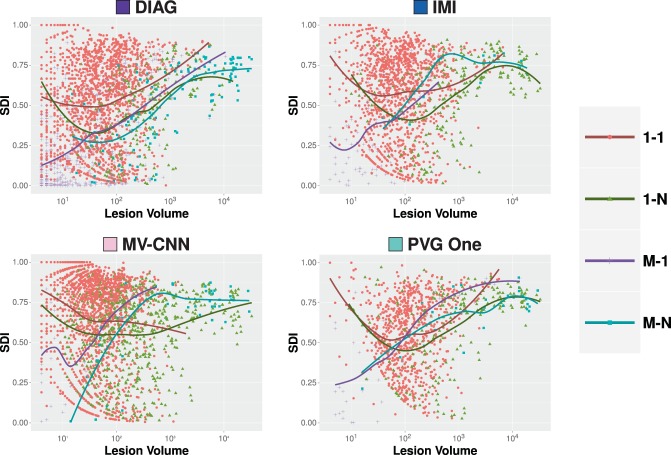
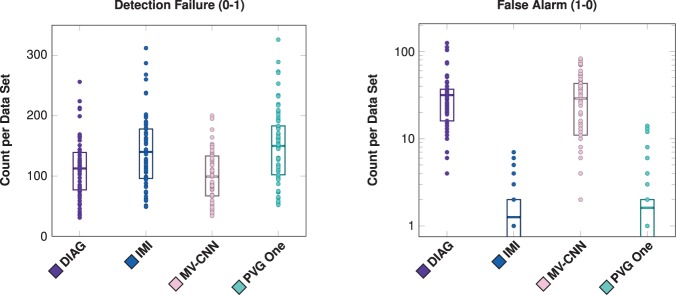
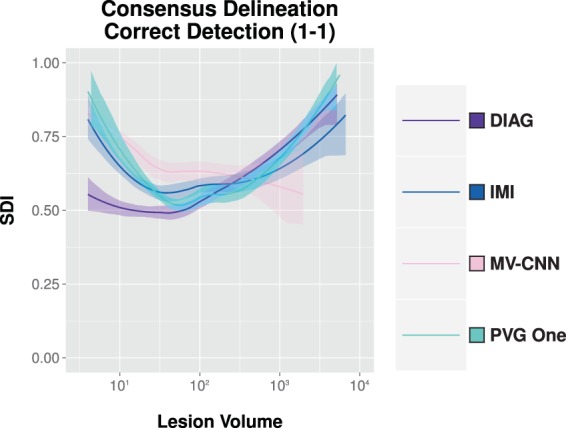
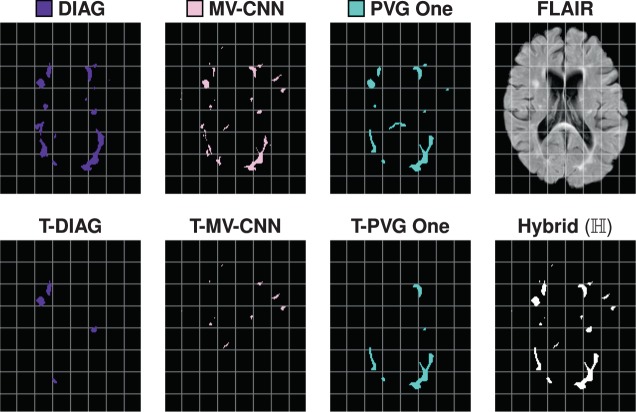
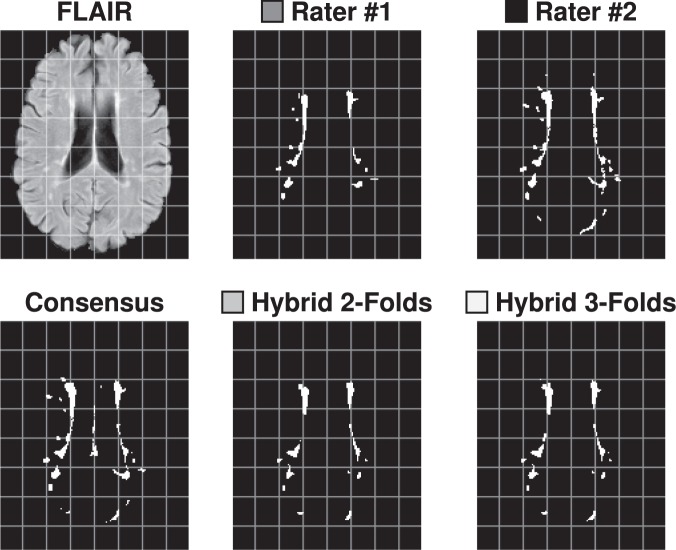
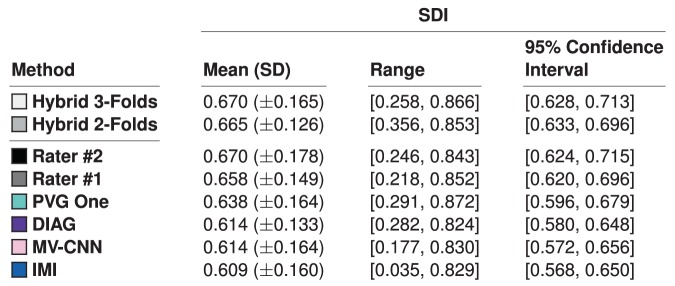
The Sørensen-Dice index (SDI) is a widely used measure for evaluating medical image segmentation algorithms. It offers a standardized measure of segmentation accuracy which has proven useful. However, it offers diminishing insight when the number of objects is unknown, such as in white matter lesion segmentation of multiple sclerosis (MS) patients. We present a refinement for finer grained parsing of SDI results in situations where the number of objects is unknown. We explore these ideas with two case studies showing what can be learned from our two presented studies. Our first study explores an inter-rater comparison, showing that smaller lesions cannot be reliably identified. In our second case study, we demonstrate fusing multiple MS lesion segmentation algorithms based on the insights into the algorithms provided by our analysis to generate a segmentation that exhibits improved performance. This work demonstrates the wealth of information that can be learned from refined analysis of medical image segmentations.


Conflict of interest statement

All undersigned authors certify that they have NO affiliations with or involvement in any organization or entity with any financial interest (such as honoraria; educational grants; participation in speakers’ bureaus; membership, employment, consultancies, stock ownership, or other equity interest; and expert testimony or patent-licensing arrangements), or non-financial interest (such as personal or professional relationships, affiliations, knowledge or beliefs) in the subject matter or materials discussed in this manuscript. A.C., S.R., A.D., J.C.R., A.J., T.A., O.M., H.H., M.G., B.P., A.B., H.G., D.L.P., C.M.C., W.R.G.R. and I.O. The following authors have declarations: – PAC has received personal consulting fees for serving on SABs for Biogen and Disarm Therapeutics. He is PI on grants to JHU from Biogen, Novartis, Sanofi, Annexon, and MedImmune. – JLP is PI on grants to JHU from Biogen. – RTS has received personal consulting fees from Genentech/Roche.

Figures

Figure 1
Figure 1
Illustrated from left to right are examples of the six classes for the Nascimento nomenclature; the leftmost panel is the case of “Correct Detection” also known as 1-1 correspondence between the manual segmentation and the automated segmentation. The next two cases are “Detection Failure” or 0-1 correspondence, were there is a manual segmentation but no overlapping object in the automated segmentation, and “False Alarm” or 1-0 correspondence. The next three cases are the object detection classes known as “Merge”, “Split”, and “Split-Merge”. The 1-N or “Merge” case occurs when the automated segmentation has merged the multiple objects from the manual segmentation into a single object. Next is M-1, “Split”, in which a single manually segmented object has been split into multiple objects by the automated approach. Finally, on the right, M-N, are multiple manually segmented objects split and merged by the automated segmentation.
Figure 2
Figure 2
Shown are the (a) MPRAGE, (b) FLAIR, (c) T2-w, and (d) PD-w images for a single time-point from one of the provided Training data set subjects after the preprocessing described in Section 3.2.
Figure 3
Figure 3
Shown is an axial slice of the (a) FLAIR for a single time-point from one of the Test data set subjects, and the corresponding mask by (b) Rater #1, (c) Rater #2, and the (d) Consensus Delineation.
Figure 4
Figure 4
Mean, standard deviation (SD), and range of the SDI against the Consensus Delineation for the two human raters and the top four algorithms (as ranked by their SDI). We also include the 95% confidence interval of the mean SDI.
Figure 5
Figure 5
Shown in (a) are log-scale histograms depicting the Expert Agreement and Ambiguous Masks for our inter-rater comparison. The histograms show the volume (x-axis) and the count of lesions (y-axis) of that size. The volume of the lesions is the volume assigned by Rater #2. The Expert Agreement case (1-1) shows those lesions that had a one-to-one correspondence between lesions identified by Rater #1 and #2. The Ambiguous Masks classes (1-N, M-1, and M-N) are also shown. Shown in (b) are the counts on a per data set basis for the four different Expert Agreement and Ambiguous Masks cases; a dot denotes the respective count for one of the 61 test data sets, the rectangles represent the inter quartile range (IQR), and the horizontal bars are the means. Shown in (c) are log-scale histograms depicting the two Expert Disagreement cases for our inter-rater comparison. The histograms show the volume (x-axis) and the count of lesions (y-axis) of that size that were identified by Rater #1 but not Rater #2 (1-0) or identified by Rater #2 but not Rater #1 (0-1). The volumes come from the rater that identified the lesion. Shown in (d) are the counts on a per data set basis for the two different Expert Disagreement cases; a dot denotes the respective count for one of the 61 test data sets, the rectangles represent the IQR, and the horizontal bars are the means.
Figure 6
Figure 6
For our inter-rater comparison, we show per-lesion SDI for the expert agreement cases as a function of the lesion volume (color coded by lesion classification). The volume of the lesions is the volume assigned by Rater #2. For each category, the dots are individual lesions and the solid lines are a LOESS best fit,.
Figure 7
Figure 7
For our four comparison algorithms, we show per-lesion SDI against the Consensus Delineation as a function of the lesion volume (color coded by lesion classification). For each category, the dots are individual lesions and the solid lines are best fits based on LOESS,.
Figure 8
Figure 8
Shown for all four comparison algorithms (DIAG, IMI, MV-CNN, and PVG One) are the number of detection failures and false alarms (shown with a log scale) on a per data set basis. For each plot, a dot denotes the respective count for one of the 61 test data sets, the rectangles represent the inter quartile range (IQR), and the horizontal bars are the means. When the IQR reaches the bottom of the graph it extends to zero.
Figure 9
Figure 9
Shown are heat-maps (with grid lines) for the lesions in particular classes. The top row shows the correct detection class for the four comparison algorithms and the bottom row shows the detection failure class.
Figure 10
Figure 10
Shown are the axial maximum intensity projections (with grid lines) of the heat-maps for the correct detection class (top row) and the detection failure class (bottom row).
Figure 11
Figure 11
Shown are the regression curves for the correct detection class for each of DIAG, IMI, MV-CNN, and PVG One. Also shown is the 95% confidence band around each regression.
Figure 12
Figure 12
For a test data set, in the top row, we show the axial slices of the DIAG, MV-CNN, and PVG One segmentations, and the corresponding FLAIR image. In the second row, we show the volume thresholded version of DIAG (T-DIAG), MV-CNN (T-MV-CNN), and PVG One (T-PVG One), after the corresponding thresholds have been applied from the 2-Fold variety of our hybrid algorithm. The final image in the second row is the segmentation generated from the union of these results and is denoted Hybrid (). For this subject, the IMI algorithm did not contribute any lesions and the corresponding images are not displayed.
Figure 13
Figure 13
Shown on the top row are an axial slice of the FLAIR image for a subject from the Test data set, and the corresponding segmentations by Rater #1, Rater #2. On the bottom row are the corresponding slices for the Consensus Delineation (labeled Consensus) and the hybrid algorithm with 2-folds (labeled Hybrid 2-Folds) and with 3-folds (labeled Hybrid 3-Folds).
Figure 14
Figure 14
Mean, standard deviation (SD), and range of the SDI overlap scores against the Consensus Delineation for Hybrid, with cross-validation using two- and three-folds are shown in the top two rows. We also show the 95% confidence interval of the mean SDI. Hybrid 2-Folds is based on a two-fold cross validation from the results of DIAG, IMI, MV-CNN, and PVG One; Hybrid 3-Folds is the three-fold cross validation result from the same data. We train on (n1)-folds and test on the n-fold; repeating this process by cycling through the various folds, with the combined results presented.

References

    1. Zheng, K. Content-based image retrieval for medical image. In 2015 11th International Conference on Computational Intelligence and Security (CIS), 219–222 (2015).
    1. Menze BH, et al. The Multimodal Brain Tumor Image Segmentation Benchmark (BRATS) IEEE Trans. Med. Imag. 2015;34:1993–2024. doi: 10.1109/TMI.2014.2377694. - DOI - PMC - PubMed
    1. Yang, Z. et al. Automatic Cell Segmentation in Fluorescence Images of Confluent Cell Monolayers Using Multi-object Geometric Deformable Model. In Proceedings of SPIE Medical Imaging (SPIE-MI 2013), Orlando, FL, February 9–14, 2013, vol. 8669, 866904–8 (2013). - PMC - PubMed
    1. Juang, R. R., Levchenko, A. & Burlina, P. Tracking cell motion using GM-PHD. In 6thInternational Symposium on Biomedical Imaging (ISBI 2009), 1154–1157 (2009).
    1. Glaister J, et al. Thalamus Segmentation using Multi-Modal Feature Classification: Validation and Pilot Study of an Age-Matched Cohort. NeuroImage. 2017;158:430–440. doi: 10.1016/j.neuroimage.2017.06.047. - DOI - PMC - PubMed

Publication types