. 2020 May 19;11(1):2485.
doi: 10.1038/s41467-020-16239-z.

Dissecting the cellular specificity of smoking effects and reconstructing lineages in the human airway epithelium

Affiliations

Dissecting the cellular specificity of smoking effects and reconstructing lineages in the human airway epithelium

Katherine C Goldfarbmuren et al. Nat Commun. .

Abstract

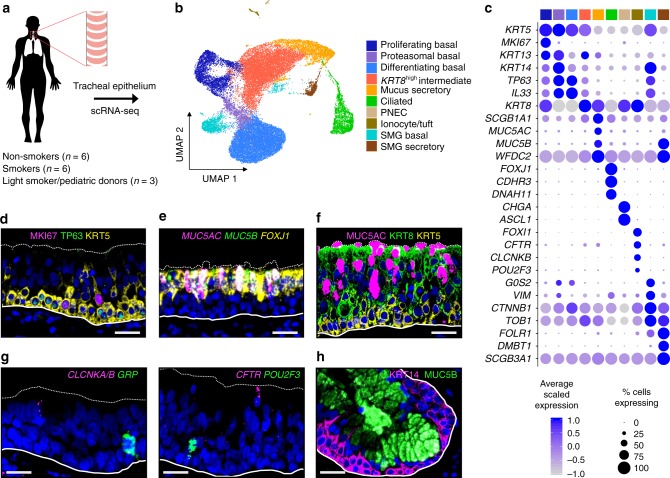
Cigarette smoke first interacts with the lung through the cellularly diverse airway epithelium and goes on to drive development of most chronic lung diseases. Here, through single cell RNA-sequencing analysis of the tracheal epithelium from smokers and non-smokers, we generate a comprehensive atlas of epithelial cell types and states, connect these into lineages, and define cell-specific responses to smoking. Our analysis infers multi-state lineages that develop into surface mucus secretory and ciliated cells and then contrasts these to the unique specification of submucosal gland (SMG) cells. Accompanying knockout studies reveal that tuft-like cells are the likely progenitor of both pulmonary neuroendocrine cells and CFTR-rich ionocytes. Our smoking analysis finds that all cell types, including protected stem and SMG populations, are affected by smoking through both pan-epithelial smoking response networks and hundreds of cell-specific response genes, redefining the penetrance and cellular specificity of smoking effects on the human airway epithelium.


Conflict of interest statement

The authors have no competing interests.

Figures

Fig. 1
Fig. 1. Single-cell RNA-seq reveals broad cellular diversity within the human tracheal epithelium.
a Study design for scRNA-seq of human tracheal epithelium. b UMAP visualization of cells in the human trachea depicts unsupervised clusters defining broad cell types present. c Dot plot highlights markers distinguishing broad cell categories based on average expression level (color) and ubiquity (size). Colored bar corresponds to the cell types/states in b. d Immunofluorescence (IF) labeling of human tracheal sections shows MKI67 (magenta) and TP63 (green) in a subset of KRT5high (yellow) basal cells. Scale bar = 25 μm. DAPI labeling of nuclei (blue). Dashed and solid lines represent the apical edge and basement membrane of the epithelium, respectively. e Fluorescence in situ hybridization (FISH) co-localizes (seen as white) MUC5B (green) and MUC5AC (magenta) mRNA to non-ciliated cells. FOXJ1 (ciliated marker, yellow). Dashed, solid lines and scale bar as in d. f IF labeling localizes KRT8 (green) to mid-upper epithelium, MUC5AC (magenta), KRT5 (yellow). Dashed, solid lines, and scale bar as in d. g FISH distinguishes rare cell mRNA markers: left, PNECs (GRP, green) and ionocytes (CLCNKA/B, magenta); right, ionocytes (CFTR, magenta) and tuft-like cells (POU2F3, green). Dashed, solid lines, and scale bars as in d. h IF labeling localizes MUC5B (green) and KRT14 (magenta) to distinct cells in the SMGs. Dashed, solid lines, and scale bar as in d. See also Supplementary Figs. 1 and 2.
Fig. 2
Fig. 2. Smoking induces both shared and unique responses across cell types that decrease functional diversity of the epithelium.
a Schematic Venn diagram summarizes core and unique smoking responses across eight broad cell populations, with number of upregulated and downregulated genes unique to populations given in the tips and number of core genes affected in ≥5 populations in the center. Note degree of overlap in the diagram is not proportional to gene overlap for readability. Detailed percentages in Supplementary Fig. 3b. b Denoted key pathways and genes comprising the core upregulated and downregulated smoking response. c Relative proportions of broad cell populations shift with prolonged smoke exposure. Average and standard error of percent shift in proportion are shown for smokers (n = 6) relative to non-smokers (n = 6). Points show percent shifts for each individual smoker donor relative to the mean proportion across non-smokers. d Enrichment of cell-type signature genes from non-smokers (rows) in core and non-core smoking response genes for each of the broad cell populations (columns), based on hypergeometric tests. Color of box depicts scaled level of enrichment (−log10 of FDR-adjusted p-value), black outline of box indicates significant enrichment at FDR < 0.05. See also Supplementary Figs. 3 and 4.
Fig. 3
Fig. 3. In vivo secretory cells form a continuous lineage and exhibit MUC5AC-correlated smoking effects.
a Heat map of smoothed expression across a Monocle-inferred lineage trajectory shows transitions in transcriptional programs that underlie differentiation in the in vivo human airway epithelium, from basal-like pre-secretory (KRT8high) cells into mucus secretory cells. Select genes that represent these programs are shown, all significantly correlated with pseudotime. Key enrichment pathways and genes belonging to each block are indicated at right. b Scaled, smoothed expression of select transcriptional regulators (colored lines) and canonical markers (black dashed/solid lines) across pseudotime differentiation of human tracheal secretory cells in vivo. The x axis corresponds to the x-axis in a. c Pie chart depicts proportions of mature mucus secretory cells exhibiting different MUC5AC and MUC5B mucin co-expression profiles. d Co-expression of common secretory markers at the mRNA level (left, FISH with SCGB1A1 in magenta, MUC5B in green) and protein level (right, IF labeling with MUC5AC in magenta, MUC5B in green and KRT5 in yellow). In both images, overlaid magenta/green appears as white. Dashed and solid lines represent the apical edge and basement membrane of the epithelium, respectively. Scale bar = 25 μm. e Smoking-independent correlation coefficients of MUC5B-correlated and MUC5AC-correlated genes. Genes are colored based on whether they were significantly correlated with only MUC5B (green), only MUC5AC (blue), or both (orange). Only the strongest correlations are plotted (correlations > 0.15), select genes are labeled. f Box plots illustrate the converse effects of smoking on the mean expression of the top 25 MUC5B- and MUC5AC-specific correlated genes in mature mucus secretory cells (n = 713 non-smoker cells, n = 886 smoker cells). Box centers give the median, upper and lower box bounds correspond to first and third quartiles, and the upper/lower whiskers extend from the upper/lower bounds up to/down from the largest/smallest value, no further than 1.5× IQR from the upper/lower bound (where IQR is the inter-quartile range). Data beyond the end of whiskers are plotted individually. p-values are from one-sided Wilcoxon tests. See also Supplementary Fig. 5.
Fig. 4
Fig. 4. Specialized SMG mucus secretory cells are predicted to derive from SMG basal stem cells and both are modified by smoking.
a Heat map depicts select genes, functional terms and TFs that distinguish surface and SMG secretory cells. Detailed heat map in Supplementary Fig. 6b. b Box plots of normalized mucin expression across surface mature mucus secretory (yellow, n = 1858 cells), SMG mucus secretory (brown, n = 633 cells) and non-secretory cells (gray, n = 32,589 cells). Box centers give the median, upper and lower box bounds correspond to first and third quartiles, and the upper/lower whiskers extend from the upper/lower bounds up to/down from the largest/smallest value, no further than 1.5× IQR from the upper/lower bound (where IQR is the inter-quartile range). Data beyond the end of whiskers are plotted individually. Median fold-change between surface and SMG secretory cells is indicated. c Pie chart depicts proportions of SMG secretory cells exhibiting different MUC5AC and MUC5B mucin co-expression profiles. d UMAP of SNN subclustering for SMG cells. e Dot plot showing the expression of markers that unite and distinguish SMG basal cell substates (peach underlay), relative to surface populations, SMG secretory cells, and each other. f Scaled, smoothed expression of key genes and regulators across a pseudotime trajectory that models the differentiation process of SMG cells. A minimum spanning tree of the trajectory can be found in Supplementary Fig. 6g. g IF labeling illustrates myoepithelial cells (ACTA2+, magenta) transitioning to SMG basal cells (KRT5+, green), where overlaid magenta/green appear white. Example myoepithelial (magenta arrows), SMG basal (green arrow), and transitioning (white arrow) cells are highlighted. DMBT1 is in yellow and scale bar = 50 μm. See also Supplementary Fig. 6.
Fig. 5
Fig. 5. Sequential transcriptional programs drive motile ciliogenesis.
a Histological overview of human basal cell ALI mucociliary differentiation. Image outlines: shades of black = submerged culture, shades of blue to red = polarized differentiation and maintenance of ALI human epithelial cell culture. Representative brightfield or H&E stained images of indicated timepoints are shown, scale bars in far left panels are both 50 μm. b tSNE plot depicts the distribution of inferred clusters of in vitro cells transcriptionally sampled from across the entire differentiation time course. Cluster identities based on expressed markers are shown at the right. Ciliated cell clusters are boxed. c Proportion of cells in each cell state (corresponding to clusters in b) present at each timepoint over differentiation. Time course black/blue/red gradient coloring at bottom corresponds to colors in a. d Heat map depicts gene signatures of three ciliated cell states (function summarized in schematic above) in human airway epithelial ALI cultures sampled across differentiation. Genes plotted were those with known ciliogenic function that were characteristic of one of the three states, as indicated. e Similarities and differences in transcriptional programs between distinct pseudotime lineages constructed with Slingshot that lead to mature secretory and ciliated cells in vitro. Select markers or genes correlated with pseudotime are indicated. f Dot plots reveal TFs exhibiting expression associated with ciliated states in vitro. g Heat map illustrates differences in proportions of spliced or unspliced transcripts for a given gene (one per row) between later ciliating and mature ciliated cells that exhibit non-zero expression for the gene. mRNA splice status was inferred using the Velocyto pipeline. Genes listed are cilia-related genes with non-zero expression (ignoring splicing) in at least 10% of cells for at least one of the later ciliating or mature ciliated cell populations. See Supplementary Fig. 7.
Fig. 6
Fig. 6. Smoking inhibits the early ciliating state.
a Wholemount IF labeling of FOXN4 KO in human tracheal ALI cultures. Arrows, immature (white) and mature ciliated cells (yellow). Scale bar = 25 μm. b Sample axonemal phenotypes by acetylated α-Tubulin IF labeling (white). Arrows, FOXN4 KO cells displaying absent (white), short or sparse (yellow), or bulging (orange) axonemes were classified immature; dense, well-formed axonemes (blue) were classified mature. Scale bar = 25 μm. c Quantified fraction of mature and immature ciliated cells from control (n = 584) and FOXN4 KO cultures (n = 854) in b. Bar plots: mean fractions ± standard error (n = 5 confocal fields); points: fraction for each field. d Wholemount IF labeling of FOXN4 KO illustrates basal bodies are generated (γ-Tubulin, green), but fail to dock (white arrows) and deuterosomes are assembled (DEUP1, red), but retained (yellow arrows). Scale bar = 25 μm. e UMAP with subclustering of in vivo ciliated cells. Mature ciliated cells combine two subgroups (Supplementary Fig. 8b). f Average expression of markers from three in vitro ciliogenesis states and in vivo mature mucus secretory cells (far right). Box centers: median; upper/lower box bounds: first/third quartiles; upper/lower whiskers: extend from upper/lower bounds up to/down from the largest/smallest value, no further than 1.5× the inter-quartile range from upper/lower bounds; points: outliers. N (left to right) = 140; 2216; 30,866; 3026 cells. g (Left) Hybrid secretory/ciliated cells exhibit MUC5B labeling and early ciliogenesis phenotypes via TUBG1 morphology under confocal IF microscopy (day 16 ALI cultures imaged 48 h post-DAPT). Scale bar = 10 μm. (Right) TUBG1 pattern schematic for non-ciliated, early ciliating, and mature multiciliated cells. h Functional gene network (FGN) of non-core upregulated genes in mature ciliated cells. Edges: connect genes annotated for the same enrichment terms; node colors: functional metagroups containing genes (exemplar terms, right); white nodes: hub genes (in multiple metagroups); node size: gene connectivity; label size: mean log fold-change between smokers and non-smokers; edge thickness: number of shared terms; edge color: metagroup membership of the connected node(s) if one or both are not hub genes; gray edges connect two hub genes. i FGN for genes downregulated by smoking in hybrid secretory/ciliated cells (network as described in h). See Supplementary Fig. 8.
Fig. 7
Fig. 7. A lineage relationship among rare epithelial cell types.
a Left, in vivo rare cell subclustering UMAP. Right, violin plots of rare cell markers. b Heat map of unique gene signatures across rare cell types. Right, select gene ontology terms enriched within signatures. c Top, Violin plots show FOXI1 expression in tuft-like cells and ionocytes. Point color: co-expression of FOXI1 with CFTR (red), POU2F3 (green), or neither (white). Bottom, quantification of co-expression. d FISH illustrates FOXI1 in ionocytes (FOXI1+/CFTR+, pink arrows) and tuft-like cells (FOXI1+/POU2F3+, yellow arrows) of human tracheal epithelium in vivo. Green arrow, FOXI1/POU2F3+ tuft-like cell. Scale bar = 25 μm. e Average co-expression quantification of FISH in d (n = 561 total ionocytes/tuft-like cells imaged across 4 donors; number of cells indicated). f Geometric mean of scaled bulk mRNA expression from top 25 in vivo markers for each rare cell type. g qRT-PCR from ALI day 32 POU2F3 or FOXI1 KO cultures relative to controls. Bars: estimated normalized mRNA expression (n = 5 donors, three cultures each); estimates: coefficients from a linear model (donor set to random predictor); points: individual measures, normalized to control estimates; lines: estimate standard error; *p < 0.05, when compared to control with F-test, Satterthwaite approximation of degrees of freedom (p-values, top to bottom: 0.339, 0.750, 6.05e−8, 2.42e−8, 9.55e−5, 6.81e−8, 0.00189, 3.42e−5, 0.179, 0.728, 0.00268, 6.47e−7, 0.00158, 2.83e−7, 0.261, 0.503, 2.61e−4, 0.0291, 0.00259, 0.0782). h Left, Representative wholemount IF for FOXI1 (magenta, top inlay), FOXJ1 (green, middle inlay), DAPI (bottom inlay, excluded from overlay) from cultures in g; ECAD (white), cell boundaries. Scale bar = 25 μm. Right, IF quantification, bars: estimated number FOXI1+ cells (n = 5 donors, 10–13 fields each) based on linear model in g, normalized to controls, lines: standard error; *: as in g (top, p = 7.63e−5; bottom, p = 1.60e−30). i Left, Representative wholemount FISH for GRP (white, top inlay), POU2F3 (green, middle inlay), TRPM5 (red, bottom inlay) from cultures in g, overlay includes single DAPI slice (blue) for context. Scale bar = 50 μm. Right, FISH quantification, bars: estimated number GRP+ cells (n = 3 donors, 8 fields each) based on linear model in g, normalized to controls; lines: standard error; *: as in g (top, p = 7.67e−4; bottom, p = 0.0265). j Branched rare cell lineage schematic. See Supplementary Fig. 9 and Supplementary Table 2.
Fig. 8
Fig. 8. Rare cells are critical for normal epithelial electrophysiology and compromised with smoking.
a Baseline electrophysiological parameters of KO cultures relative to controls (ALI day 32). Bars: estimated normalized parameter values, (n = 4 donors, four cultures each); estimates: coefficients from a linear model (donor set to random predictor); points: individual measures, normalized to control estimates; lines: estimate standard error; *p < 0.05, when compared to control with F-test, Satterthwaite approximation of degrees of freedom (p-values, top to bottom: 0.0157, 1.72e−10, 0.289, 0.00224, 9.63e−8, 5.38e−14, 1.66e−10, 2.91e−14). b Top, CFTR expression across UMAP of in vivo human tracheal epithelium. Bottom, Distribution of CFTR UMIs across major cell populations. c Geometric mean of scaled bulk RNA-seq expression for in vivo markers of non-rare cells, ionocytes, and CFTR, across 20 timepoints of ALI differentiation. d IF confocal microscopy of control day 32 human ALI cultures illustrates FOXI1 (red) and CFTR (green) cellular co-localization (four 1 μm slices of a 23-slice z-stack). Full z-stack in Supplementary Movie 1. ECAD (white), cell boundaries. Scale bar = 10 μm. e Electrophysiology of KOs treated with forskolin/IBMX, then CFTR(inh)−172, relative to controls. Plots are as in a (p-values, top to bottom: 4.98e−4, 2.50e−9, 3.85e−5, 8.47e−17, 0.0605, 0.282, 0.893, 0.00281). f Fluctuations in short-circuit current measurements of ATP-stimulated cultures. KOs are scaled to control cultures that were simultaneously clamped on the same Ussing apparatus. Plots are as in a (top, p = 2.08e−6; bottom p = 8.44e−7). g Number of DEGs was significantly altered in smokers vs non-smokers for rare cell types. h Enrichment of cell-type marker genes (rows) within rare cell smoker DEGs (columns) based on hypergeometric tests. Redness: enrichment level (−log10(p-value)); white: non-significant. i Relationships between rare cell frequencies and donor age, by smoking status. See also Supplementary Figs. 10 and 11, and Supplementary Movie 1.
Fig. 9
Fig. 9. Whole epithelium smoking responses reconstructed from cell-specific scRNA-seq analyses.
a Functional Gene Network (FGN) based on all genes upregulated with smoking (excluding rare cells) shows how genes that respond to smoking in distinct cell types of the airway epithelium may collaborate in carrying out dysregulated function. Node (i.e. gene) colors in the node key refer to the cell type in which a gene was differentially expressed if unique; nodes for semi-unique and core DEGs are white and black, respectively. Edges connect genes annotated for the same enriched term. Exemplar enriched functions are given next to each functional metagroup (or category), which are indicated by the underlay colors that encompass all genes annotated only for the terms within the metagroup. Nodes without colored underlay represent genes in multiple metagroups. Other properties of the network, including node size, connecting edge thickness, and label size/redness are defined in the network key. b FGN as in a, but for all genes downregulated with smoking in the airway epithelium. Legend serves for both a and b. c Schematic summarizes the smoking response of the whole epithelium.

References

    1. Hong KU, Reynolds SD, Watkins S, Fuchs E, Stripp BR. Basal cells are a multipotent progenitor capable of renewing the bronchial epithelium. Am. J. Pathol. 2004;164:577–588. doi: 10.1016/S0002-9440(10)63147-1. - DOI - PMC - PubMed
    1. Rock JR, et al. Basal cells as stem cells of the mouse trachea and human airway epithelium. PNAS. 2009;106:12771–12775. doi: 10.1073/pnas.0906850106. - DOI - PMC - PubMed
    1. Ordonez CL, et al. Mild and moderate asthma is associated with airway goblet cell hyperplasia and abnormalities in mucin gene expression. Am. J. Respir. Crit. Care Med. 2001;163:517–523. doi: 10.1164/ajrccm.163.2.2004039. - DOI - PubMed
    1. Araya J, et al. Squamous metaplasia amplifies pathologic epithelial-mesenchymal interactions in copd patients. J. Clin. Investig. 2007;117:3551–3562. doi: 10.1172/JCI32526. - DOI - PMC - PubMed
    1. Eisner, M. D. et al. Lifetime environmental tobacco smoke exposure and the risk of chronic obstructive pulmonary disease. Environ. Health4, 7 (2005). - PMC - PubMed

Publication types

MeSH terms