. 2020 May 19;10(1):8246.
doi: 10.1038/s41598-020-65104-y.

Establishment of an in vitro RNA polymerase transcription system: a new tool to study transcriptional activation in Borrelia burgdorferi

Affiliations

Establishment of an in vitro RNA polymerase transcription system: a new tool to study transcriptional activation in Borrelia burgdorferi

William K Boyle et al. Sci Rep. .

Abstract

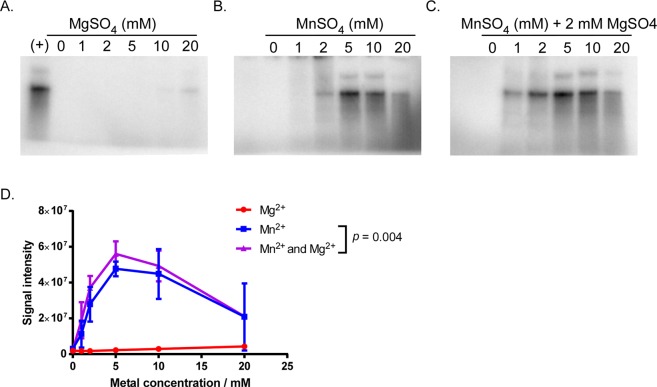
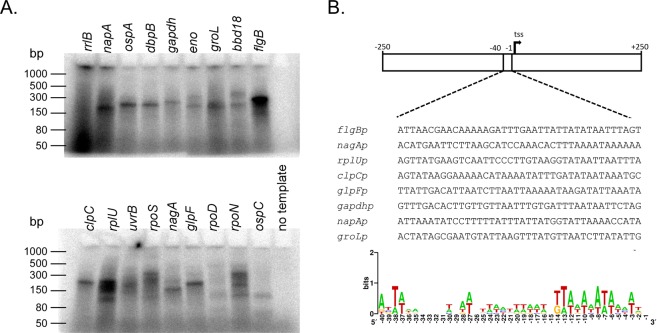
The Lyme disease spirochete Borrelia burgdorferi exhibits dramatic changes in gene expression as it transits between its tick vector and vertebrate host. A major hurdle to understanding the mechanisms underlying gene regulation in B. burgdorferi has been the lack of a functional assay to test how gene regulatory proteins and sigma factors interact with RNA polymerase to direct transcription. To gain mechanistic insight into transcriptional control in B. burgdorferi, and address sigma factor function and specificity, we developed an in vitro transcription assay using the B. burgdorferi RNA polymerase holoenzyme. We established reaction conditions for maximal RNA polymerase activity by optimizing pH, temperature, and the requirement for divalent metals. Using this assay system, we analyzed the promoter specificity of the housekeeping sigma factor RpoD to promoters encoding previously identified RpoD consensus sequences in B. burgdorferi. Collectively, this study established an in vitro transcription assay that revealed RpoD-dependent promoter selectivity by RNA polymerase and the requirement of specific metal cofactors for maximal RNA polymerase activity. The establishment of this functional assay will facilitate molecular and biochemical studies on how gene regulatory proteins and sigma factors exert control of gene expression in B. burgdorferi required for the completion of its enzootic cycle.


Conflict of interest statement

The authors declare no competing interests.

Figures

Figure 1
Figure 1
Model of the B. burgdorferi RNA polymerase core. The B. burgdorferi RNA polymerase core model was created by modeling the subunits β′ (yellow), β (green), α (pink and purple), and ω (orange) individually using Iterative Threading Assembly Refinement (I-TASSER) and subsequently aligning the modeled subunits to the E. coli RNA polymerase (PDB 3lu0) in PyMOL. Location of the affinity tag appended to C-terminus of the β′ subunit is shown schematically as a chain of black spheres and labeled.
Figure 2
Figure 2
Purification of the RNA polymerase from B. burgdorferi and determination of the molar ratio of the core subunits β and α. (A) Purified proteins in pooled elution fraction from nickel-affinity chromatography performed on lysates generated from B. burgdorferi 5A4-RpoC-His10X were separated by SDS-PAGE and stained with Coomassie Brilliant Blue. Labels on the right side of the gel indicate RNA polymerase subunits detected by LC-MS of excised bands. (B) Western blots were performed on nickel-affinity purified proteins using anti-Borrelia-RpoA and anti-Borrelia-RpoD antibodies to confirm the presence of the target proteins. Numbers indicate the migration of protein molecular mass markers. Detection of RpoD required loading microgram quantities of purified RNA polymerase. (C) Molar ratios were determined by quantitative western blots. Recombinant RpoB, RpoA, and RpoD were loaded in amounts indicated above to form a standard curve. Purified RNA polymerase samples A and B were loaded with the standard curve for quantification. Molar amounts were calculated from the theoretical masses of proteins based on amino acid sequence. Images are representative of four replicate experiments.
Figure 3
Figure 3
The accumulation of RNA products from in vitro transcription reactions using flgB promoter dsDNA increases with increasing concentrations of the sigma factor RpoD. RNA was separated by a 10% TBE-urea gel and radiolabeled RNA was detected by phosphor screen. The signal from the phosphor screen was quantified by densitometry. Results are representative of two replicate experiments. R2 for linear regression is reported to indicate RpoD-dependent variability in RNA polymerase activity.
Figure 4
Figure 4
pH and temperature ranges for RNA polymerase activity. (A) RNA products from in vitro transcription reactions conducted at 30 °C and pH 6.8, 7.5, or 8.2 were separated on 10% TBE-urea gel. Radiolabeled RNA was detected by phosphor imaging. Reactions were initiated individually, and controls were added for transcription initiation timing (pipette start and end). (B) Signal intensity on the phosphor screen was determined by densitometry using data collected from four replicate experiments. Asterisks indicate p-value of <0.001 in a comparison of signal intensity between pH values using a one-way ANOVA. (C) Representative image of RNA products generated from in vitro transcription reactions carried out at 22, 30, or 37 °C, at pH 6.8 and separated on 10% TBE-urea gel. Cropped gels were generated from a single image. (D) pH and temperature conditions yielding the highest RNA polymerase activity. Signal intensities from phosphor imaging were determined by densitometry. Each point represents the average of two replicate experiments. Asterisks indicate p-value of <0.001 in a comparison of signal intensity achieved at different temperatures in a mixed-effects ANOVA to account for pH-based differences.
Figure 5
Figure 5
Evaluation of magnesium and manganese requirement on RNA polymerase activity. RNA products generated from in vitro transcription assays containing various concentrations of magnesium and manganese metal ions were separated by gel electrophoresis in a 10% TBE-Urea gel and detected using a phosphor screen. Representative gels are shown from in vitro transcription reactions prepared in parallel with metal salts: reactions containing (A) 0–20 mM magnesium or (B) 0–20 mM manganese or (C) 2 mM magnesium with 0–20 mM manganese. Data are representative of three replicate experiments and gels were cropped from a single image. Phosphor screen signals were quantified by densitometry and plotted over varied magnesium or manganese concentrations (D). Differences in signal intensity achieved using manganese alone (1–20 mM Mn2+) and those supplemented with magnesium (1–20 mM Mn2+ with 2 mM Mg2+) were analyzed by a two tailed paired t-test matched along the entire metal concentration range and was found to be statistically significant (α = 0.05, p = 0.004), indicating a role for magnesium in RNAP activity.
Figure 6
Figure 6
RNA polymerase domains (Rpd) and metal binding sites of B. burgdorferi RpoC and alignment of the amino acids at the catalytic site with other bacterial species. Genus names from which the RNA polymerases were purified and characterized are shown alongside the amino acid alignment of the catalytic site. Aspartates in the positions highlighted in yellow coordinate catalytic metal ions, typically magnesium. Amino acid positions in red indicate positions where the amino acid identity differs from Borrelia.
Figure 7
Figure 7
Promoter selection by the RNAP holoenzyme. In vitro transcription reactions were initiated with dsDNA templates encompassing the predicted promoters upstream of the indicated genes. The genes are ordered from highest to lowest number of transcripts during in vitro culture at the transcription initiation site as measured by RNA-seq reported in a previously published data set. (A) The RNA products were separated by gel electrophoresis and detected by phosphor imaging. Gels were cropped from a single image and are representative of three independent experiments. (B) A consensus sequence was generated from DNA sequence encoded in −40 to −1 position from the transcription start sites using sequence logo. Seven templates that encode promoters to housekeeping genes and produce single RNA products were chosen to generate the sequence.

Similar articles

Cited by

References

    1. Barbour AG. Isolation and cultivation of Lyme disease spirochetes. Yale J. Biol. Med. 1984;57:521–525. - PMC - PubMed
    1. Johnson RC, Hyde FW, Rumpel CM. Taxonomy of the Lyme disease spirochetes. Yale J. Biol. Med. 1984;57:529–537. - PMC - PubMed
    1. Brisson D, Drecktrah D, Eggers CH, Samuels DS. Genetics of Borrelia burgdorferi. Annu. Rev. Genet. 2012;46:515–536. doi: 10.1146/annurev-genet-011112-112140. - DOI - PMC - PubMed
    1. Fraser CM, et al. Genomic sequence of a Lyme disease spirochaete, Borrelia burgdorferi. Nature. 1997;390:580–586. doi: 10.1038/37551. - DOI - PubMed
    1. Caimano MJ, Drecktrah D, Kung F, Samuels DS. Interaction of the Lyme disease spirochete with its tick vector. Cell Microbiol. 2016;18:919–927. doi: 10.1111/cmi.12609. - DOI - PMC - PubMed

Publication types

MeSH terms