. 2020 May 11;61(5):30.
doi: 10.1167/iovs.61.5.30.

Treatment Potential for LCA5-Associated Leber Congenital Amaurosis

Affiliations

Treatment Potential for LCA5-Associated Leber Congenital Amaurosis

Katherine E Uyhazi et al. Invest Ophthalmol Vis Sci. .

Abstract

Purpose: To determine the therapeutic window for gene augmentation for Leber congenital amaurosis (LCA) associated with mutations in LCA5.

Methods: Five patients (ages 6-31) with LCA and biallelic LCA5 mutations underwent an ophthalmic examination including optical coherence tomography (SD-OCT), full-field stimulus testing (FST), and pupillometry. The time course of photoreceptor degeneration in the Lca5gt/gt mouse model and the efficacy of subretinal gene augmentation therapy with AAV8-hLCA5 delivered at postnatal day 5 (P5) (early, n = 11 eyes), P15 (mid, n = 14), and P30 (late, n = 13) were assessed using SD-OCT, histologic study, electroretinography (ERG), and pupillometry. Comparisons were made with the human disease.

Results: Patients with LCA5-LCA showed a maculopathy with detectable outer nuclear layer (ONL) in the pericentral retina and at least 4 log units of dark-adapted sensitivity loss. The Lca5gt/gt mouse has a similarly severe and rapid photoreceptor degeneration. The ONL became progressively thinner and was undetectable by P60. Rod- and cone-mediated ERGs were severely reduced in amplitudes at P30 and became nondetectable by P60. Subretinal AAV8-hLCA5 administered to Lca5gt/gt mice at P5 and P15, but not at P30, resulted in structural and functional rescue.

Conclusions: LCA5-LCA is a particularly severe form of LCA that was recapitulated in the Lca5gt/gt mouse. Gene augmentation resulted in structural and functional rescue in the Lca5gt/gt mouse if delivered before P30. Retained photoreceptors were visible within the central retina in all patients with LCA5-LCA, at a level equivalent to that observed in rescued Lca5gt/gt mice, suggesting a window of opportunity for the treatment of patients with LCA5-LCA.


Conflict of interest statement

Disclosure: J. Bennett, Spark Therapeutics (E), GenSight Biologics (I), Limelight Bio (I), Akouos (S), Odylia Therapeutics (S), Limelight Bio (F, P); K.E. Uyhazi, None; P. Aravand, None; B.A. Bell, None; Z. Wei, None; L. Leo, None; L.W. Serrano, None; D.J. Pearson, None; I. Shpylchak, None; J. Pham, None; V. Vasireddy, None; T.S. Aleman, None

Figures

Figure 1.
Figure 1.
Retinal structure and function in patients with LCA5-associated LCA. (A) Wide-field fundus photography and SW-FAF and 30° near-infrared autofluorescence (NIR-FAF) imaging; white square in the SW-FAF image outlines the region imaged with NIR-FAF. White arrow indicates autofluorescent buried optic nerve drusen. Yellow arrows point to regions of better preserved SW- and NIR-FAF indicative of preserved lipofuscin and melanin-originating signals, respectively. (B) Multicolor scanning laser ophthalmoscope (SLO) (Heidelberg HRA) imaging (left panel) and conventional color fundus photos (central and right panel) reveals optic nerve pallor, vascular attenuation, and a midperipheral pigmentary retinopathy with variable preservation of the pericentral and peripapillary retina and a yellow discoloration of the fovea (P3). (C) Non-straightened, 9 mm-long SD-OCT cross-sections along the horizontal meridian through the fovea from nasal (N) retina in the least severe (P5, age 31) and most severe (P3, age 21) patients. Nuclear layers (ganglion cell layer, GCL; inner nuclear layer, INL; outer nuclear layer, ONL), outer plexiform layer (OPL) and a preserved retinal nerve fiber layer (RNFL) are labeled. Overlaid on P5 is a longitudinal reflectivity profile (LRPs); yellow segment in the LRP indicates raise of signal from the external limiting membrane to the signal peak (white arrow) that corresponds to the ellipsoid zone (EZ) band. Asterisk in P3 denotes interruption of RPE/BrM with posterior displacement of the retinal layers. (D) LRPs from 4 patients from a location 1.5 mm nasal to the foveal center, aligned vertically by the RPE/BrM signal peak and compared to a representative normal subject. Pink segment = INL; blue segment = outer retina (OPL to RPE/BrM); asterisks = remnant signals from the photoreceptor inner and/or outer segments (EZ band). The inner retina (ILM to OPL) is relatively thick in the patients. (E) Dark-adapted full-field stimulus testing (FST) sensitivities to chromatic stimuli (blue bars = 467 nm; red bars = 637 nm) in three patients who could complete testing. Pairs of bars plot sensitivities for the right (left bar) and left (right eye) for each patient. Dashed line = lower limit of normal for the 467 nm stimulus; spectral sensitivities were used to determine photoreceptor mediation (M = mixed rod and cone mediation; C = cone-mediated).
Figure 2.
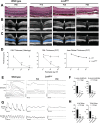
Figure 2.
Lca5gt/gt mice have a rapid loss of photoreceptor structure and function. (A) Histologic retinal sections from wild-type (WT) vs. Lca5gt/gt mice at P15, P30, and P60 stained with hematoxylin and eosin (H&E) show a progressive loss of outer retinal structures: photoreceptor outer segments are shortened by P15, outer nuclear layer (ONL) is thinned by P30, and ONL is reduced to a single layer of nuclei by P60. (B) Horizontal SD-OCT sections through the optic nerve in WT and Lca5gt/gt mice. Outer retinal laminations: 1 = external limiting membrane (ELM), 2 = ellipsoid zone (EZ), 3 = interdigitation zone (IZ), 4 = RPE. By P15, only the ELM and RPE bands remain detectable. (C) Images in (B) with the ONL highlighted in blue highlight the loss of detectable ONL by P60. GCL = ganglion cell layer, INL = inner nuclear layer. Scale bars = 100 µm. (D) Quantification of ONL thickness by histology and SD-OCT from measurements 200 µm nasal and temporal to the optic nerve, compared to inner retinal thickness measured from OCTs at the same location. (E) Dark-adapted full-field electroretinogram (ERG) recordings performed in P60 wild-type and P30 and P60 Lca5gt/gt mice in response to an intensity series of stimuli reveals detectable signal in P30 but not in P60 Lca5gt/gt mice. (F) Quantification of ERG b wave amplitudes in response to a dim (-1.0 log scot-cd.m.s) and bright (+1.9 log scot-cd.m.s) stimulus. (G) Dark-adapted full-field ERG recordings in response to 4Hz (upper panel) and 10Hz (lower panel) flicker show an attenuated response in P30 Lca5gt/gt mice and isoelectric recordings in P60 animals. (H) Quantification of ERG flicker amplitudes in response to a 4Hz and 10Hz dim (-1.0 log scot-cd.m.s) stimulus. ***P < 0.001. Error bars are ± 2SD.
Figure 3.
Figure 3.
Gene therapy preserves ONL structure when delivered to P5 and P15, but not P30 Lca5gt/gt mice. (A) Horizontal SD-OCT sections through the optic nerve in P30 and P60 wild-type (WT) mice; ONL highlighted in blue. Corresponding histologic section stained with hematoxylin and eosin (H&E). (B) Horizontal SD-OCT sections through the optic nerve in untreated, excipient-treated controls, P5-treated, P15-treated, and P30-treated Lca5gt/gt mice imaged at P30 (left column) and P60 (center column). ONL is highlighted in blue and is no longer detectable in untreated or excipient-treated controls by P60. P5-treated and P15-treated animals have regions of preserved ONL by P60 (asterisks) that corresponds to detectable ONL on histologic sections (right column, arrowheads) within the site of subretinal injections. Scale bars = 100 µm. (C, D) Percent of eyes with detectable ONL at P30 (C) and P60 (D); only the P5-treated and P15-treated mice have remaining ONL at P60. (E) Quantification of ONL thickness in WT and untreated animals (200 µm nasal and temporal to the optic nerve), and within the subset of treated animals with detectable regions of ONL at the site of the subretinal injection in treated animals at a location that corresponds to the nasal measurements. ***P < 0.001. Error bars are ± 2SD. Dashed line = groups measured at P60.
Figure 4.
Figure 4.
Immunofluorescence staining of LCA5 (green), rhodopsin (red, labels photoreceptor outer segments), and nuclei (blue) of excipient-injected control animals, P5-treated, P15-treated, and P30-treated Lca5gt/gt mice harvested at P90; merged images shown to the right. LCA5 expression within sites of the subretinal AAV injection corresponds with regions of ONL preservation and rhodopsin expression, suggestive of structurally intact photoreceptors at these locations. No ONL or rhodopsin expression is seen in P30-treated animals. INL = inner nuclear layer; ONL = outer nuclear layer. Scale bars = 50µm.
Figure 5.
Figure 5.
Functional rescue in P5- and P15-treated, but not P30-treated animals. (A) Dark-adapted full-field ERG recordings performed in P60 excipient-treated controls, P5-treated, P15-treated, and P30-treated Lca5gt/gt mice in response to 0.5Hz, 4Hz, and 10Hz stimuli at P30 (upper panel) and P60 (lower panel). At P30, ERG responses are detectable in all groups. By P60, tracings are isoelectric in all excipient-treated controls but show detectable responses in representative animals treated at P5 and P15, but not P30. (B) Quantification of full-field ERG b wave amplitudes in response to a 0.5Hz, 4Hz, and 10Hz dim (-1.0 log scot-cd.s.m−2) stimulus and 1Hz bright (+1.9 log scot-cd.s.m−2) stimulus. There is no statistically significant difference between the average amplitudes of untreated, excipient-treated, P5-, P15-, and P30-treated animals. Error bars indicate SEM. (C) Transient pupillary light reflex (TPLR) recordings were performed at P60 in control, P5-treated, P15-treated, and P30-treated Lca5gt/gt mice using stimulation with 1K and 3K scot lux m2 (for 40 ms). Traces represent recordings from individual eyes, normalized to baseline pupil diameter. (D) Quantification of the maximum pupillary constriction (as a percent from baseline) in each cohort; excipient-injections were performed at P5, P15, and P30 as controls for each injection timepoint and all excipient responses were pooled for simplicity. *P < 0.05; **P < 0.01. Error bars are ± SEM.
Figure 6.
Figure 6.
ONL thickness expressed as a percentage of the measures in wild-type mice at the same location for Lca5gt/gt mice treated at P15 and P30. ONL thickness declines dramatically in the Lca5gt/gt mouse, from 85% of wild-type at P15, to 37% of wild-type by P30; diagonal green dashed line models linear ONL loss between the two time points. Horizontal dashed lines represent the ONL mean thickness for each P15 and P30 group, solid lines represent ± SD. The colored background represents a theoretical gradient of functional improvement after gene therapy relating to the percentage of remaining ONL at the time of treatment, with green indicating preserved ONL and improved functional outcome, and red indicating loss of ONL and limited therapeutic potential. ONL thickness from best preserved regions in the pericentral retina of four LCA5-LCA patients expressed as a percentage of the location-specific normal mean value (red symbols). P2, P3, and P5 had similar ONL thickness (54%, 52%, 54%, respectively) whereas P4 had a slightly thinner ONL (28%) similar to that of a P30 Lca5gt/gt mouse.

References

    1. Dharmaraj S, Li Y, Robitaille J, et al. .. A novel locus for Leber congenital amaurosis maps to chromosome 6q. Am J Hum Genet. 2000; 66: 319–326. - PubMed
    1. Mohamed M, Topping N, Jafri H, Raashed Y, McKibbin M, Inglehearn C. Progression of phenotype in Leber's congenital amaurosis with a mutation at the LCA5 locus. Br J Ophthalmol. 2003; 87: 473–475. - PMC - PubMed
    1. den Hollander AI, Koenekoop RK, Mohamed MD, et al. .. Mutations in LCA5, encoding the ciliary protein lebercilin, cause Leber congenital amaurosis. Nat Genet. 2007; 39: 889–895. - PubMed
    1. Gerber S, Hanein S, Perrault I, et al. .. Mutations in LCA5 are an uncommon cause of Leber congenital amaurosis (LCA) type II. Hum Mutat. 2007; 28: 1245. - PubMed
    1. Ramprasad VL, Soumittra N, Nancarrow D, et al. .. Identification of a novel splice-site mutation in the Lebercilin (LCA5) gene causing Leber congenital amaurosis. Molecular Vision. 2008; 14: 481–486. - PMC - PubMed

Publication types

MeSH terms