

Longitudinal study of anthropometry in Fontan survivors: Pediatric Heart Network Fontan study
- PMID: 32428726
- PMCID: PMC7293556
- DOI: 10.1016/j.ahj.2020.03.022
Longitudinal study of anthropometry in Fontan survivors: Pediatric Heart Network Fontan study
Abstract
Background: Growth abnormalities in single-ventricle survivors may reduce quality of life (QoL) and exercise capacity.
Methods: This multicenter, longitudinal analysis evaluated changes in height and body mass index (BMI) compared to population norms and their relationship to mortality, ventricular morphology, QoL, and exercise capacity in the Pediatric Heart Network Fontan studies.
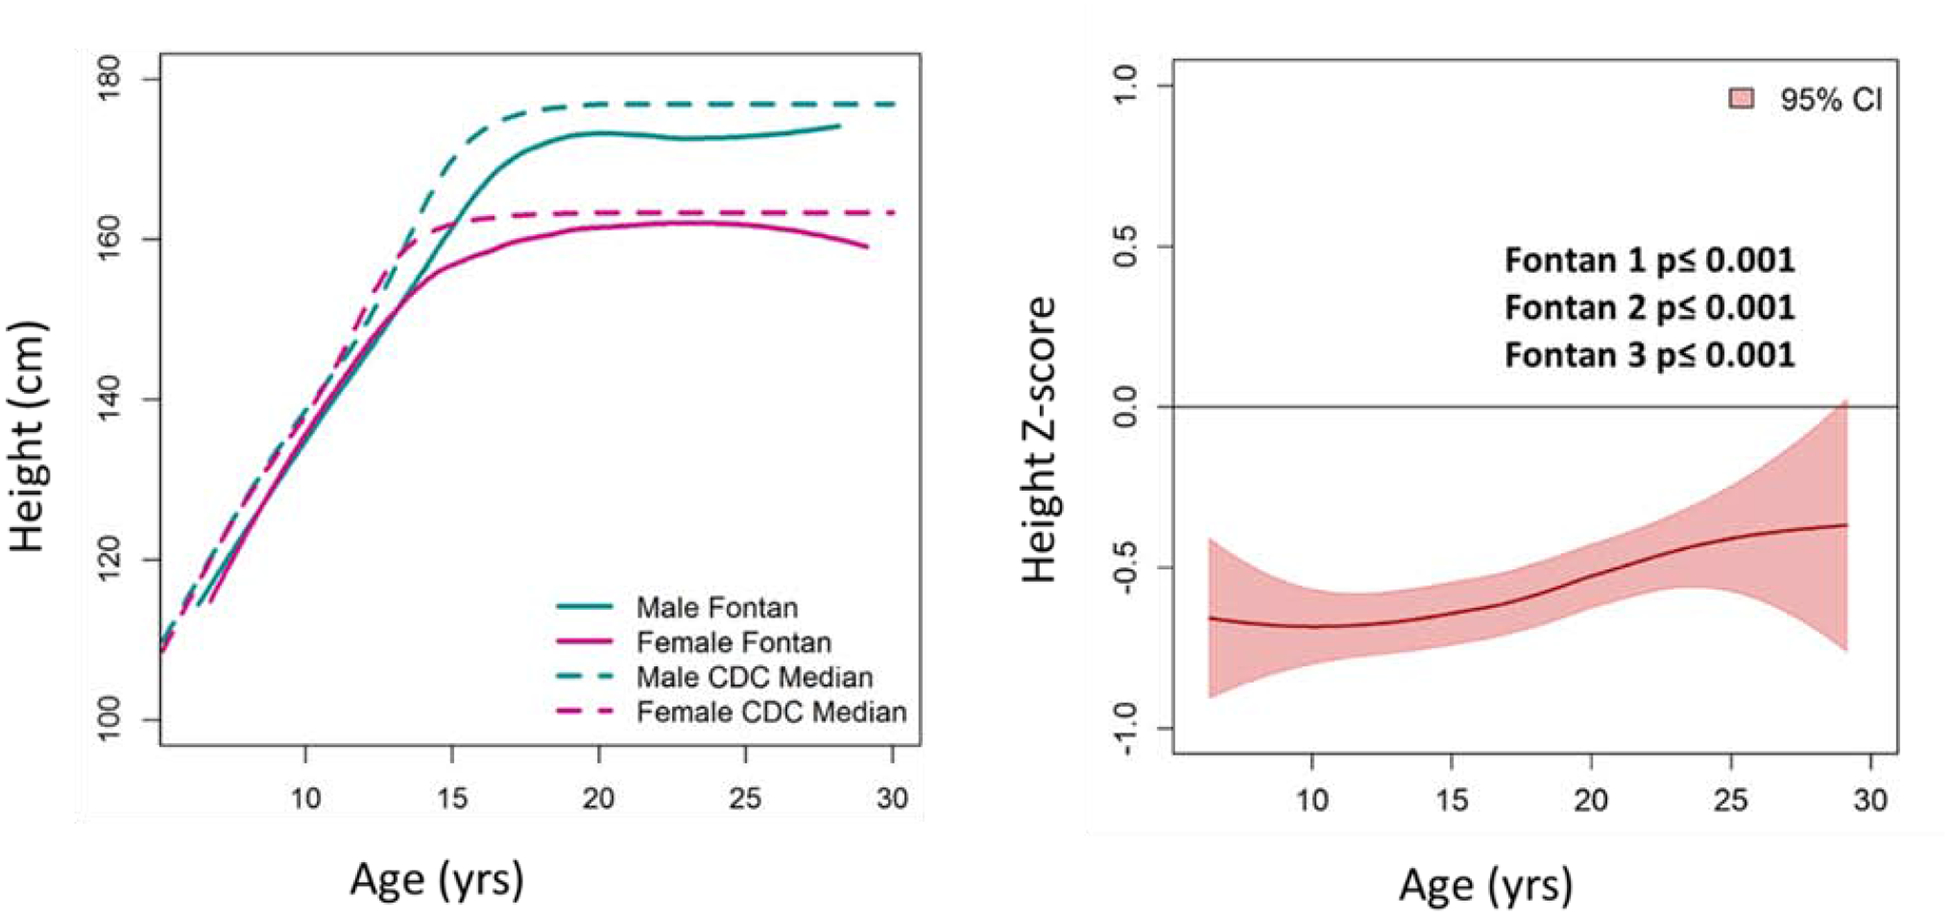
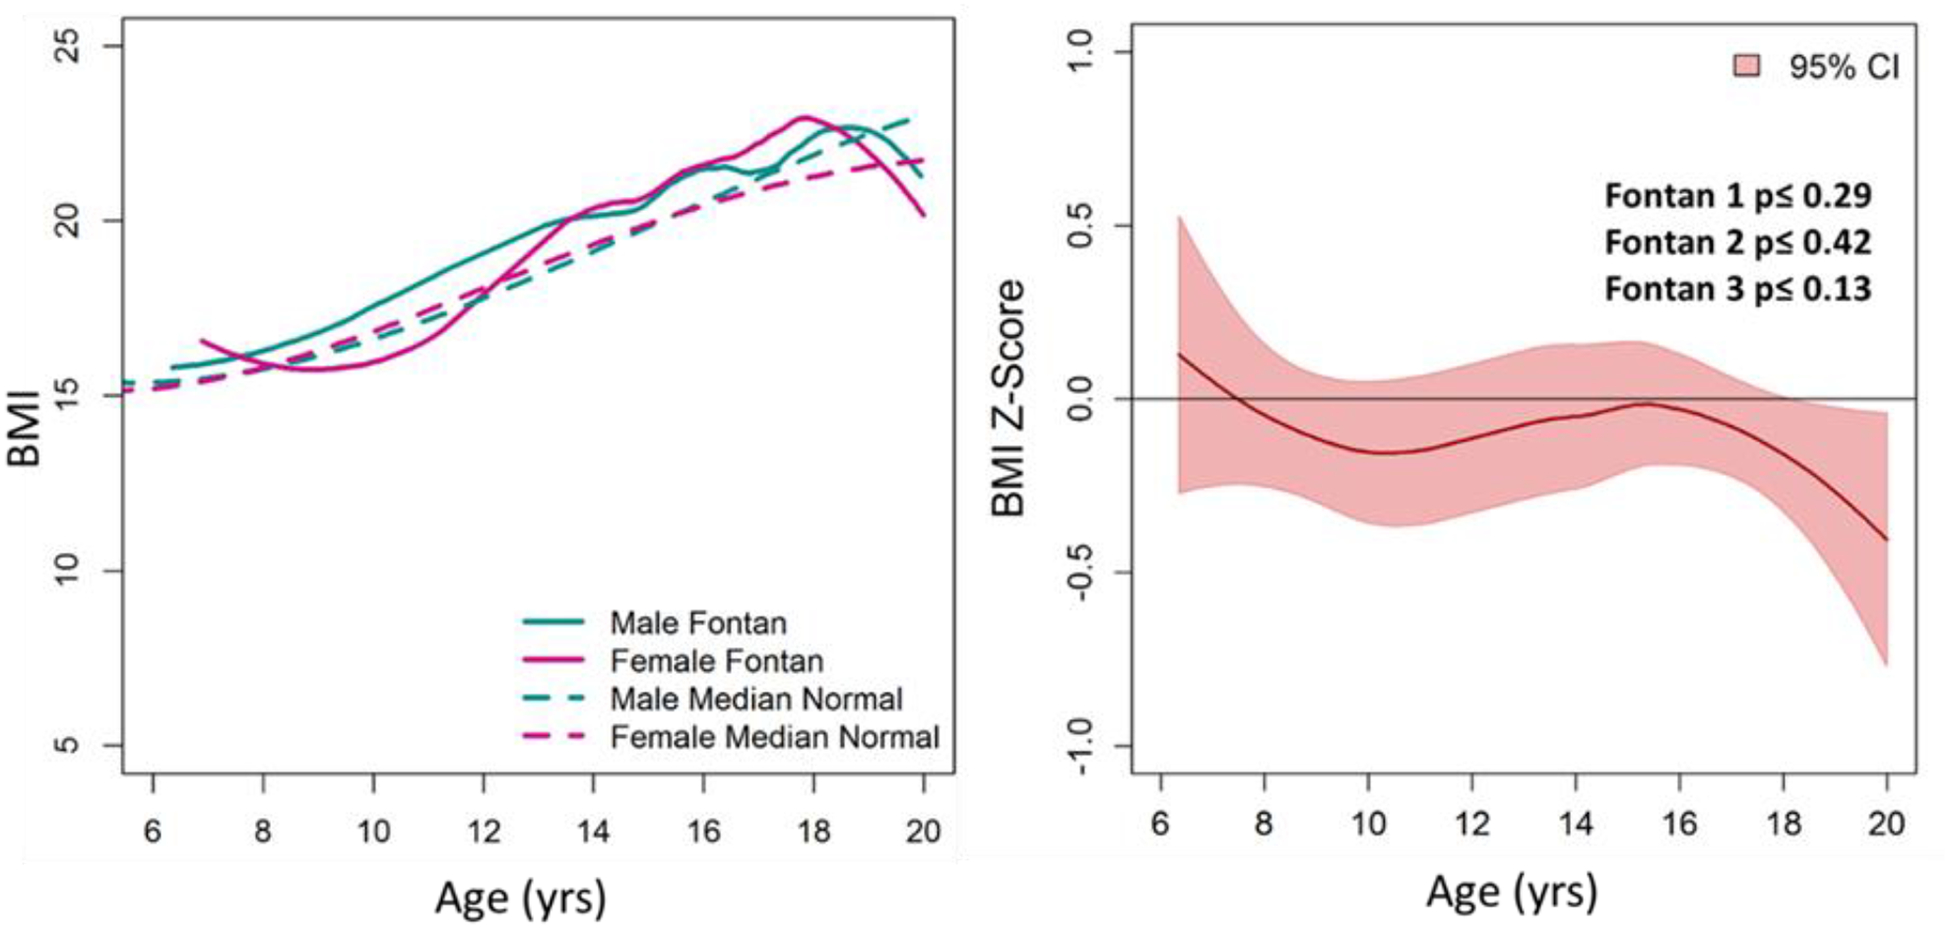
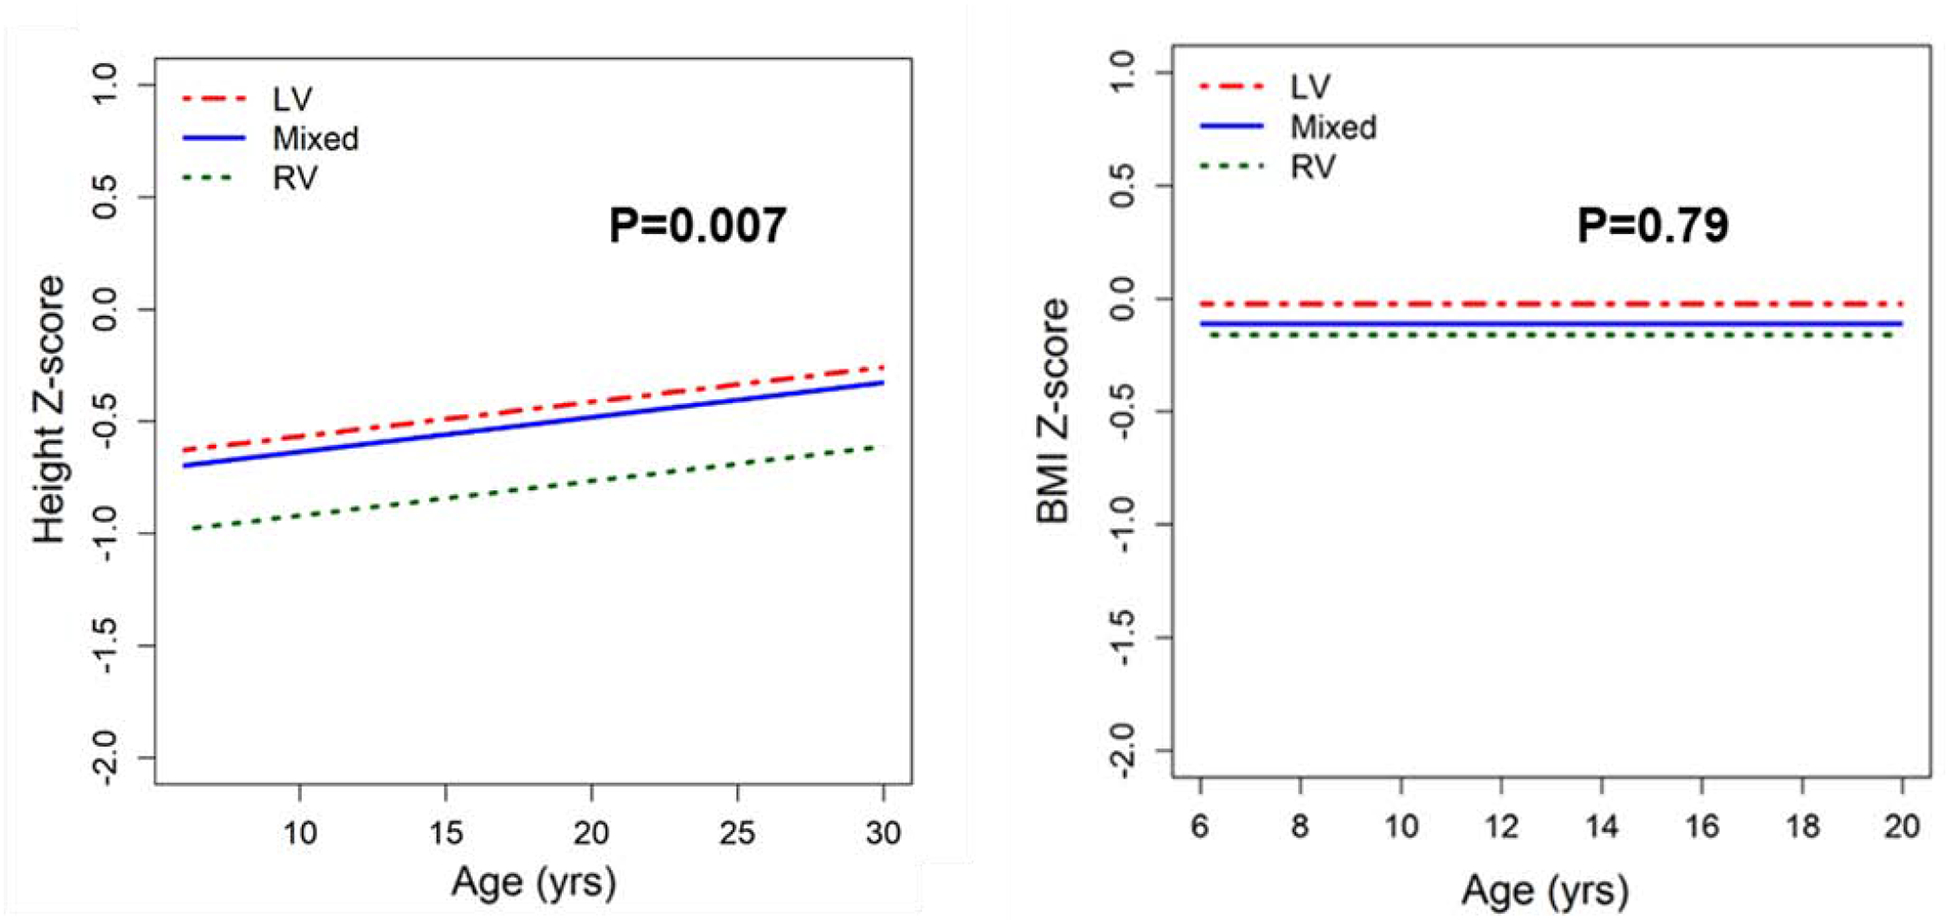
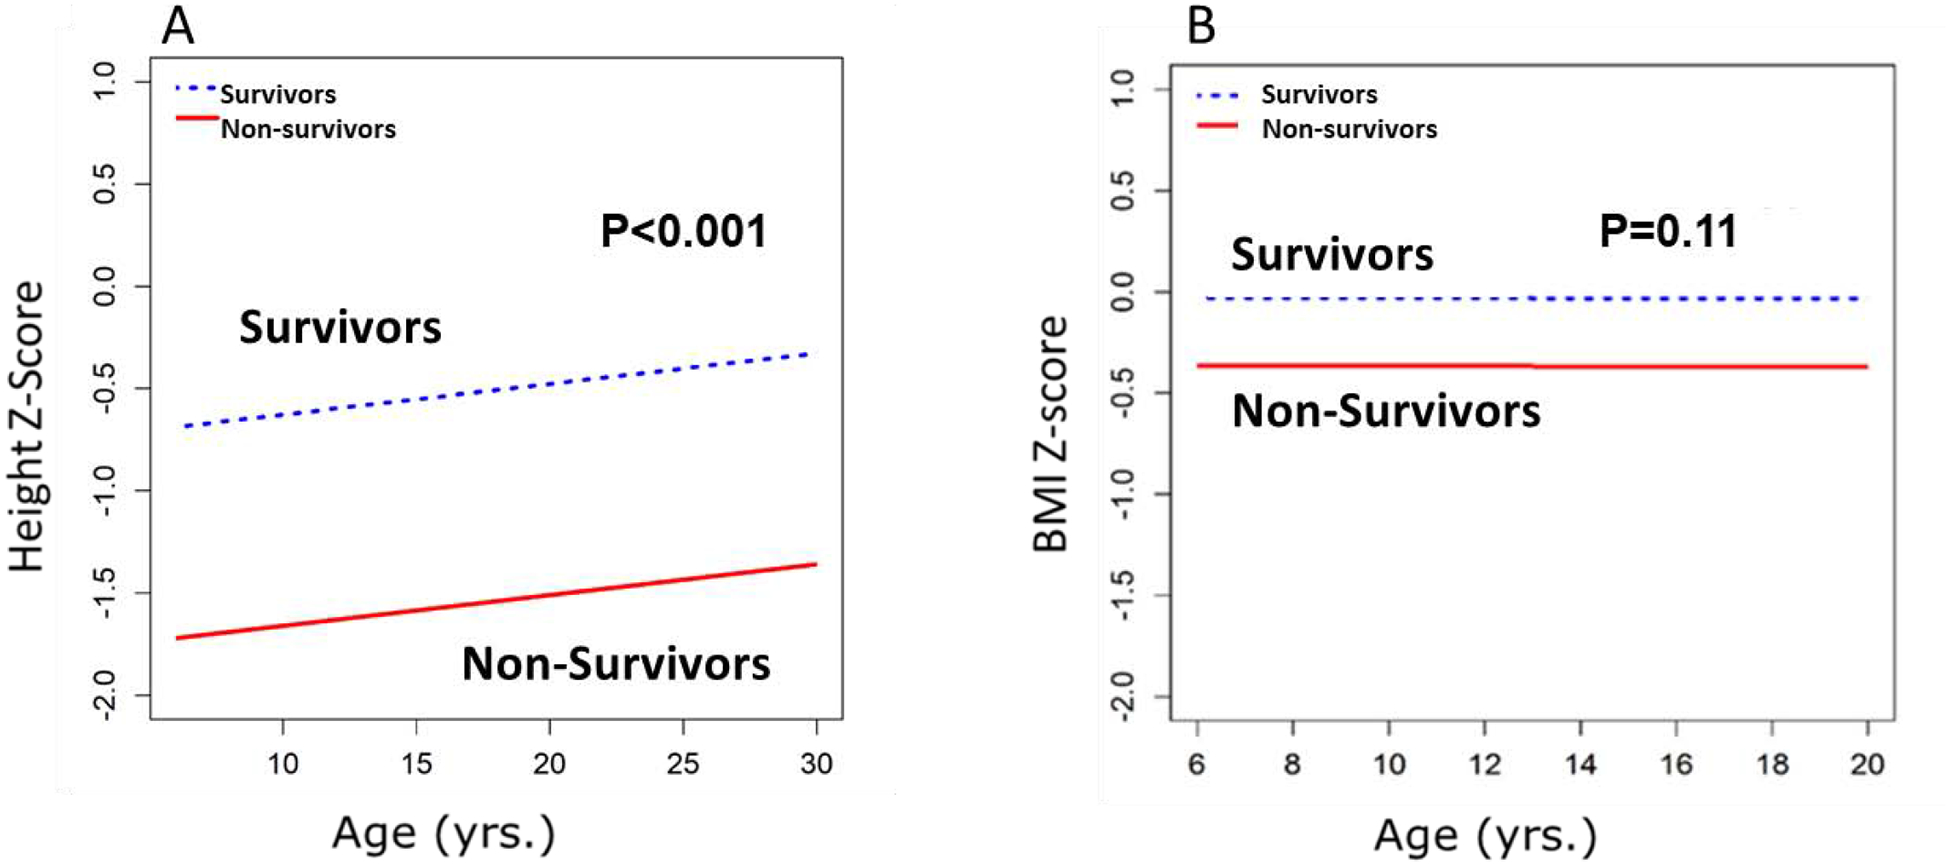
Results: Fontan 1 (F1) included 546 participants (12 ± 3.4 years); Fontan 2 (F2), 427 (19 ± 3.4 years); and Fontan 3 (F3), 362 (21 ± 3.5 years), with ~60% male at each time point. Height z-score was -0.67 ± -1.27, -0.60 ± 1.34, and- 0.43 ± 1.14 at F1-F3, lower compared to norms at all time points (P ≤ .001). BMI z-score was similar to population norms. Compared to survivors, participants who died had lower height z-score (P ≤ .001). Participants with dominant right ventricle (n = 112) had lower height z-score (P ≤ .004) compared to dominant left (n = 186) or mixed (n = 64) ventricular morphologies. Higher height z-score was associated with higher Pediatric Quality of Life Inventory for the total score (slope = 2.82 ± 0.52; P ≤ .001). Increase in height z-score (F1 to F3) was associated with increased oxygen consumption (slope = 2.61 ± 1.08; P = .02), whereas, for participants >20 years old, an increase in BMI (F1 to F3) was associated with a decrease in oxygen consumption (slope = -1.25 ± 0.33; P ≤ .001).
Conclusions: Fontan survivors, especially those with right ventricular morphology, are shorter when compared to the normal population but have similar BMI. Shorter stature was associated with worse survival. An increase in height z-score over the course of the study was associated with better QoL and exercise capacity; an increase in BMI was associated with worse exercise capacity.
Copyright © 2020 Elsevier Inc. All rights reserved.
Conflict of interest statement
Conflicts of Interest: None
Figures
References
-
- Driscoll DJ, Long-term results of the Fontan operation. Pediatr Cardiol, 2007. 28(6): p. 438–42. - PubMed
Publication types
MeSH terms
Grants and funding
- UG1 HL135666/HL/NHLBI NIH HHS/United States
- U10 HL109818/HL/NHLBI NIH HHS/United States
- U10 HL109741/HL/NHLBI NIH HHS/United States
- UG1 HL135680/HL/NHLBI NIH HHS/United States
- UG1 HL135646/HL/NHLBI NIH HHS/United States
- U10 HL109781/HL/NHLBI NIH HHS/United States
- UG1 HL135685/HL/NHLBI NIH HHS/United States
- U01 HL068270/HL/NHLBI NIH HHS/United States
- U10 HL109737/HL/NHLBI NIH HHS/United States
- U10 HL109777/HL/NHLBI NIH HHS/United States
- U10 HL109778/HL/NHLBI NIH HHS/United States
- U10 HL109673/HL/NHLBI NIH HHS/United States
- UG1 HL135689/HL/NHLBI NIH HHS/United States
- U10 HL109743/HL/NHLBI NIH HHS/United States
- U01 HL068290/HL/NHLBI NIH HHS/United States
- UG1 HL135682/HL/NHLBI NIH HHS/United States
LinkOut - more resources
Full Text Sources
Medical
Miscellaneous
