

Inflammatory and Oxidative Stress Markers-Mirror Tools in Rheumatoid Arthritis
- PMID: 32429264
- PMCID: PMC7277871
- DOI: 10.3390/biomedicines8050125
Inflammatory and Oxidative Stress Markers-Mirror Tools in Rheumatoid Arthritis
Abstract
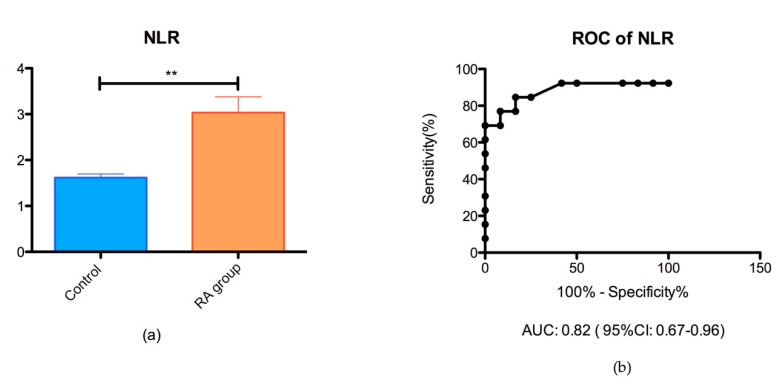
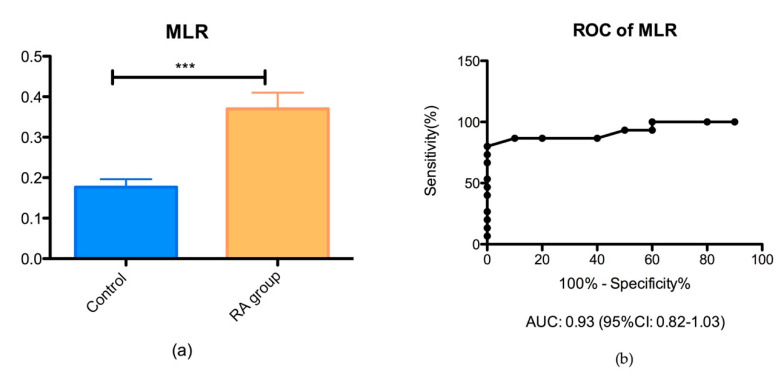
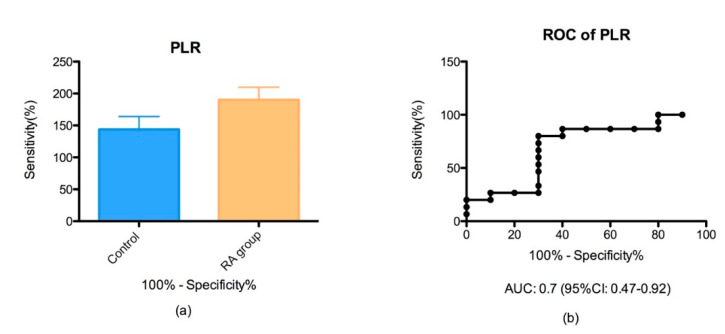
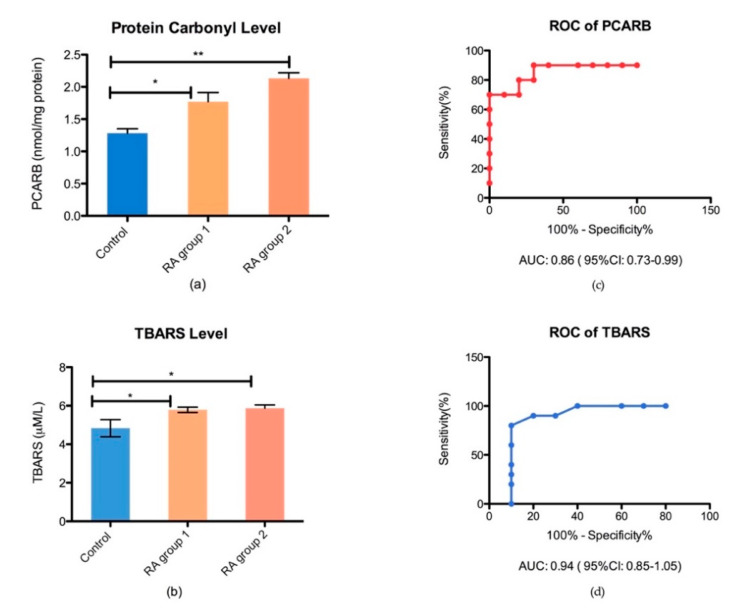
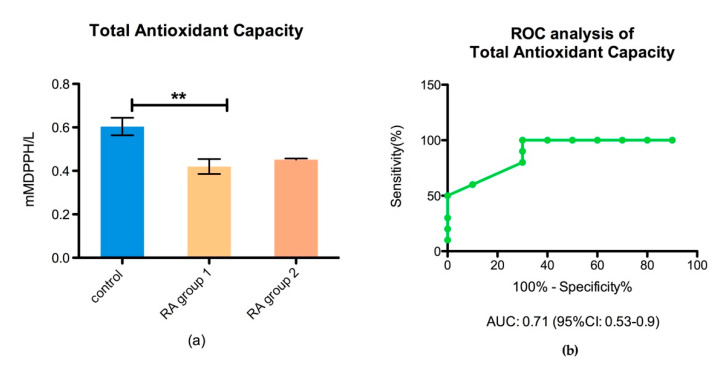
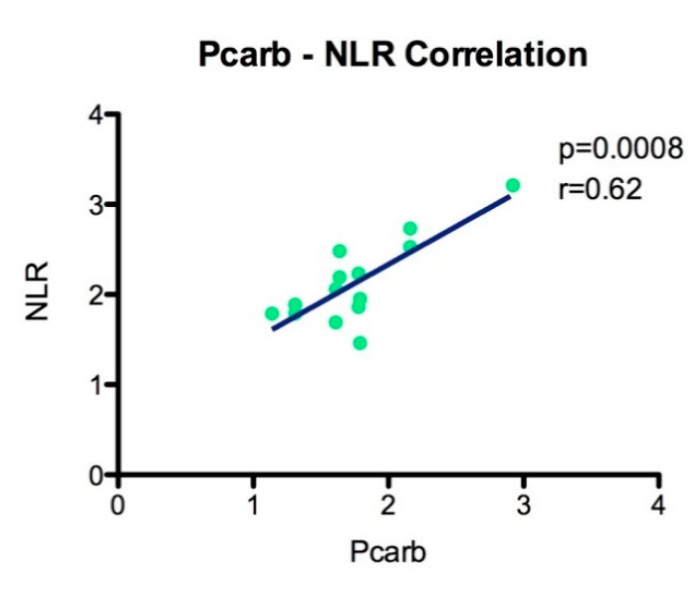
Rheumatoid arthritis (RA) is a chronic progressive autoimmune disease, associated with significant morbidity, mainly due to progressive damage and consequent disability. Oxidative stress is an important part of RA pathophysiology, as in autoimmune disease the interaction between immune response and endogenous/exogenous antigens subsequently induce the production of reactive oxygen species. The oxidative stress process seems to be positively strongly correlated with inflammation and accelerated joint destruction. We were asking ourselves if the oxidative stress biomarkers are the mirror tools of disease activity, outcome, and inflammation level in a group of RA patients under standard or biological therapy compared to healthy age-matched controls. In order to do this, the oxidative stress damage biomarkers (lipids peroxide and protein carbonyl level), antioxidant defense capacity, and pro-inflammatory status of plasma were quantified. In this study, we took into account the complete picture of RA diseases and assessed, for the first time, the inflammatory level in correlation with the oxidative stress level and antioxidant capacity of RA patients. Our results revealed that protein oxidation through carbonylation is significantly increased in RA groups compared to controls, and both protein carbonyl Pcarb and thiobarbituric acid reactive substance (TBARS) are reliable markers of ROS damage. Therefore, it is unanimous that neutrophil/lymphocyte ratio (NLR), monocyte/lymphocyte ratio ( MLR), platelet/lymphocyte ratio (PltLR) correlated with Pcarb, and TBARS can provide a view of the complex phenomenon represented by proteins/lipids damage, key contributors to disease outcome, and an increased awareness should be attributed to these biomarkers.
Keywords: autoimmune diseases; biomarkers; inflammation; oxidative stress; rheumatoid arthritis.
Conflict of interest statement
The authors declare no conflict of interest.
Figures
References
-
- Scrivo R., Perricone C., Altobelli A., Castellani C., Tinti L., Conti F., Valesini G. Dietary Habits Bursting into the Complex Pathogenesis of Autoimmune Diseases: The Emerging Role of Salt from Experimental and Clinical Studies. Nutrition. 2019;11:1013. doi: 10.3390/nu11051013. - DOI - PMC - PubMed
-
- De Rasmo D., Ferretta A., Russo S., Ruggieri M., Lasorella P., Paolicelli D., Trojano M., Signorile A. PBMC of Multiple Sclerosis Patients Show Deregulation of OPA1 Processing Associated with Increased ROS and PHB2 Protein Levels. Biomedicines. 2020;8:85. doi: 10.3390/biomedicines8040085. - DOI - PMC - PubMed
-
- Long N.P., Park S., Anh N.H., Min J.E., Yoon S.J., Kim H.M., Nghi T.D., Lim D.K., Park J.H., Lim J., et al. Efficacy of Integrating a Novel 16-Gene Biomarker Panel and Intelligence Classifiers for Differential Diagnosis of Rheumatoid Arthritis and Osteoarthritis. J. Clin. Med. 2019;8:50. doi: 10.3390/jcm8010050. - DOI - PMC - PubMed
LinkOut - more resources
Full Text Sources
Other Literature Sources
