Review
. 2020 May 15;11(5):556.
doi: 10.3390/genes11050556.

Histone Deacetylases (HDACs): Evolution, Specificity, Role in Transcriptional Complexes, and Pharmacological Actionability

Affiliations
Review

Histone Deacetylases (HDACs): Evolution, Specificity, Role in Transcriptional Complexes, and Pharmacological Actionability

Giorgio Milazzo et al. Genes (Basel). .

Abstract

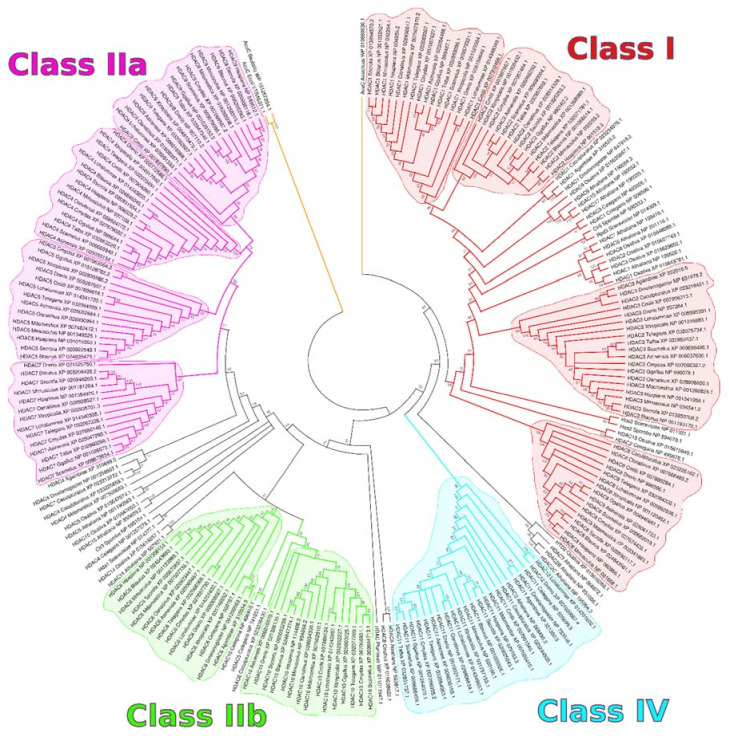
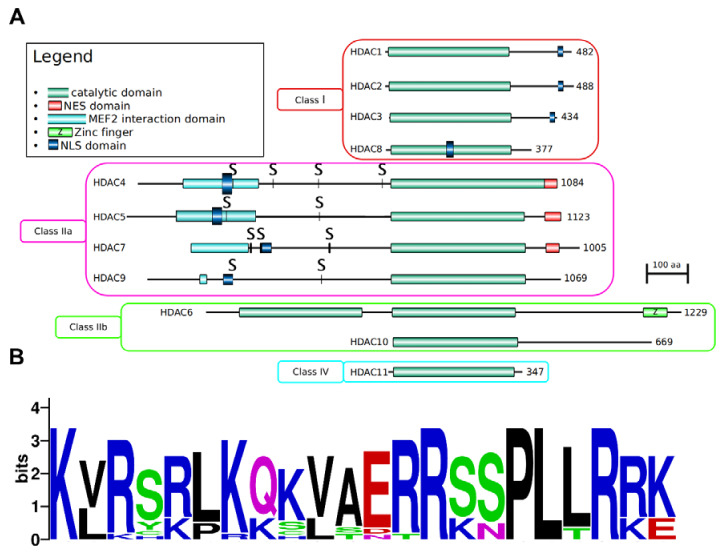
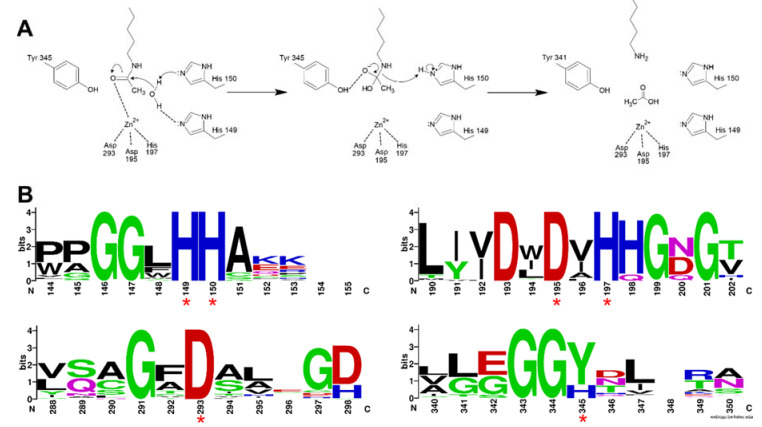
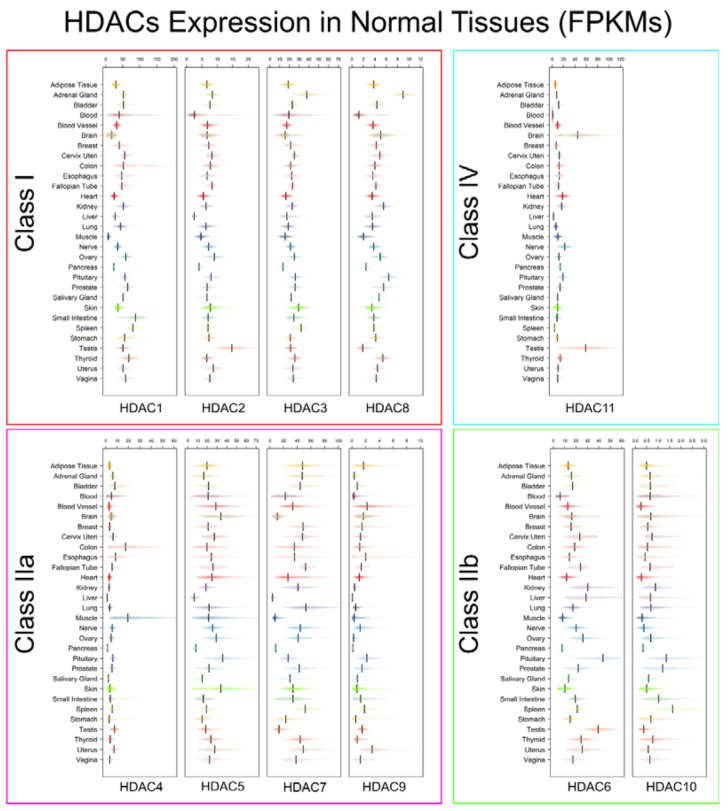
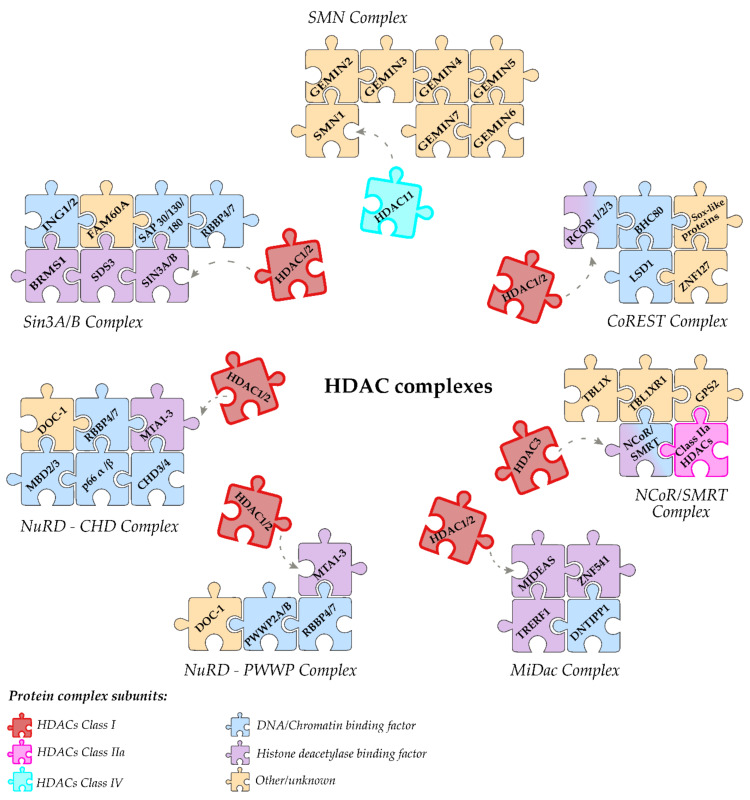
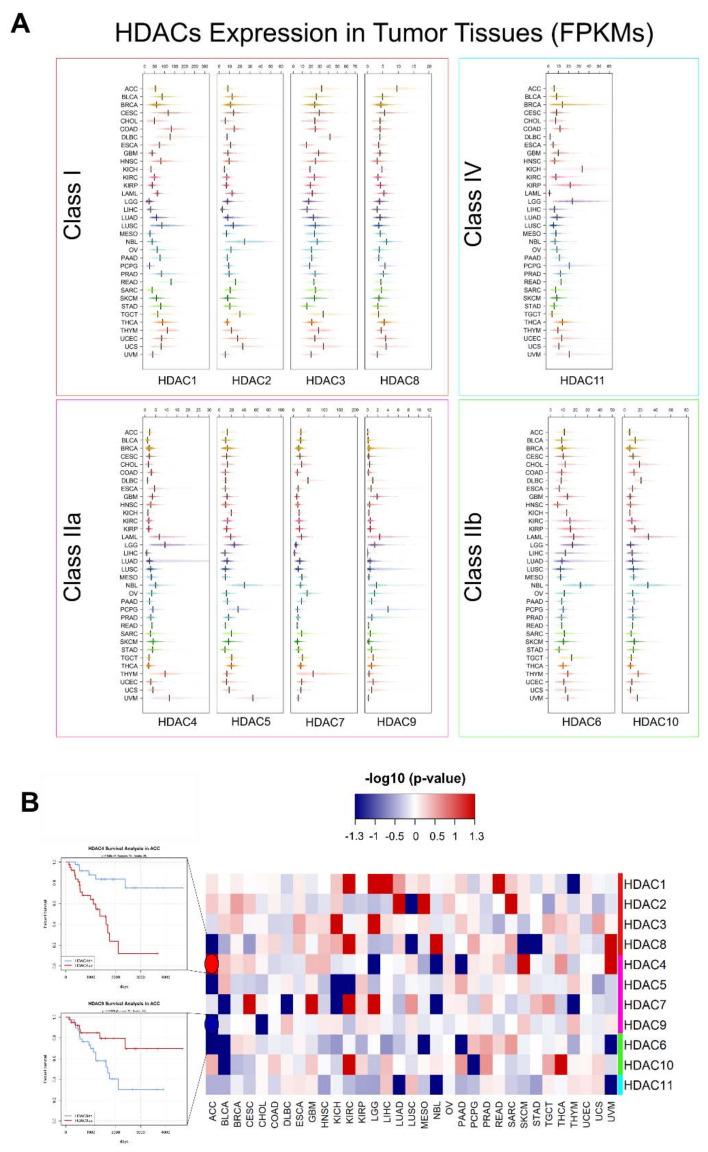
Histone deacetylases (HDACs) are evolutionary conserved enzymes which operate by removing acetyl groups from histones and other protein regulatory factors, with functional consequences on chromatin remodeling and gene expression profiles. We provide here a review on the recent knowledge accrued on the zinc-dependent HDAC protein family across different species, tissues, and human pathologies, specifically focusing on the role of HDAC inhibitors as anti-cancer agents. We will investigate the chemical specificity of different HDACs and discuss their role in the human interactome as members of chromatin-binding and regulatory complexes.

Keywords: HDAC; HDAC inhibitors; HDACi; cancer; chromatin; epigenetics; epigenomics; gene networks; histone deacetylases; phylogenesis.


Conflict of interest statement

The authors declare no conflict of interest.

Figures

Figure 1
Figure 1
Topological phylogenetic tree representation of 226 representatives of the HDAC protein family. The longest RefSeq protein isoform was selected for each separate gene locus. Multiple sequence alignment was performed using the MUSCLE algorithm [32]. Evolutionary distances were computed as the number of amino acid substitutions per site using the Poisson correction method [33]. The implementation of these algorithms and the visualization were achieved through MEGA X [34]. All 226 sequences used for the generation of this figure are available as Supplementary File S2, in FASTA format. Coloring of branches indicate the putative HDAC class: red for Class I, magenta for Class IIa, green for Class IIb, and cyan for Class IV. Colored areas delimit clades associated to each one of the 11 human HDACs.
Figure 2
Figure 2
(A) Domain architecture of HDAC proteins (human HDACs are used as reference). S indicate Serine residuals phosphorylated by CaM kinases [41]. (B) Sequence logo of Class IIa HDAC NLS sequence across human, mouse, chicken, and zebrafish proteins. Amino acid coloring indicates their predominant chemical property (blue: basic; red: acidic; green: polar; black: hydrophobic; purple: neutral). Logo generated with WebLogo [49].
Figure 3
Figure 3
Catalytic action of HDACs. (A) Proposed mechanism of acetyl-lysine hydrolysis catalyzed by HDACs. (B) Sequence conservation of four regions containing the key catalytic amino acids (red asterisks) between all HDACs of the model species used for the phylogenetic tree in Figure 1. Residue Y345 is replaced by an H only in vertebrate Class IIa HDACs.
Figure 4
Figure 4
Transcript levels of HDACs 1–11 in healthy tissues expressed in FPKM (fragments per kilobase of transcript length per million of mapped reads). Boxplots show the expression of Class I (red box), Class IIa (pink box), Class IIb (green box), and Class IV (aquamarine box) from normal samples in the GTEx Release V8 dataset. Expression was FPKM-normalized using the length of ENSEMBL longest isoform and RNA-Seq data from GTEx [105].
Figure 5
Figure 5
Schematic representation of the well characterized human HDAC-containing core complexes. Color schemes associated with HDACs subunits refer to sequence-based classification of HDACs described in this review. The recruitment of each HDAC in the core complex is depicted schematically with grey arrows that also identifying the HDAC-binding subunit. The HDAC1/2/11-binding subunit within each complex is indicated by the purple color. In addition, each complex contains multiple DNA/chromatin binding subunits indicated in blue. Finally, other subunits, where the biological function in each complex is still uncharacterized, are indicated by the sandy color. The puzzle piece representation and orientation does not reflect specific surface interaction regions. HDAC1/2 indicates 1 or 2, interchangeably (not as a heterodimer).
Figure 6
Figure 6
(A) Transcript levels of HDACs 1–11 in tumor tissues expressed in FPKM. Boxplots shows the expression of Class I (red box), Class IIa (pink box), Class IIb (green box), and Class IV (aquamarine box) from tumor samples in the pan-cancer TCGA dataset [187]. Tumor types are: ACC, adrenocortical carcinoma; BLCA, bladder urothelial carcinoma; BRCA, breast invasive carcinoma; CESC, cervical squamous cell carcinoma and endocervical adenocarcinoma; CHOL, cholangiocarcinoma; COAD, colon adenocarcinoma; DLBC, lymphoid neoplasm diffuse large B-cell lymphoma; ESCA, esophageal carcinoma; GBM, glioblastoma multiforme; HNSC, head and neck squamous cell carcinoma; KICH, kidney chromophobe; KIRC, kidney renal clear cell carcinoma; KIRP, kidney renal papillary cell carcinoma; LAML, acute myeloid leukemia; LGG, brain lower grade glioma; LIHC, liver hepatocellular carcinoma; LUAD, lung adenocarcinoma; LUSC, lung squamous cell carcinoma; MESO, mesothelioma; OV, ovarian serous cystadenocarcinoma; NBL, TARGET-neuroblastoma [188]; PAAD, pancreatic adenocarcinoma; PCPG, pheochromocytoma and paraganglioma; PRAD, prostate adenocarcinoma; READ, rectum adenocarcinoma; SARC, sarcoma; SKCM, skin cutaneous melanoma; STAD, stomach adenocarcinoma; TGCT, testicular germ cell tumors; THYM, thymoma; THCA, thyroid carcinoma; UCS, uterine carcinosarcoma; UCEC, uterine corpus endometrial carcinoma, UVM, uveal melanoma. Expression was FPKM-normalized using the length of ENSEMBL longest isoform and RNA-Seq data from TCGA. (B) Integrated HDAC survival analysis across tumors. Color intensity in the heatmap is proportional to -log10(p-value), a threshold of |1.3| corresponds to a p-value = 0.05. Red boxes in the heatmap correspond to a worse OS when the corresponding HDAC is upregulated, while blue boxes mean a better OS in case of upregulation, as shown by example survival curves (left side).

References

    1. Gregoretti I.V., Lee Y.-M., Goodson H.V. Molecular evolution of the histone deacetylase family: Functional implications of phylogenetic analysis. J. Mol. Biol. 2004;338:17–31. doi: 10.1016/j.jmb.2004.02.006. - DOI - PubMed
    1. Ceccacci E., Minucci S. Inhibition of histone deacetylases in cancer therapy: Lessons from leukaemia. Br. J. Cancer. 2016;114:605–611. doi: 10.1038/bjc.2016.36. - DOI - PMC - PubMed
    1. Mercatelli D., Scalambra L., Triboli L., Ray F., Giorgi F.M. Gene regulatory network inference resources: A practical overview. Biochim. Biophys. Acta Gene Regul. Mech. 2020;1863:194430. doi: 10.1016/j.bbagrm.2019.194430. - DOI - PubMed
    1. Haberland M., Montgomery R.L., Olson E.N. The many roles of histone deacetylases in development and physiology: Implications for disease and therapy. Nat. Rev. Genet. 2009;10:32–42. doi: 10.1038/nrg2485. - DOI - PMC - PubMed
    1. Karpac J., Jasper H. Metabolic homeostasis: HDACs take center stage. Cell. 2011;145:497–499. doi: 10.1016/j.cell.2011.04.017. - DOI - PMC - PubMed

Publication types

MeSH terms