. 2020 May 16;12(5):1256.
doi: 10.3390/cancers12051256.

Detecting Endometrial Cancer by Blood Spectroscopy: A Diagnostic Cross-Sectional Study

Affiliations

Detecting Endometrial Cancer by Blood Spectroscopy: A Diagnostic Cross-Sectional Study

Maria Paraskevaidi et al. Cancers (Basel). .

Abstract

Endometrial cancer is the sixth most common cancer in women, with a rising incidence worldwide. Current approaches for the diagnosis and screening of endometrial cancer are invasive, expensive or of moderate diagnostic accuracy, limiting their clinical utility. There is a need for cost-effective and minimally invasive approaches to facilitate the early detection and timely management of endometrial cancer. We analysed blood plasma samples in a cross-sectional diagnostic accuracy study of women with endometrial cancer (n = 342), its precursor lesion atypical hyperplasia (n = 68) and healthy controls (n = 242, total n = 652) using attenuated total reflection-Fourier transform infrared (ATR-FTIR) spectroscopy and machine learning algorithms. We show that blood-based infrared spectroscopy has the potential to detect endometrial cancer with 87% sensitivity and 78% specificity. Its accuracy is highest for Type I endometrial cancer, the most common subtype, and for atypical hyperplasia, with sensitivities of 91% and 100%, and specificities of 81% and 88%, respectively. Our large-cohort study shows that a simple blood test could enable the early detection of endometrial cancer of all stages in symptomatic women and provide the basis of a screening tool in high-risk groups. Such a test has the potential not only to differentially diagnose endometrial cancer but also to detect its precursor lesion atypical hyperplasia-the early recognition of which may allow fertility sparing management and cancer prevention.

Keywords: blood diagnostics; endometrial cancer; screening; spectroscopy.


Conflict of interest statement

The authors declare no potential conflicts of interest.

Figures
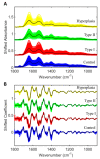
Figure 1
Figure 1
Infrared spectral data for the healthy controls (n = 242), Type I cancers (n = 258), Type II cancers (n = 64) and atypical endometrial hyperplasia (n = 68) at the fingerprint region (1800–900 cm−1). (A) Raw infrared spectra for the different classes. (B) Pre-processed spectra after 2nd Savitzky–Golay (SG) derivative (window of 5 points, 2nd-order polynomial fitting) and vector normalization. Coloured lines denote all spectra, while black line shows the average spectrum.
Figure 2
Figure 2
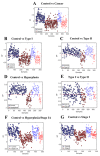
Discriminant function (DF) graphs showing the differences and similarities between the different classes after supervised partial least squared discriminant analysis (PLS-DA). (A) Control (n = 242) vs. cancer (n = 342; including Type I (n = 258), Type II (n = 64) and mixed (n = 20)). (B) Control (n = 242) vs. Type I cancers (n = 258). (C) Control (n = 242) vs. Type II (n=64) cancers. (D) Control (n = 242) vs. hyperplasia (n = 68). (E) Type I (n = 258) vs. Type II cancers (n = 64). (F) Control (n = 242) vs. hyperplasia/Stage IA (n = 260). (G) Control (n = 242) vs. Stage I (n = 254). o: training samples; *: test samples.
Figure 3
Figure 3
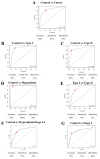
Receiver operating characteristic (ROC) curves along with overall accuracies, sensitivities, specificities and area under the curve (AUC) values after supervised partial least squares discriminant analysis (PLS-DA). (A) Control (n = 242) vs. cancer (n = 342; including Type I (n = 258), Type II (n = 64) and mixed (n = 20)). (B) Control (n = 242) vs. Type I cancers (n = 258). (C) Control (n = 242) vs. Type II (n = 64) cancers. (D) Control (n = 242) vs. hyperplasia (n = 68). (E) Type I (n = 258) vs. Type II cancers (n = 64). (F) Control (n = 242) vs. hyperplasia/Stage IA cancer (n = 260). (G) Control (n = 242) vs. Stage I cancer (n = 254). The red circle denotes the cut-off point for the optimal compromise between sensitivity and specificity.
Figure 4
Figure 4
The six most discriminatory peaks for each subgroup analysis detected after partial least squared discriminant analysis (PLS-DA). The differences in the absorbance levels are given as the mean ± standard deviation and were calculated after automatic weighted least squares baseline correction and vector normalization. * p < 0.05; ** p < 0.005.
Figure 5
Figure 5
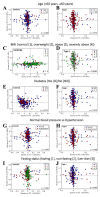
Score plots generated after unsupervised principal component analysis (PCA) to visualize differences and similarities according to confounding factors. (A,B) Score plots according to age (<60 years; ≥60 years) for controls (A) and Type I cancers (B). (C,D) Score plots according to BMI (normal: BMI = 18.5–24.9; overweight: BMI = 25–29.9; obese: BMI = 30–39.9; severely obese: BMI > 40) for controls (C) and Type I cancers (D). (E,F) Score plots according to diabetes (diabetic; non-diabetic) for controls (E) and Type I cancers (F). (G,H) Score plots according to fasting status (fasting; non-fasting; liver diet) for controls (G) and Type I cancers (H). (I,J) Score plots according to blood pressure (normal; hypertension) for controls (I) and Type I cancers (J).

References

    1. Lortet-Tieulent J., Ferlay J., Bray F., Jemal A. International Patterns and Trends in Endometrial Cancer Incidence, 1978–2013. J. Natl. Cancer Inst. 2018;110:354–361. doi: 10.1093/jnci/djx214. - DOI - PubMed
    1. Cancer Research, UK. [(accessed on 12 May 2020)]; Available online: https://www.cancerresearchuk.org/health-professional/cancer-statistics/s....
    1. Bray F., Ferlay J., Soerjomataram I., Siegel R.L., Torre L.A., Jemal A. Global cancer statistics 2018: GLOBOCAN estimates of incidence and mortality worldwide for 36 cancers in 185 countries. CA Cancer J. Clin. 2018;68:394–424. doi: 10.3322/caac.21492. - DOI - PubMed
    1. Kitson S.J., Lindsay J., Sivalingam V.N., Rutter M.K., Crosbie E.J. High prevalence of metabolic syndrome in women newly diagnosed with endometrial cancer. Gynecol. Oncol. Rep. 2018;26:109–110. doi: 10.1016/j.gore.2018.08.006. - DOI - PMC - PubMed
    1. Morice P., Leary A., Creutzberg C., Abu-Rustum N., Darai E. Endometrial cancer. Lancet. 2016;387:1094–1108. doi: 10.1016/S0140-6736(15)00130-0. - DOI - PubMed

LinkOut - more resources