

Green Tea Seed Isolated Theasaponin E1 Ameliorates AD Promoting Neurotoxic Pathogenesis by Attenuating Aβ Peptide Levels in SweAPP N2a Cells
- PMID: 32429462
- PMCID: PMC7288209
- DOI: 10.3390/molecules25102334
Green Tea Seed Isolated Theasaponin E1 Ameliorates AD Promoting Neurotoxic Pathogenesis by Attenuating Aβ Peptide Levels in SweAPP N2a Cells
Abstract
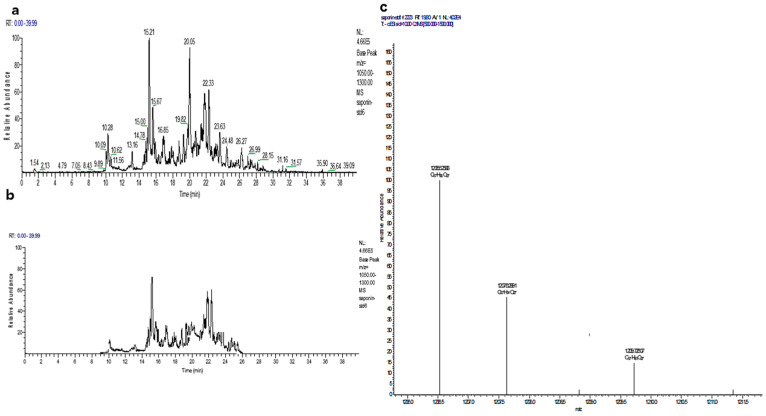
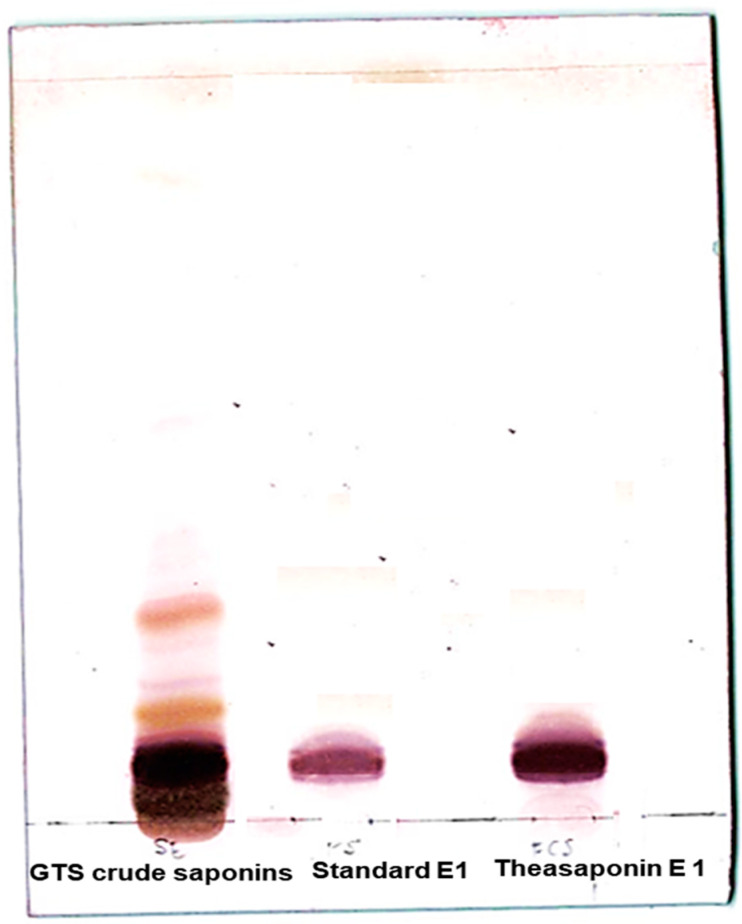
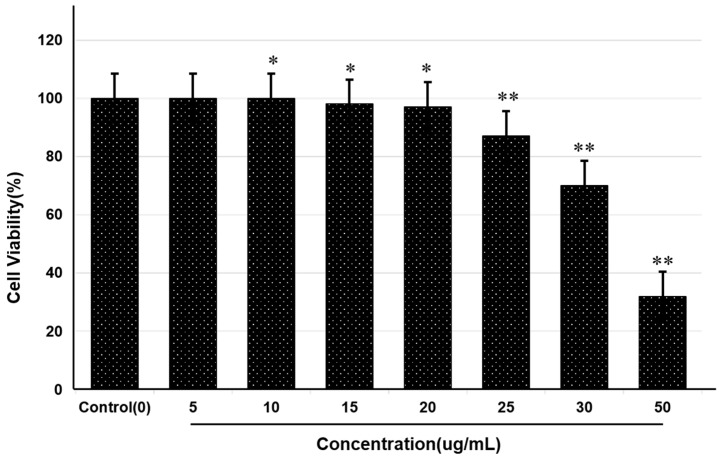
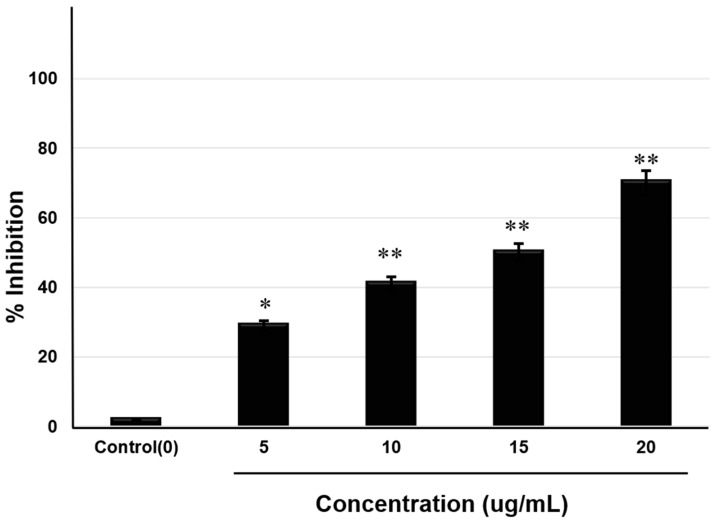
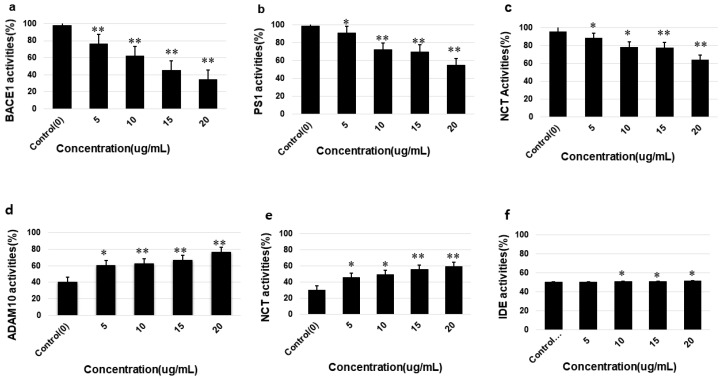
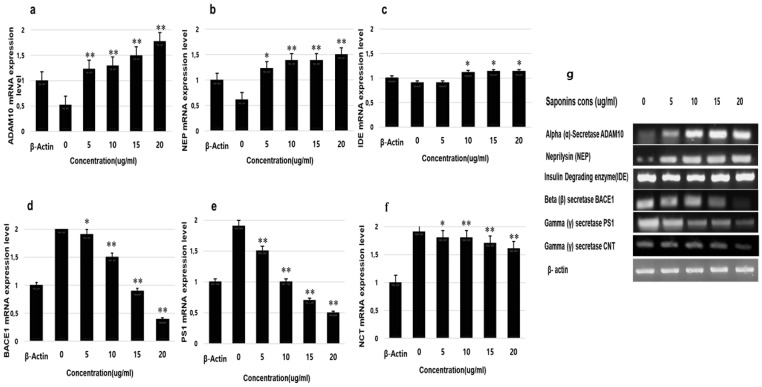
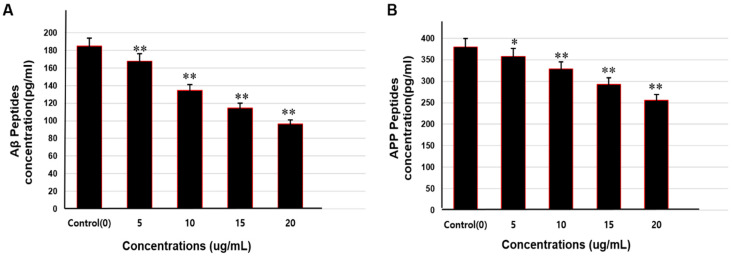
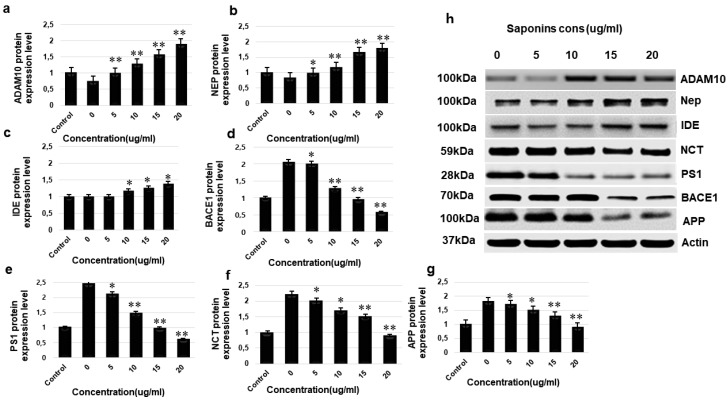
Alzheimer's disease (AD) is the most frequent type of dementia affecting memory, thinking and behaviour. The major hallmark of the disease is pathological neurodegeneration due to abnormal aggregation of Amyloid beta (Aβ) peptides generated by β- and γ-secretases via amyloidogenic pathway. Purpose of the current study was to evaluate the effects of theasaponin E1 on the inhibition of Aβ producing β-, γ-secretases (BACE1, PS1 and NCT) and acetylcholinesterase and activation of the non-amyloidogenic APP processing α-secretase (ADAM10). Additionally, theasaponin E1 effects on Aβ degrading and clearing proteins neprilysin and insulin degrading enzyme (IDE). The effect of theasaponin E1 on these crucial enzymes was investigated by RT-PCR, ELISA, western blotting and fluorometric assays using mouse neuroblastoma cells (SweAPP N2a). theasaponin E1 was extracted and purified from green tea seed extract via HPLC, and N2a cells were treated with different concentrations for 24 h. Gene and protein expression in the cells were measured to determine the effects of activation and/or inhibition of theasaponin E1 on β- and γ-secretases, neprilysin and IDE. Results demonstrated that theasaponin E1 significantly reduced Aβ concentration by activation of the α-secretase and neprilysin. The activities of β- and γ-secretase were reduced in a dose-dependent manner due to downregulation of BACE1, presenilin, and nicastrin. Similarly, theasaponin E1 significantly reduced the activity of acetylcholinesterase. Overall, from the results it is concluded that green tea seed extracted saponin E1 possess therapeutic significance as a neuroprotective natural product recommended for the treatment of Alzheimer's disease.
Keywords: Alzheimer’s disease; SweAPP N2a cells; amyloid precursor proteins; amyloidogenic pathway; theasaponin E1; α-secretase.
Conflict of interest statement
All authors of this manuscript declare that they have no conflict of interest.
Figures
Similar articles
-
Effects of Folic Acid on Secretases Involved in Aβ Deposition in APP/PS1 Mice.Nutrients. 2016 Sep 9;8(9):556. doi: 10.3390/nu8090556. Nutrients. 2016. PMID: 27618097 Free PMC article.
-
Melatonin regulates the transcription of βAPP-cleaving secretases mediated through melatonin receptors in human neuroblastoma SH-SY5Y cells.J Pineal Res. 2015 Oct;59(3):308-20. doi: 10.1111/jpi.12260. Epub 2015 Jul 18. J Pineal Res. 2015. PMID: 26123100
-
Mitochondria are devoid of amyloid β-protein (Aβ)-producing secretases: Evidence for unlikely occurrence within mitochondria of Aβ generation from amyloid precursor protein.Biochem Biophys Res Commun. 2017 Apr 29;486(2):321-328. doi: 10.1016/j.bbrc.2017.03.035. Epub 2017 Mar 14. Biochem Biophys Res Commun. 2017. PMID: 28302486
-
BACE1: the beta-secretase enzyme in Alzheimer's disease.J Mol Neurosci. 2004;23(1-2):105-14. doi: 10.1385/JMN:23:1-2:105. J Mol Neurosci. 2004. PMID: 15126696 Review.
-
Aberrant proteolytic processing and therapeutic strategies in Alzheimer disease.Adv Biol Regul. 2017 May;64:33-38. doi: 10.1016/j.jbior.2017.01.001. Epub 2017 Jan 5. Adv Biol Regul. 2017. PMID: 28082052 Review.
Cited by
-
Neuroprotective Effects of Green Tea Seed Isolated Saponin Due to the Amelioration of Tauopathy and Alleviation of Neuroinflammation: A Therapeutic Approach to Alzheimer's Disease.Molecules. 2022 Mar 24;27(7):2079. doi: 10.3390/molecules27072079. Molecules. 2022. PMID: 35408478 Free PMC article.
-
Therapeutic Candidates for Alzheimer's Disease: Saponins.Int J Mol Sci. 2023 Jun 22;24(13):10505. doi: 10.3390/ijms241310505. Int J Mol Sci. 2023. PMID: 37445682 Free PMC article. Review.
-
Imidazopyridazine Acetylcholinesterase Inhibitors Display Potent Anti-Proliferative Effects in the Human Neuroblastoma Cell-Line, IMR-32.Molecules. 2021 Sep 1;26(17):5319. doi: 10.3390/molecules26175319. Molecules. 2021. PMID: 34500749 Free PMC article.
-
Neuroprotective Potential of Seed Extracts: Review of In Vitro and In Vivo Studies.Nutrients. 2023 May 27;15(11):2502. doi: 10.3390/nu15112502. Nutrients. 2023. PMID: 37299465 Free PMC article. Review.
-
Caesalpinia mimosoides Leaf Extract Promotes Neurite Outgrowth and Inhibits BACE1 Activity in Mutant APP-Overexpressing Neuronal Neuro2a Cells.Pharmaceuticals (Basel). 2021 Sep 4;14(9):901. doi: 10.3390/ph14090901. Pharmaceuticals (Basel). 2021. PMID: 34577601 Free PMC article.
References
MeSH terms
Substances
LinkOut - more resources
Full Text Sources
