. 2020 May 16;12(5):329.
doi: 10.3390/toxins12050329.

Multi-Stress Induction of the Mycobacterium tuberculosis MbcTA Bactericidal Toxin-Antitoxin System

Affiliations

Multi-Stress Induction of the Mycobacterium tuberculosis MbcTA Bactericidal Toxin-Antitoxin System

Kanchiyaphat Ariyachaokun et al. Toxins (Basel). .

Abstract

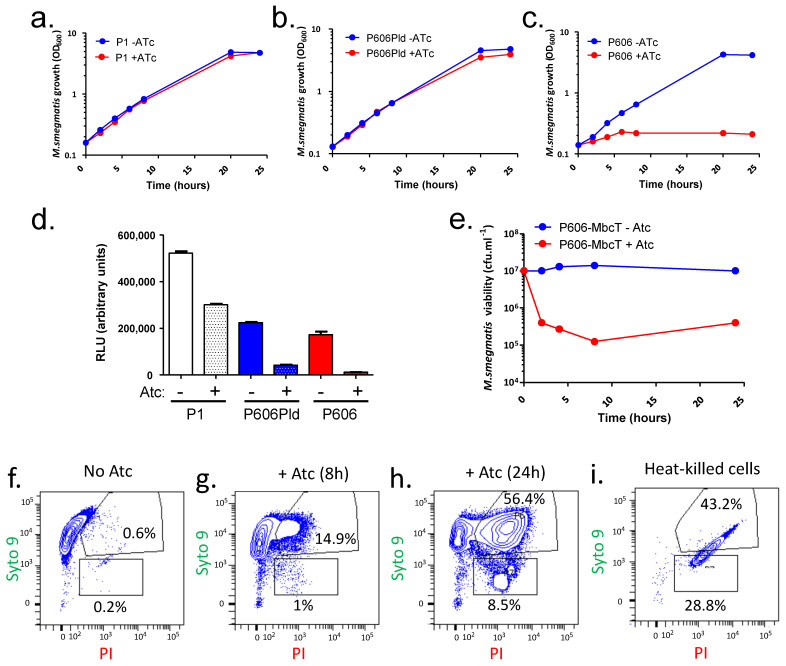
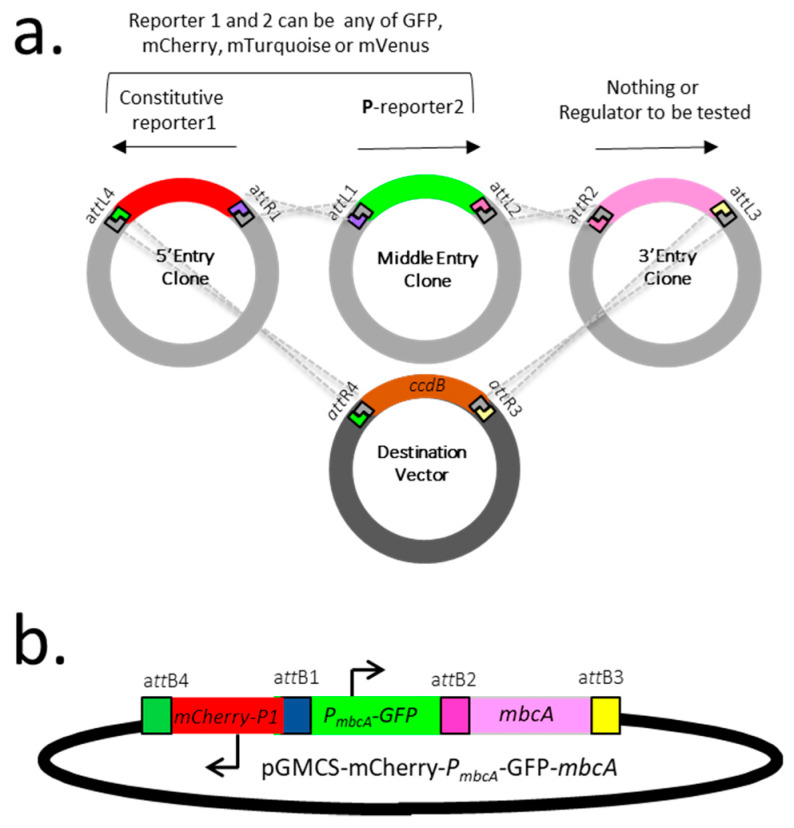
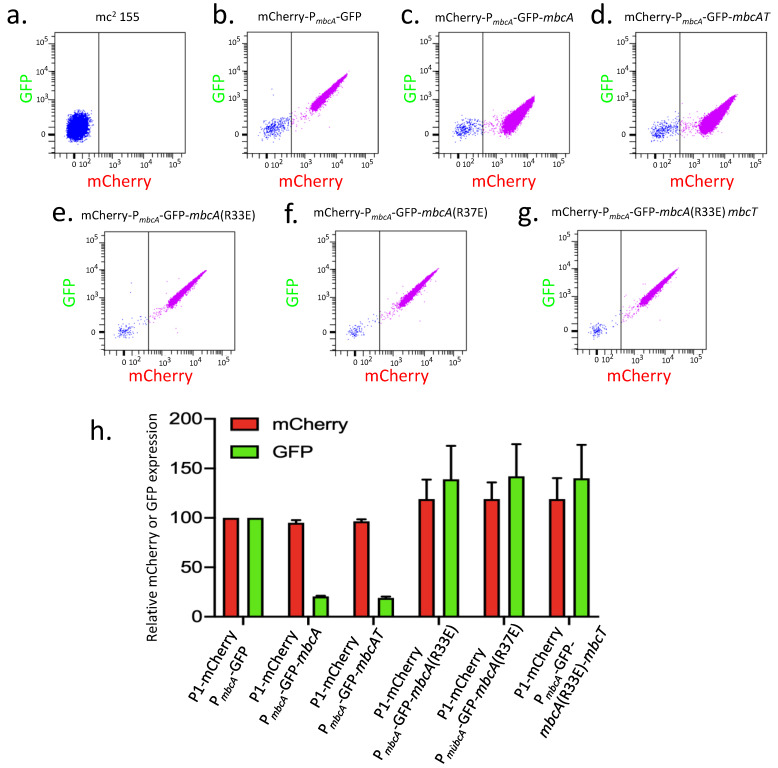
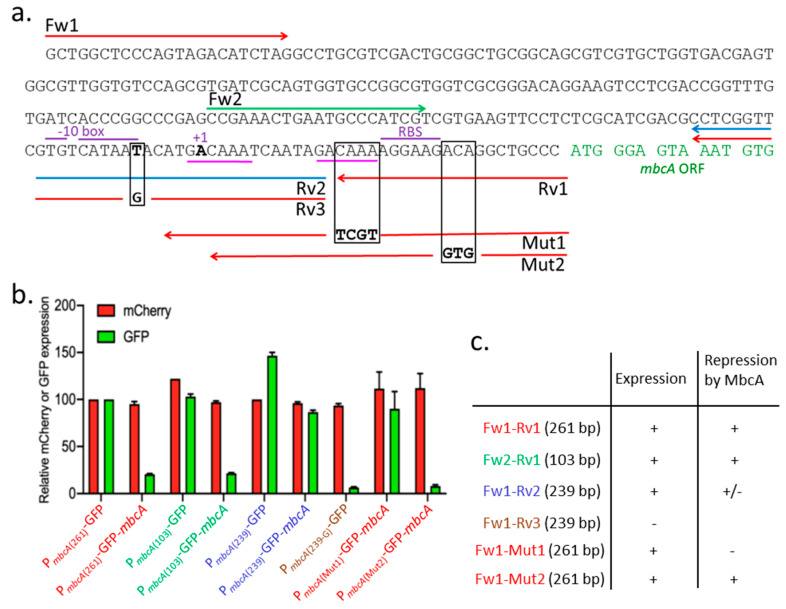
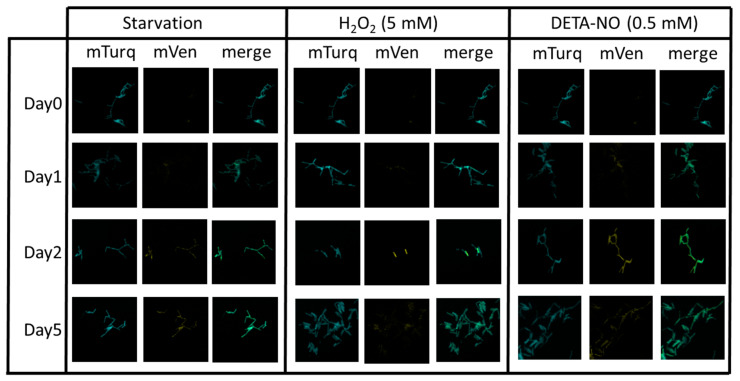
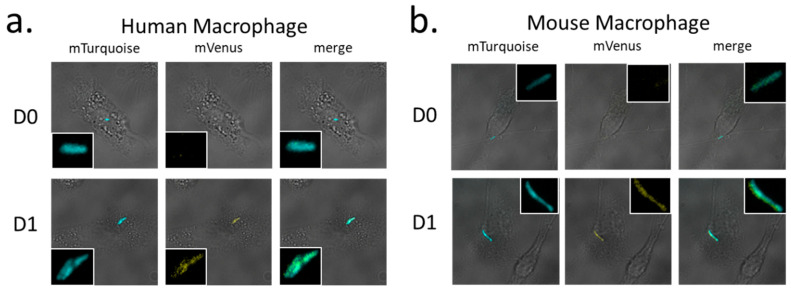
MbcTA is a type II toxin/antitoxin (TA) system of Mycobacterium tuberculosis. The MbcT toxin triggers mycobacterial cell death in vitro and in vivo through the phosphorolysis of the essential metabolite NAD+ and its bactericidal activity is neutralized by physical interaction with its cognate antitoxin MbcA. Therefore, the MbcTA system appears as a promising target for the development of novel therapies against tuberculosis, through the identification of compounds able to antagonize or destabilize the MbcA antitoxin. Here, the expression of the mbcAT operon and its regulation were investigated. A dual fluorescent reporter system was developed, based on an integrative mycobacterial plasmid that encodes a constitutively expressed reporter, serving as an internal standard for monitoring mycobacterial gene expression, and an additional reporter, dependent on the promoter under investigation. This system was used both in M. tuberculosis and in the fast growing model species Mycobacterium smegmatis to: (i) assess the autoregulation of mbcAT; (ii) perform a genetic dissection of the mbcA promoter/operator region; and (iii) explore the regulation of mbcAT transcription from the mbcA promoter (PmbcA) in a variety of stress conditions, including in vivo in mice and in macrophages.

Keywords: NAD+; bacterial cell death; stress-response; toxin-antitoxin systems; tuberculosis.


Conflict of interest statement

The authors declare no conflict of interest.

Figures

Figure 1
Figure 1
The toxin MbcT depletes NAD+ and is bactericidal in Mycobacterium smegmatis. (ac) Cultures of M. smegmatis strain mc2 155 transformed with plasmids producing MbcT under the control of the indicated promoter were diluted at time 0 in fresh medium supplemented with streptomycin alone (blue) or streptomycin and 200 ng.mL−1 anhydro-tetracycline (Atc) (red) and bacterial growth was followed over up to 24 h. (d) Samples of the M. smegmatis cultures were harvested after 8 h of treatment and relative content of NAD+ was measured in cell extracts. Values are representative of two independent replicates of the same experiment. (e) Samples of the cultures of M. smegmatis mc2 155/pGMCS-TetR-P606-mbcT were harvested at the indicated times, diluted, and plated on L agar. Colonies were counted after 3 days of growth at 37 °C. (fh) Samples of the cultures of mc2 155/pGMCS-TetR-P606-mbcT were harvested after 8 or 24 h of treatment with Atc, labeled with the LIVE/DEAD BacLight dyes (Syto9 and Propidium Iodide (PI)) and analyzed by flow cytometry (FACS). (i) Cells grown without Atc were heat-killed at 98 °C for 30 min before LIVE/DEAD labeling and FACS analysis. Data are representative of two experiments with similar results.
Figure 2
Figure 2
A dual florescent protein reporter system developed for studying gene expression in mycobacteria. (a). Gateway cloning strategy used to construct the required plasmids. (b). Example of plasmid construction designed to analyze the expression and regulation of mbcAT. GFP = green fluorescent protein.
Figure 3
Figure 3
Autorepression of the mbcAT operon. (a)–(g) M. smegmatis mc2 155 wild-type and transformed with the indicated pGMCS-mCherry-PmbcA-GFP derivatives were grown to exponential phase in complete 7H9 medium and analyzed by flow cytometry. Blue and pink points separated by a vertical line indicate the cells negative or positive for mCherry fluorescence, respectively. (h) Mean fluorescence intensities (MFI) of the fluorescence positive cells (pink points) relative to that of the strain harboring pGMCS-mCherry-PmbcA-GFP (a) are reported for mCherry (red bars) and for GFP (green bars). Values are the average of two biological replicates with standard deviation.
Figure 4
Figure 4
Genetic analysis of the promoter/operator region of the mbcAT operon. (a) DNA sequence of the mbcA promoter/operator region. Arrows indicate oligonucleotides used to amplify various fragments encompassing the promoter region. Black squares surround the nucleotides modified by mutations introduced in the oligonucleotides Rv3 (T=>G), Mut1 (CAAA=>TCGT), and Mut2 (ACA=>GTG). +1 points to the transcription start site. (b) Mean fluorescence intensities (MFI) were determined by flow cytometry with strains harboring the different constructs. Red and green bars indicate MFI relative to that of strain harboring pGMCS-mCherry-PMbcA-GFP. Values are the average of two biological replicates with standard deviation. (c) Summary of the results obtained with the different constructs.
Figure 5
Figure 5
Effect of stress conditions on expression of the mbcAT operon in M. tuberculosis. Wild-type H37Rv transformed with plasmid pGMCS-P1-mTurq-PmbcA-mVenus-mbcA was grown in complete 7H9 medium. At day 0, cells were harvested and resuspended in phosphate saline buffer (PBS) buffer (starvation), or 7H9 medium supplemented with 5 mM H2O2 or 0.5 mM DETA/NO. At the indicated times, samples were harvested, fixed with 4% p-formaldehyde and observed by fluorescent microscopy using large field Leica DMIRB, magnification 630×.
Figure 6
Figure 6
Induction of the mbcAT operon expression in M. tuberculosis upon infection of macrophages. Mtb H37Rv/pGMCS-P1-mTurq-PmbcA-mVenus-mbcA was used to infect human (a) or mouse (b) macrophages at multiplicity of infection of 0.1. Infected cells were harvested at day 0 (D0) or 24 h post-infection (D1), fixed with 4% p-formaldehyde and observed by fluorescent microscopy using large field Leica DMIRB, magnification 630×. Images show the merged bright field and either the blue, yellow, or merged fluorescence. Insets show enlarged view of the phagocytized bacteria.

References

    1. Freire D.M., Gutierrez C., Garza-Garcia A., Grabowska A.D., Sala A.J., Ariyachaokun K., Panikova T., Beckham K.S.H., Colom A., Pogenberg V., et al. An NAD(+) Phosphorylase Toxin Triggers Mycobacterium tuberculosis Cell Death. Mol. Cell. 2019;73:1282–1291.e8. doi: 10.1016/j.molcel.2019.01.028. - DOI - PMC - PubMed
    1. Harms A., Brodersen D.E., Mitarai N., Gerdes K. Toxins, Targets, and Triggers: An Overview of Toxin-Antitoxin Biology. Mol. Cell. 2018;70:768–784. doi: 10.1016/j.molcel.2018.01.003. - DOI - PubMed
    1. Lobato-Marquez D., Diaz-Orejas R., Garcia-Del Portillo F. Toxin-antitoxins and bacterial virulence. FEMS Microbiol. Rev. 2016;40:592–609. doi: 10.1093/femsre/fuw022. - DOI - PubMed
    1. Page R., Peti W. Toxin-antitoxin systems in bacterial growth arrest and persistence. Nat. Chem. Biol. 2016;12:208–214. doi: 10.1038/nchembio.2044. - DOI - PubMed
    1. Deter H.S., Jensen R.V., Mather W.H., Butzin N.C. Mechanisms for Differential Protein Production in Toxin-Antitoxin Systems. Toxins. 2017;9:211. doi: 10.3390/toxins9070211. - DOI - PMC - PubMed

Publication types

MeSH terms

LinkOut - more resources