. 2020 May 19;12(1):69.
doi: 10.1186/s13148-020-00839-z.

Novel HDAC inhibitor MAKV-8 and imatinib synergistically kill chronic myeloid leukemia cells via inhibition of BCR-ABL/MYC-signaling: effect on imatinib resistance and stem cells

Affiliations

Novel HDAC inhibitor MAKV-8 and imatinib synergistically kill chronic myeloid leukemia cells via inhibition of BCR-ABL/MYC-signaling: effect on imatinib resistance and stem cells

Manon Lernoux et al. Clin Epigenetics. .

Abstract

Background: Chronic myeloid leukemia (CML) pathogenesis is mainly driven by the oncogenic breakpoint cluster region-Abelson murine leukemia viral oncogene homolog 1 (BCR-ABL) fusion protein. Since BCR-ABL displays abnormal constitutive tyrosine kinase activity, therapies using tyrosine kinase inhibitors (TKis) such as imatinib represent a major breakthrough for the outcome of CML patients. Nevertheless, the development of TKi resistance and the persistence of leukemia stem cells (LSCs) remain barriers to cure the disease, justifying the development of novel therapeutic approaches. Since the activity of histone deacetylase (HDAC) is deregulated in numerous cancers including CML, pan-HDAC inhibitors may represent promising therapeutic regimens for the treatment of CML cells in combination with TKi.

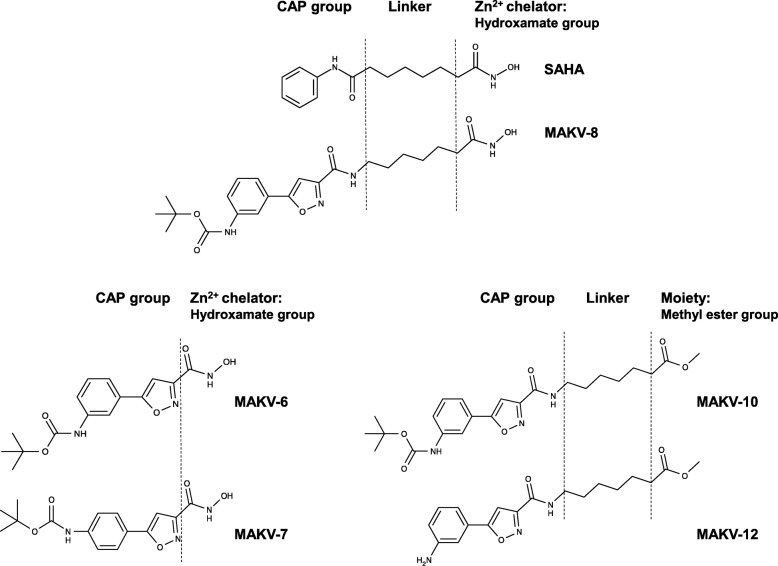
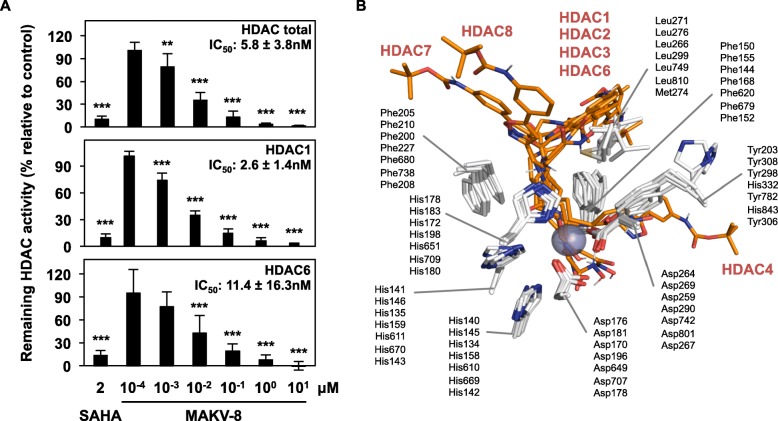
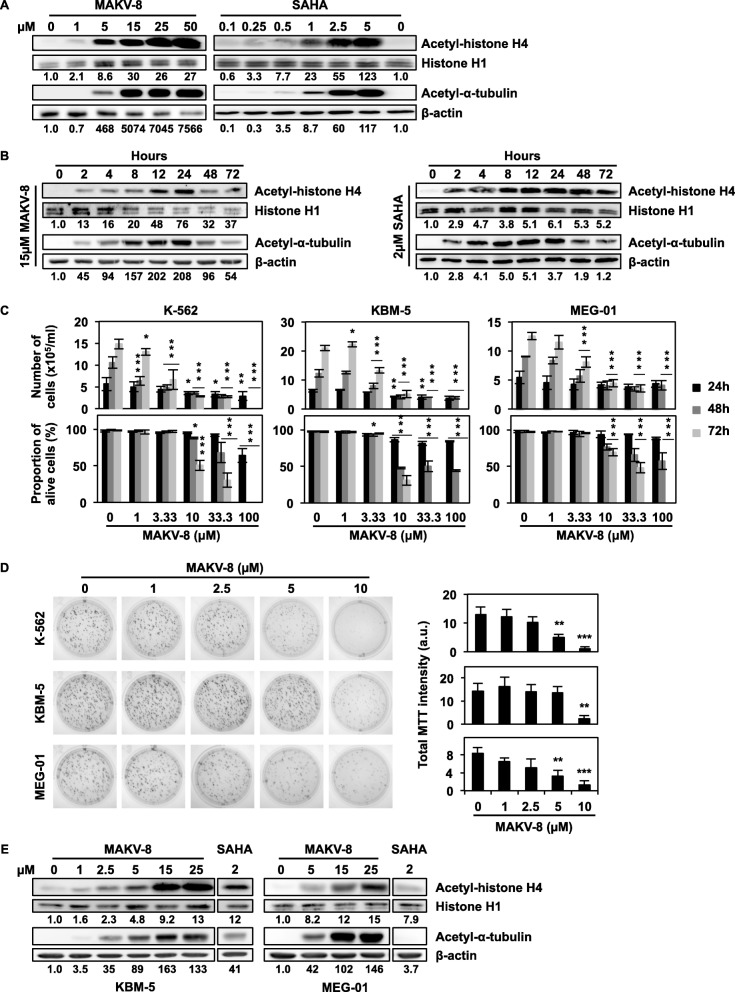
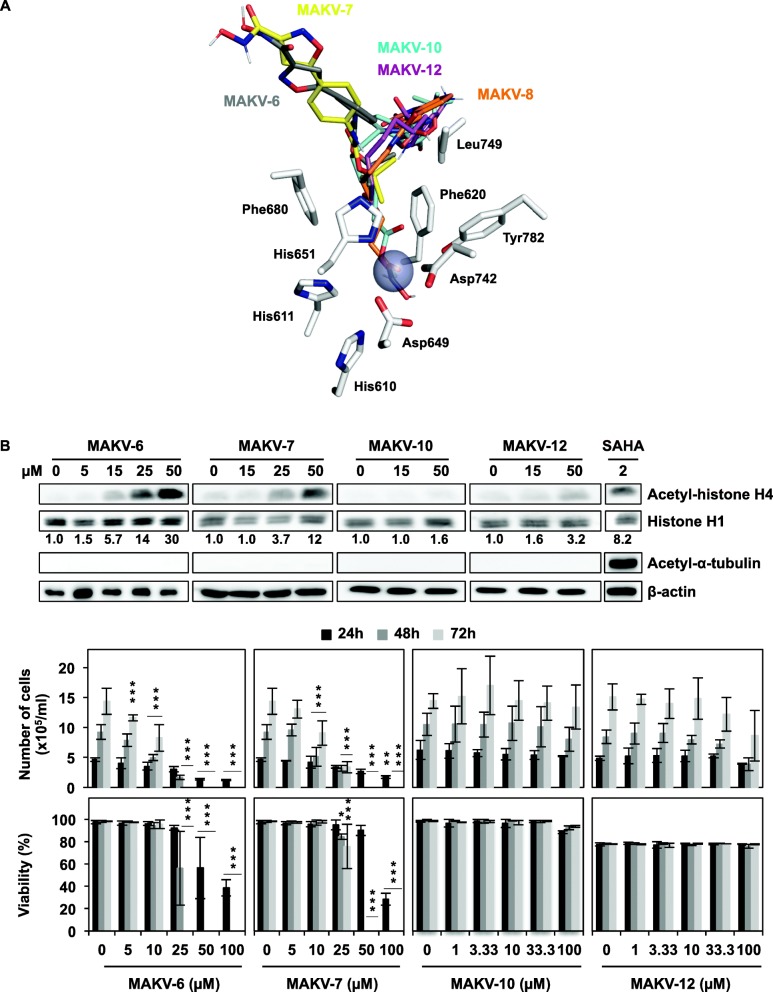
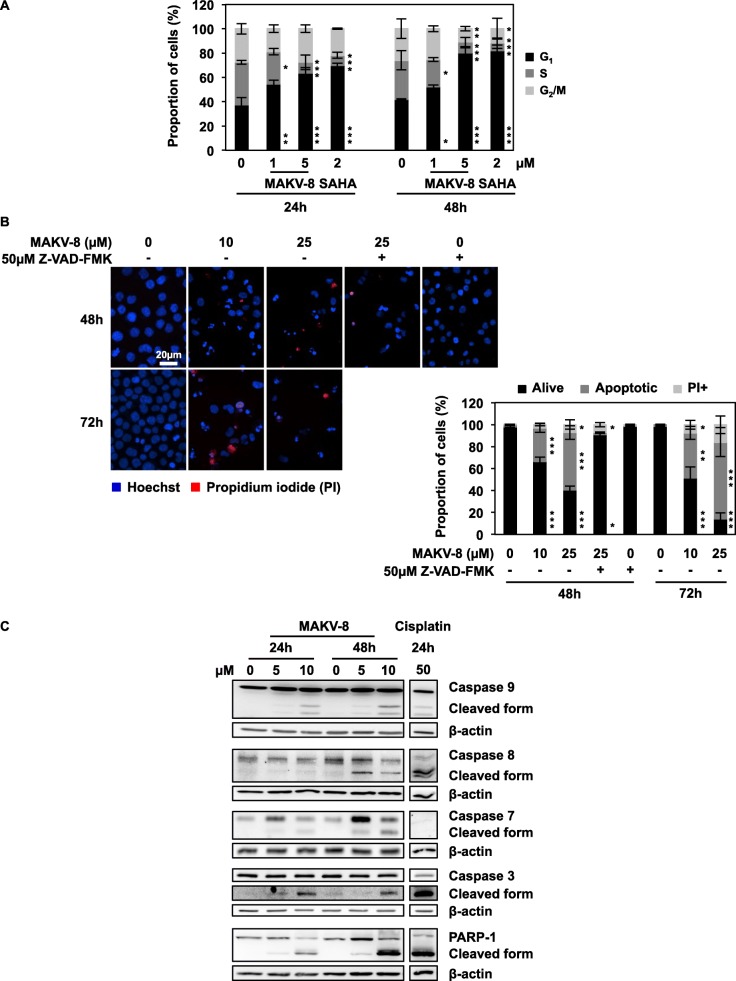
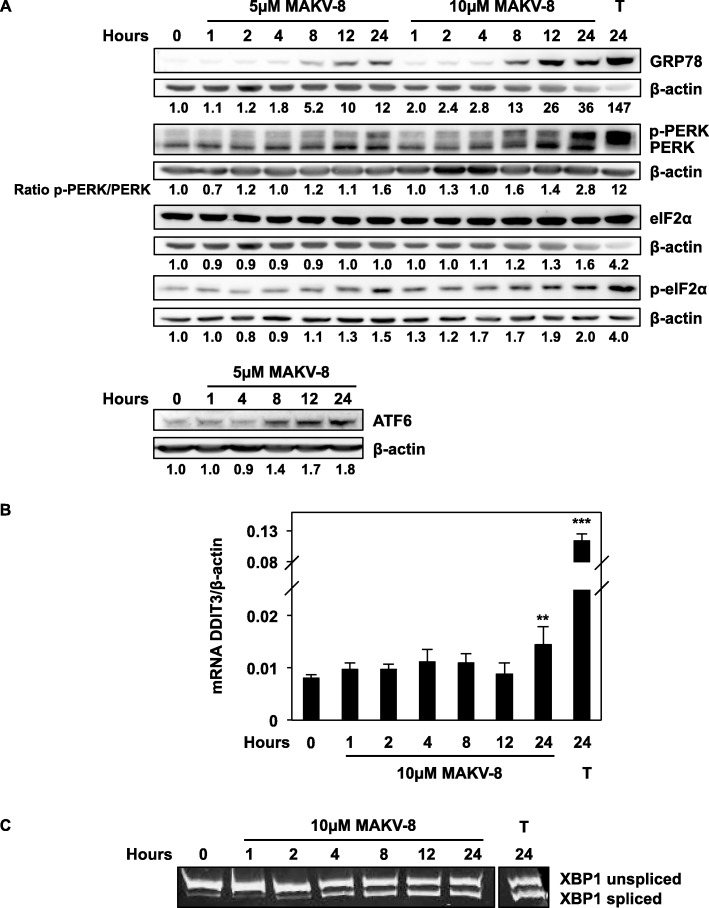
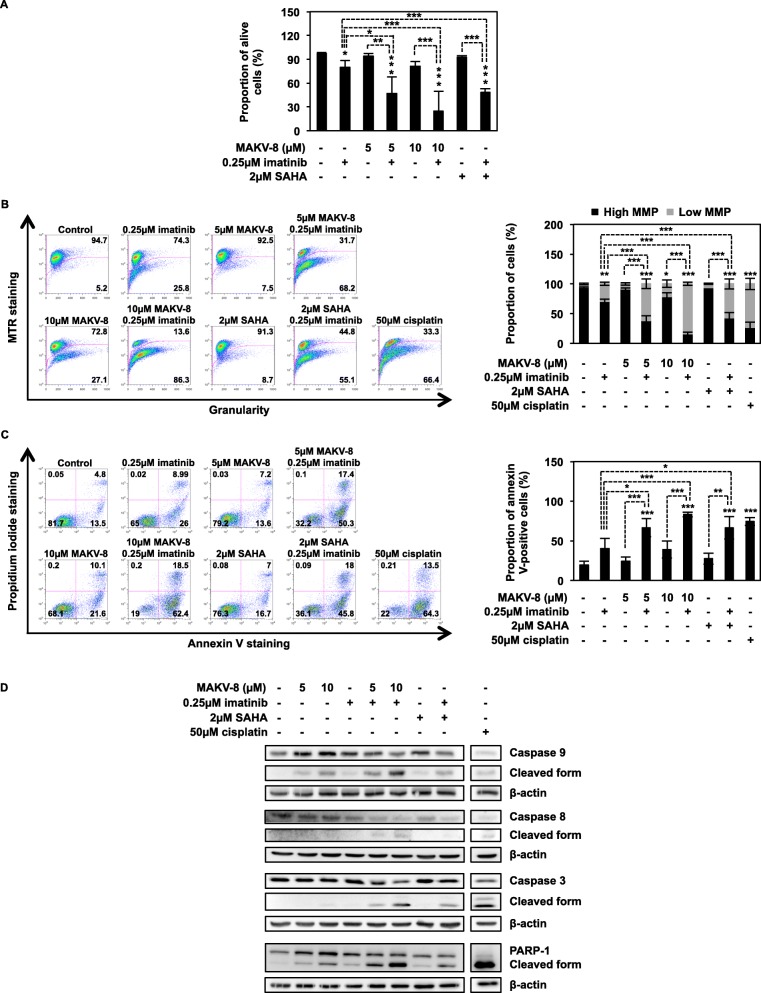
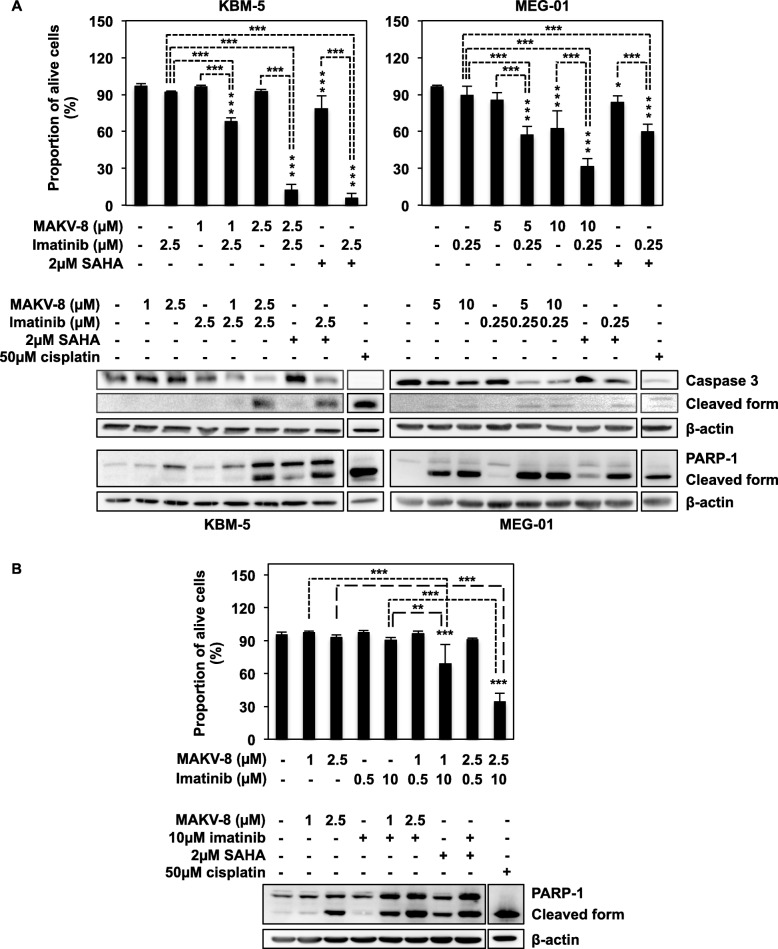
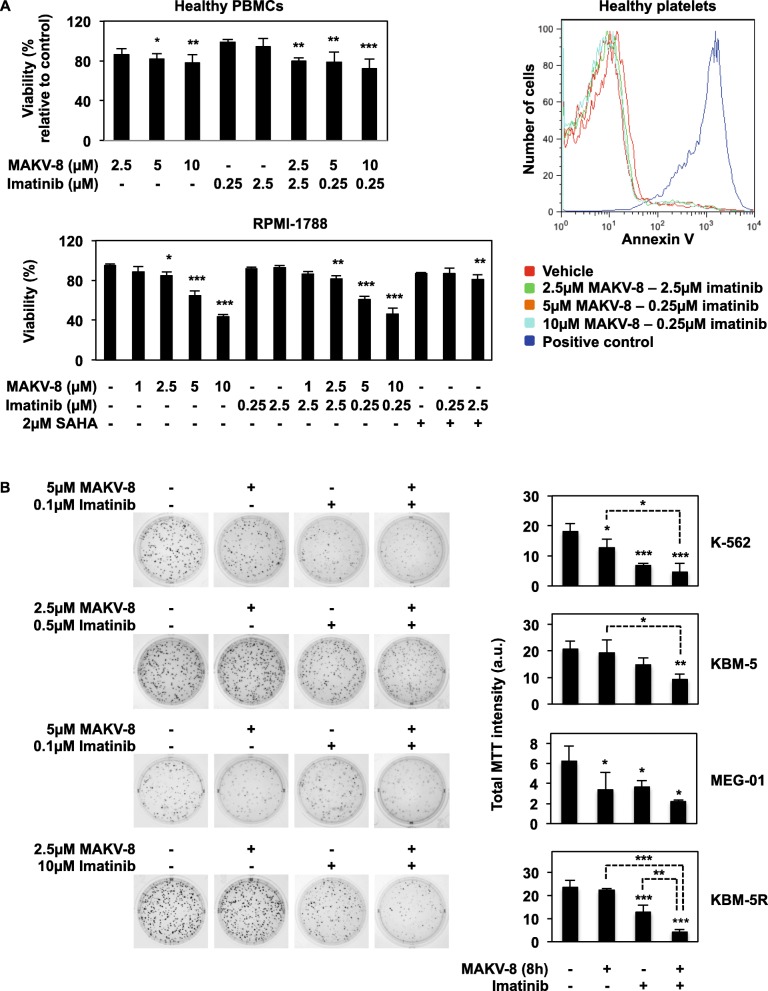
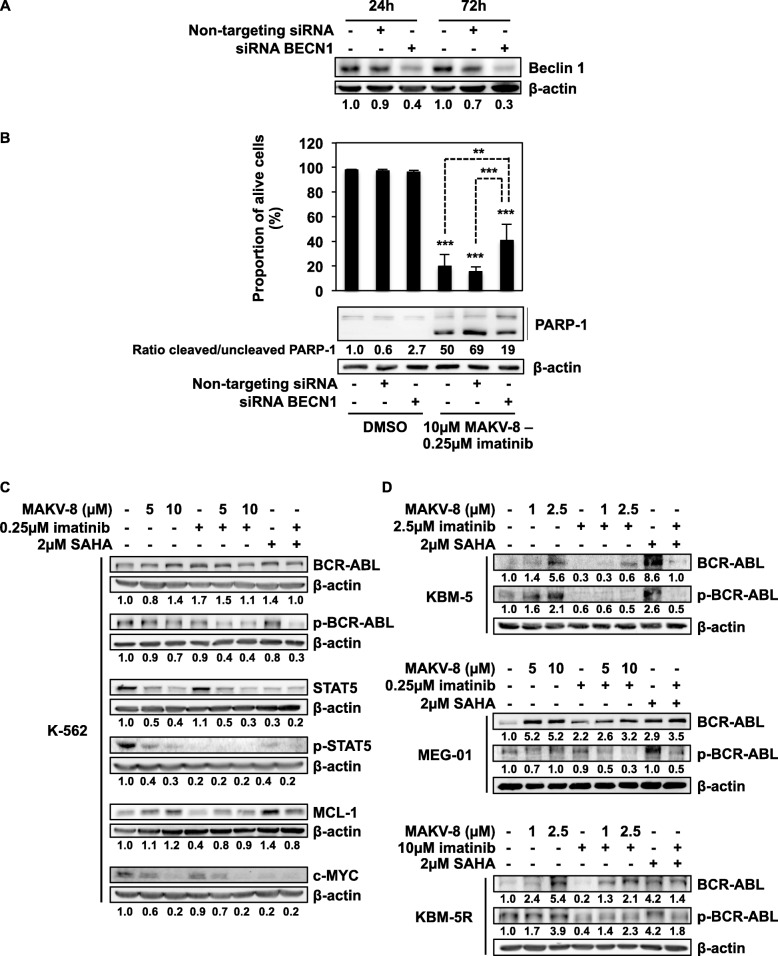
Results: We assessed the anti-leukemic activity of a novel hydroxamate-based pan-HDAC inhibitor MAKV-8, which complied with the Lipinski's "rule of five," in various CML cells alone or in combination with imatinib. We validated the in vitro HDAC-inhibitory potential of MAKV-8 and demonstrated efficient binding to the ligand-binding pocket of HDAC isoenzymes. In cellulo, MAKV-8 significantly induced target protein acetylation, displayed cytostatic and cytotoxic properties, and triggered concomitant ER stress/protective autophagy leading to canonical caspase-dependent apoptosis. Considering the specific upregulation of selected HDACs in LSCs from CML patients, we investigated the differential toxicity of a co-treatment with MAKV-8 and imatinib in CML versus healthy cells. We also showed that beclin-1 knockdown prevented MAKV-8-imatinib combination-induced apoptosis. Moreover, MAKV-8 and imatinib co-treatment synergistically reduced BCR-ABL-related signaling pathways involved in CML cell growth and survival. Since our results showed that LSCs from CML patients overexpressed c-MYC, importantly MAKV-8-imatinib co-treatment reduced c-MYC levels and the LSC population. In vivo, tumor growth of xenografted K-562 cells in zebrafish was completely abrogated upon combined treatment with MAKV-8 and imatinib.

Conclusions: Collectively, the present findings show that combinations HDAC inhibitor-imatinib are likely to overcome drug resistance in CML pathology.

Keywords: Apoptosis; Autophagy; Computational docking; Endoplasmic reticulum stress; Epigenetic regulation; Tyrosine kinase inhibitor.


Conflict of interest statement

The authors declare that they have no competing interests.

Figures

Fig. 1
Fig. 1
Chemical structures of MAKV-6, MAKV-7, MAKV-8, MAKV-10, and MAKV-12 and the reference HDACi, SAHA. The prototypical pharmacophoric model of an HDACi is constituted by the zinc binding group, the hydrophobic linker region, and the cap group. MAKV-6 and MAKV-7 lack the linker portion; MAKV-10 and MAKV-12 substitute the hydroxamate group with a methyl ester group and were obtained as synthesis intermediates
Fig. 2
Fig. 2
MAKV-8 inhibits HDAC activities in vitro and binds to the ligand-binding pocket of HDAC isoenzymes. (a) In vitro HDAC activity assays were conducted with increasing MAKV-8 concentrations. Relative activities of total HDAC, HDAC1, and HDAC6 were determined by comparison to the vehicle, DMSO. (b) Docking poses of MAKV-8 (stick model, orange) on the crystal structure of indicated HDAC isoenzymes (white; PDB codes: see Methods section). Numbered residues forming hydrophobic interactions in the binding sites (stick representation) correspond to HDAC1 to HDAC8 from top to bottom. Zinc atom is shown as a purple sphere; nitrogen and oxygen are colored in blue and red, respectively
Fig. 3
Fig. 3
The potent pan-HDAC inhibitor MAKV-8 displays cytotoxic properties in CML cells. The acetylation levels of HDAC targets were assessed by western blot in K-562 cells treated with (a) increasing MAKV-8 concentrations for 24h or (b) 15µM MAKV-8 for the indicated time points. (c) CML cell proliferation and viability were evaluated following treatments with increasing MAKV-8 concentrations for up to 72h. (d) CML cells were grown in the presence of increasing MAKV-8 concentrations for 10 days, and their colony-forming capacity was scored after MTT addition. Representative pictures (left panel) and corresponding quantifications (right panel) from three independent experiments are provided. (e) Histone H4 and α-tubulin acetylation levels were assessed by western blot in KBM-5 and MEG-01 cells treated with increasing MAKV-8 concentrations for 24h. β-actin and histone H1 served as loading controls for α-tubulin and histone H4, respectively. Blots are representative of three independent experiments. SAHA was used as a reference HDACi
Fig. 4
Fig. 4
MAKV-8 derivatives display lower potency than their parent compound. (a) Docking poses of MAKV-8 derivatives (stick model) on HDAC6 crystal structure (white; PDB code: 5EDU). Numbered residues forming hydrophobic interactions in the binding sites (stick representation) are indicated. Zinc atom is shown as a purple sphere; nitrogen and oxygen are colored in blue and red, respectively. (b) Histone H4 and α-tubulin acetylation levels were assessed by western blot (upper panel), and cell proliferation and viability were evaluated (lower panel) following treatments of K-562 cells with increasing concentrations of the indicated MAKV-8 derivatives for 24h and up to 72h, respectively. β-actin and histone H1 served as loading controls for α-tubulin and histone H4, respectively. Blots are representative of three independent experiments. SAHA was used as a reference HDACi
Fig. 5
Fig. 5
Treatment with MAKV-8 leads to cell cycle arrest and apoptotic cell death. K-562 cells were treated with MAKV-8 at the indicated time points and concentrations, followed by analyses of (a) cell cycle distribution using a range of subtoxic cytostatic MAKV-8 concentrations to focus only on aspects of cell cycle modulation, (b) nuclear morphology, and (c) caspase and PARP-1 activation. (b) Representative pictures of cells stained with Hoechst in blue and propidium iodide (PI) in red (upper left panel) and corresponding quantifications (lower right panel) from three independent experiments are provided. Where indicated, cells were pre-incubated for 1h with the pan-caspase inhibitor z-VAD-FMK. Cisplatin was used as a positive control for caspase and PARP-1 cleavage. Blots used β-actin as the loading control and are representative of three independent experiments. SAHA was used as a reference HDACi
Fig. 6
Fig. 6
MAKV-8 treatment induces ER stress. K-562 cells were treated with the indicated concentrations of MAKV-8 at the indicated time points unless otherwise stated. (a) The expression levels of UPR-associated proteins, such as the ER stress marker GRP78, were assessed by western blot using β-actin as a loading control. (b) DDIT3 mRNA expression levels were quantified by real-time PCR and normalized to β-actin mRNA levels. (c) End-point analysis of XBP1 mRNA splicing. Thapsigargin (T, 4 µM) was used as a positive control for ER stress induction. All pictures are representative of three independent experiments
Fig. 7
Fig. 7
MAKV-8 treatment triggers autophagy and double strand breaks. K-562 cells were treated with the indicated concentrations of MAKV-8 at the indicated time points unless otherwise stated. (a) Cell morphology was analyzed after 48h of treatment using modified GIEMSA staining, and pictures were acquired by bright-field microscopy. (b) The appearance of autophagosome-related vesicles was quantified in cells treated with MAKV-8 for 8h. Representative pictures of cells stained with Hoechst in blue and Cyto-ID in green (left panel) and corresponding quantifications (right panel) from three independent experiments are provided. (c) After 8h of treatment, the conversion of LC3-I to LC3-II and expression of p62, two autophagic markers, were evaluated by western blot. Where indicated, bafilomycin A1 was added 2h before the end of treatment. (d) Representative images of electron microscopy analysis in indicated CML cell line: (1) phagophores and (2) autophagolysosomes. (e) The expression level of γH2AX, the earliest marker for DNA damage localized at double strand breaks, was assessed by western blot. Cisplatin (C, 50 µM) was used as a positive control for double strand break induction. Blots used β-actin as the loading control, and pictures are representative of three independent experiments
Fig. 8
Fig. 8
Treating CML cells with imatinib in combination with pan-HDACis is a promising therapeutic approach. (a) Boxplots including outliers illustrating fold-change (log2) of HDAC1, HDAC2 and HDAC3 mRNA expression levels in CD34+CD38- stem cells isolated from healthy (n=7) and CML (n=11) patients (represented by triangles). (b) CML cells were treated with the indicated concentrations of imatinib alone or in combination with MAKV-8. After 24h-incubations, α-tubulin and histone H4 acetylation levels were assessed by western blot, with β-actin and histone H1 as loading controls, respectively. Blots are representative of three independent experiments. SAHA was used as a reference HDACi
Fig. 9
Fig. 9
The HDACi MAKV-8 combined with imatinib induces synergistic anti-cancer activity in K-562 cells. Cells were treated with the indicated concentrations of imatinib alone or in combination with MAKV-8. (a) Nuclear morphology, (b) phosphatidylserine exposure, and (c) mitochondrial membrane potential (MMP) were analyzed in K-562 cells treated for 48h. Representative dot plots (left panel) and corresponding quantifications (right panel) from three independent experiments are provided. (d) Caspase and PARP-1 cleavages were analyzed by western blot in K-562 cells treated for 24h, using β-actin as the loading control. Cisplatin was used as a positive control for apoptosis induction and MMP disruption. Blots and pictures are representative of three independent experiments. SAHA was used as a reference HDACi
Fig. 10
Fig. 10
MAKV-8 combined with imatinib induces synergistic anti-cancer activity in imatinib-sensitive and -resistant CML cells. CML cells were treated with the indicated concentrations of imatinib alone or in combination with MAKV-8. (a) Nuclear morphology (upper panel) and cleavage of caspase 3 and PARP-1 (lower panel) were studied in KBM-5 and MEG-01 cells treated for 48 and 24h, respectively. (b) Nuclear morphology (upper panel) and PARP-1 cleavage (lower panel) were evaluated in KBM-5R cells treated for 48 and 24h, respectively. Caspase and PARP-1 cleavages were assessed by western blot using β-actin as the loading control. Cisplatin was used as a positive control. Blots are representative of three independent experiments. SAHA was used as a reference HDACi
Fig. 11
Fig. 11
MAKV-8 combined with imatinib displays a differential toxicity in healthy cells compared to CML cells. CML and healthy cells were treated with the indicated concentrations of imatinib alone or in combination with MAKV-8. (a) Healthy cell models were treated for 48h. Cell viability was assessed based on the Trypan Blue exclusion method for PBMCs, by flow cytometry after Annexin V staining for platelets, and nuclear morphology was examined in RPMI-1788 cells. SAHA was used as a reference HDACi. (b) CML cells were pre-treated with MAKV-8 for 8h and then grown in semisolid methylcellulose medium in the presence of imatinib. After 10-day incubations, cell colony-forming capacity was scored after MTT addition. Representative pictures (left panel) and corresponding quantifications (right panel) from three independent experiments are provided
Fig. 12
Fig. 12
Altered BCR-ABL signaling and autophagy induction are associated with MAKV-8-imatinib anti-cancer properties. CML cells were treated with the indicated concentrations of imatinib alone or in combination with MAKV-8. (a, b) K-562 cells were transfected with or without the indicated siRNA, then (a) the expression level of beclin-1, a protein involved in initiating the autophagic flux, was assessed by western blot 24 and 72h post-transfection, and (b) nuclear morphology (upper panel) and PARP-1 cleavage (lower panel) were analyzed in cells treated for 24 and 48h, respectively. The ratio between the cleaved and uncleaved forms of PARP-1 was determined based on western blot quantification. (c, d) Protein expression and phosphorylation levels were assessed by western blot in cells treated for 24h. Blots used β-actin as a loading control and are representative of three independent experiments. SAHA was used as a reference HDACi
Fig. 13
Fig. 13
MAKV-8-imatinib combination reduces cancer stem cell population. CML cells were treated with the indicated concentrations of imatinib alone or in combination with MAKV-8. (a) Boxplots illustrating fold-change (log2) of c-MYC mRNA expression in CD34+CD38- stem cells isolated from healthy (n=7) and CML (n=11) patients (represented by triangles). (b) Analysis of aldehyde dehydrogenase (ALDH) activity in K-562 cells cultured for 24h and known to present a substantial proportion of cells with cancer stem-like characteristics. Elevated ALDH activity is an established marker for the identification of hematopoietic stem cells. The ALDH inhibitor diethylaminobenzaldehyde (DEAB) was used to distinguish cell subpopulations with low and high ALDH activity. Representative dot plots where the percentage of ALDH+ cells is indicated (upper panel) and corresponding quantifications (lower panel) representative of three independent experiments are presented. SAHA was used as a reference HDACi. (c) K-562 cells were treated for 24h, fluorescently labeled, and then injected into the zebrafish yolk sac. Three days post-injection, pictures of 5 to 8 fishes (one representative set of pictures is presented) were taken, and the fluorescence intensity was quantified

References

    1. Jabbour E, Kantarjian H. Chronic myeloid leukemia: 2018 update on diagnosis, therapy and monitoring. Am J Hematol. 2018;93(3):442–459. - PubMed
    1. Apperley JF. Chronic myeloid leukaemia. Lancet. 2015;385(9976):1447–1459. - PubMed
    1. Masamoto Y, Kurokawa M. Targeting chronic myeloid leukemia stem cells: can transcriptional program be a druggable target for cancers? Stem Cell Investig. 2018;5:10. - PMC - PubMed
    1. Thompson PA, Kantarjian HM, Cortes JE. Diagnosis and treatment of chronic myeloid leukemia in 2015. Mayo Clin Proc. 2015;90(10):1440–1454. - PMC - PubMed
    1. Zhou H, Xu R. Leukemia stem cells: the root of chronic myeloid leukemia. Protein Cell. 2015;6(6):403–412. - PMC - PubMed

Publication types

MeSH terms

LinkOut - more resources