. 2020 Aug;10(8):1129-1139.
doi: 10.1158/2159-8290.CD-20-0187. Epub 2020 May 19.

EGFR Blockade Reverts Resistance to KRASG12C Inhibition in Colorectal Cancer

Affiliations

EGFR Blockade Reverts Resistance to KRASG12C Inhibition in Colorectal Cancer

Vito Amodio et al. Cancer Discov. 2020 Aug.

Abstract

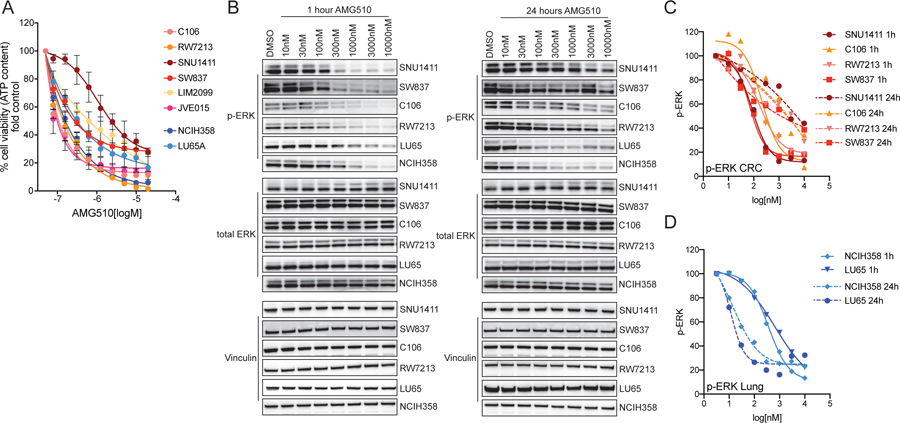
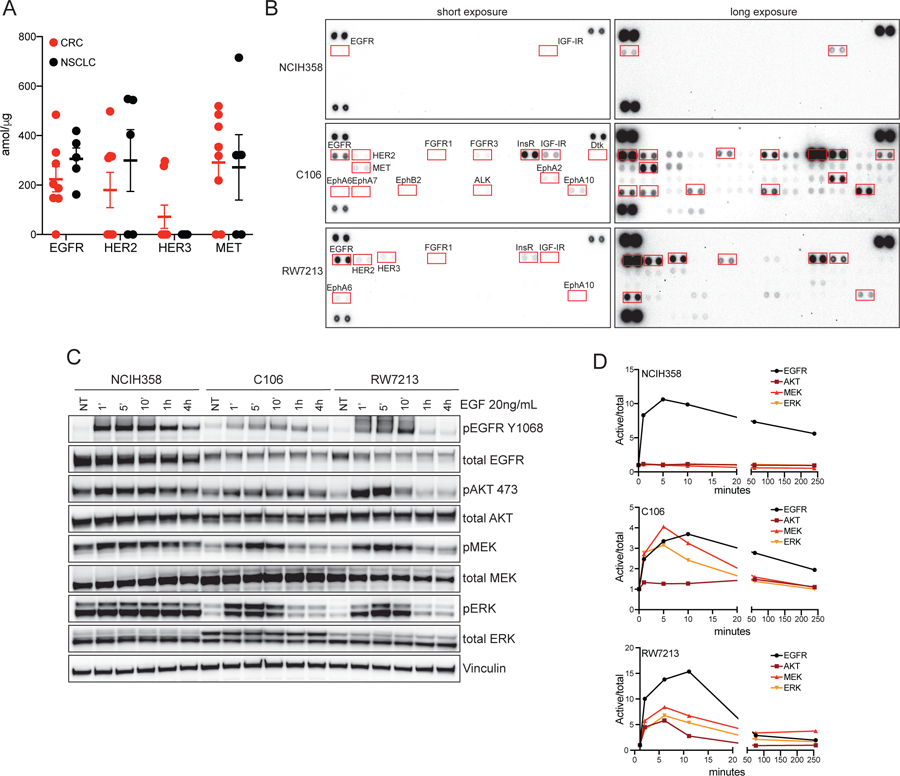
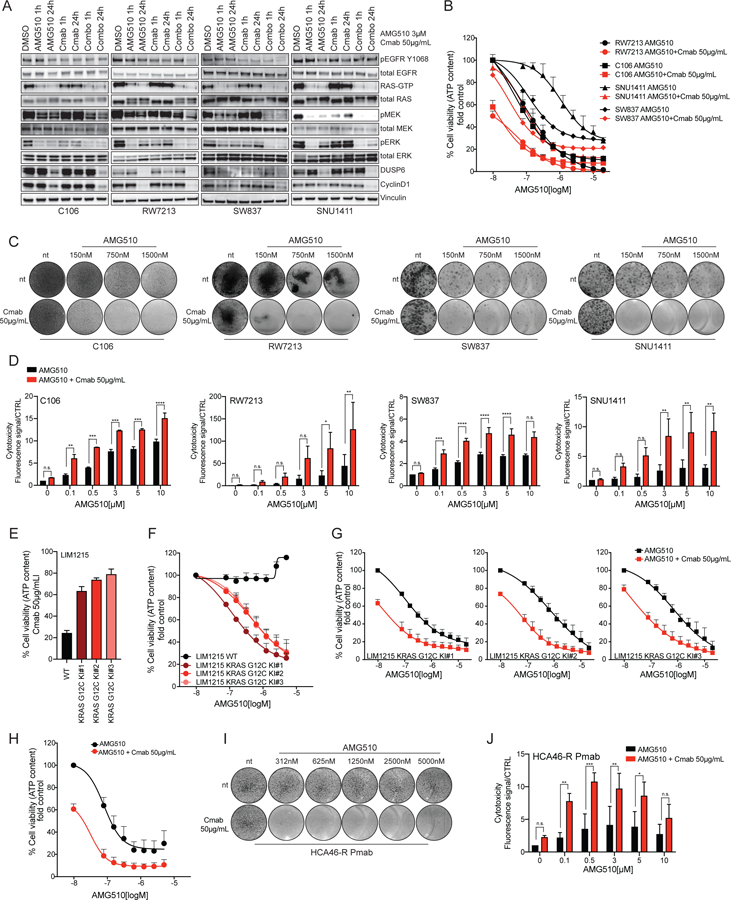
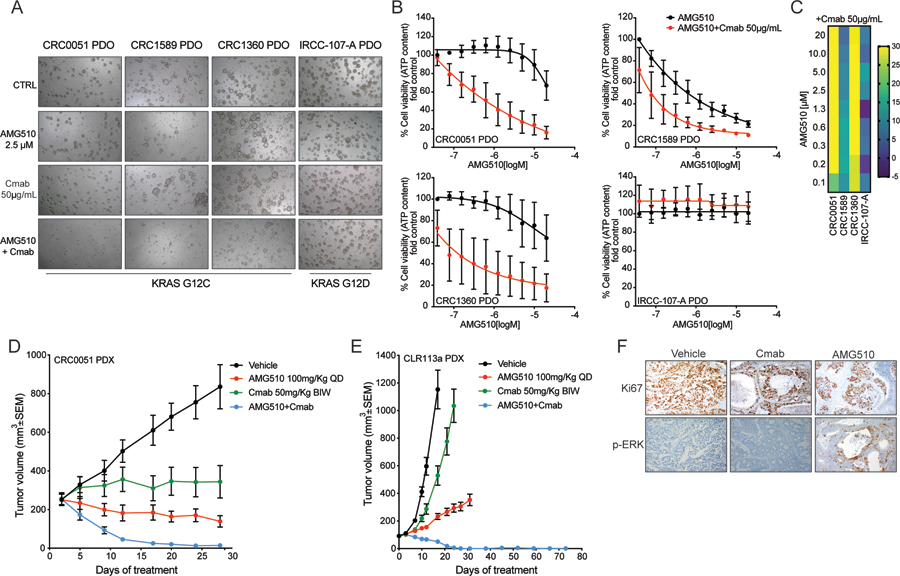
Most patients with KRAS G12C-mutant non-small cell lung cancer (NSCLC) experience clinical benefit from selective KRASG12C inhibition, whereas patients with colorectal cancer bearing the same mutation rarely respond. To investigate the cause of the limited efficacy of KRASG12C inhibitors in colorectal cancer, we examined the effects of AMG510 in KRAS G12C colorectal cancer cell lines. Unlike NSCLC cell lines, KRAS G12C colorectal cancer models have high basal receptor tyrosine kinase (RTK) activation and are responsive to growth factor stimulation. In colorectal cancer lines, KRASG12C inhibition induces higher phospho-ERK rebound than in NSCLC cells. Although upstream activation of several RTKs interferes with KRASG12C blockade, we identify EGFR signaling as the dominant mechanism of colorectal cancer resistance to KRASG12C inhibitors. The combinatorial targeting of EGFR and KRASG12C is highly effective in colorectal cancer cells and patient-derived organoids and xenografts, suggesting a novel therapeutic strategy to treat patients with KRAS G12C colorectal cancer. SIGNIFICANCE: The efficacy of KRASG12C inhibitors in NSCLC and colorectal cancer is lineage-specific. RTK dependency and signaling rebound kinetics are responsible for sensitivity or resistance to KRASG12C inhibition in colorectal cancer. EGFR and KRASG12C should be concomitantly inhibited to overcome resistance to KRASG12C blockade in colorectal tumors.See related commentary by Koleilat and Kwong, p. 1094.This article is highlighted in the In This Issue feature, p. 1079.


Conflict of interest statement

conflicts of interest

All the other authors declare no conflicts of interests.

Figures

Figure 1:
Figure 1:. Response to KRAS G12C inhibition in CRC cell lines.
(A) Short term proliferation assay of CRC cell lines (shades of red) and NSCLC cell lines (shades of blue). Cells were treated for 120 hours with increasing concentration of AMG510 and then ATP content was measured using CellTiterGlo. Data represents the average and standard deviation of 3 biological replicates. (B) Western blot analysis of ERK activation upon AMG510 dose-response treatment after 1 hour and 24 hours treatment. Vinculin is used as loading control. (C) Densitometry analysis of CRC cell lines in western blot in (B). p-ERK values are normalized on both total ERK and Vinculin and on DMSO control. (D) Densitometry analysis of NSCLC cell lines western blot in (B). p-ERK values are normalized on both total ERK and Vinculin and on DMSO control.
Figure 2:
Figure 2:. RTK component and responsiveness in CRC cell lines.
(A) Mass spectrometry analysis of RTK in CRC and NSCLC patients-derived biopsies. (B) Phospho-RTK array of NCIH358 (NSCLC), C106 and RW7213 (CRC) cell lines. Cell were FBS starved for 24h and stimulated with 20% FBS for ten minutes before harvesting. (C) Western blot analysis of KRAS downstream effectors in NCIH358 (NSCLC), C106 and RW7213 (CRC) cell lines upon time course EGF treatment. Vinculin is used as loading control. (D) Densitometry analysis of p-AKT, p-MEK and p-ERK of western blot in (C). Phospho-proteins values are normalized on total proteins and Vinculin and on not treated (NT) control.
Figure 3:
Figure 3:. EGFR inhibition sensitizes CRC cell lines to AMG510.
(A) Western blot analysis of cetuximab plus AMG510 combinatorial treatment in time course in C106, RW7213, SNU1411 and SW837 CRC cell lines. RAS-GTP pull down assay is included, and Vinculin is used as loading control. (B) Short-term proliferation assay of C106, RW7213, SNU1411 and SW837 treated with increasing concentration of AMG510 with or without 50ug/mL cetuximab. First data points of the combination curves represent the response to cetuximab alone. Cells were treated for 120 hours with increasing concentration of AMG510 and then ATP content was measured using CellTiterGlo. Data represents the average and standard deviation of 3 biological replicates. The AMG510 single agent curves used in this graph, are the same used in fig 1A. (C) Long-term drug screening proliferation assay of C106, RW7213, SNU1411 and SW837 treated with increasing concentration of AMG510 with or without 50μg/mL cetuximab. Cetuximab only treated cells are shown in the first lower circles. Cells were treated for 9 to 13 days according to the time when untreated controls reached confluence. (D) CellTox assay of C106, RW7213, SNU1411 and SW837 treated with increasing concentration of AMG510 with or without 50μg/mL cetuximab. Cetuximab only treated cells are shown as the first red bar at 0μM AMG510. Cells were treated for 120 hours. Data represents the average and standard deviation of 3 biological replicates. Statistical significance was calculated using one-way ANOVA with Bonferroni’s correction. Asterisks indicates *=p<0.05, **=p<0.01, ***=p<0.001, ****=p<0.0001, n.s.= not significant. (E) LIM1215 KRAS G12C Knock-In (KI) clones response to cetuximab; LIM1215 parental cells were included as control. (F) LIM1215 KRAS G12C KI clones response to AMG510 in short-term proliferation assay. Cells were treated for 120 hours with increasing concentration of AMG510 and then ATP content was measured using CellTiterGlo. Data represents the average and standard deviation of 3 biological replicates. (G) LIM1215 KRAS G12C KI clones response to AMG510+cetuximab in short-term proliferation assay. First data points of the combination curves represent the response to cetuximab alone. Cells were treated for 120 hours with increasing concentration of AMG510 and then ATP content was measured using CellTiterGlo. Data represents the average and standard deviation of 3 biological replicates. (H) HCA46-R Pmab cell line response to AMG510+cetuximab in short-term proliferation assay. First data point of the combination curve represents the response to cetuximab alone. Cells were treated for 120 hours with increasing concentration of AMG510 and then ATP content was measured using CellTiterGlo. Data represents the average and standard deviation of 3 biological replicates. (I) Long-term drug screening proliferation assay of HCA46-R Panitumumab treated with increasing concentration of AMG510 with or without 50ug/mL cetuximab. Cetuximab only treated cells are shown in the first lower circles. (J) CellTox assay of HCA46-R Pmab treated with increasing concentration of AMG510 with or without 50ug/mL cetuximab. Cetuximab only treated cells are shown as the first red bar at 0μM AMG510. Data represents the average and standard deviation of 3 biological replicates. Statistical significance was calculated using one-way ANOVA with Bonferroni’s correction. Asterisks indicates *=p<0.05, **=p<0.01, ***=p<0.001, ****=p<0.0001, n.s.= not significant.
Figure 4:
Figure 4:. AMG510+cetuximab combination is effective in KRAS G12C mutant patient-derived models.
(A) Bright-field microscopy images of patient-derived organoid (PDO) treated with vehicle, AMG510, cetuximab and the combination 7 days after treatment. (B) ATP content quantification with CellTiterGlo assay. (C) Synergy score. Heatmap of excess over the Bliss (Bliss score) for AMG510-Cetuximab combination. (D) CRC0051 KRAS G12C mutant CRC patient-derived xenografts (PDXs) were treated with vehicle alone, AMG510 100mg/kg oral BID, cetuximab 50 mg/kg intraperitoneal twice a week (BIW), or the combination of the 2 drugs at the same doses. Error bars represent SEM (5 animals per group) (E) CLR113a KRAS G12C mutant CRC patient-derived xenografts (PDXs) were treated with vehicle alone, AMG510 100mg/kg oral BID, cetuximab 50 mg/kg intraperitoneal twice a week (BIW), or the combination of the 2 drugs at the same doses. Error bars represent SEM (5 animals per group). (F) Ki67 and phospho-ERK immunohistochemical staining of the CLR113a PDX samples collected at the end of treatment from vehicle, cetuximab and AMG510 treated arms. Ki67 IHC intensity of 97% with no necrosis in vehicle treated mice, 92% with necrosis in cetuximab treated mice, and 83% with necrosis in AMG510 treated mice.

Comment in

References

    1. Zehir A, Benayed R, Shah RH, Syed A, Middha S, Kim HR, et al. Mutational landscape of metastatic cancer revealed from prospective clinical sequencing of 10,000 patients. Nature medicine. 2017;23:703–13. - PMC - PubMed
    1. Simanshu DK, Nissley DV, McCormick F. RAS Proteins and Their Regulators in Human Disease. Cell. 2017;170:17–33. - PMC - PubMed
    1. Bos JL, Rehmann H, Wittinghofer A. GEFs and GAPs: critical elements in the control of small G proteins. Cell. 2007;129:865–77. - PubMed
    1. Schubbert S, Shannon K, Bollag G. Hyperactive Ras in developmental disorders and cancer. Nature reviews Cancer. 2007;7:295–308. - PubMed
    1. Yuan TL, Amzallag A, Bagni R, Yi M, Afghani S, Burgan W, et al. Differential Effector Engagement by Oncogenic KRAS. Cell reports. 2018;22:1889–902. - PMC - PubMed

Publication types

MeSH terms