The prohibitin-binding compound fluorizoline affects multiple components of the translational machinery and inhibits protein synthesis
- PMID: 32430400
- PMCID: PMC7380185
- DOI: 10.1074/jbc.RA120.012979
The prohibitin-binding compound fluorizoline affects multiple components of the translational machinery and inhibits protein synthesis
Abstract
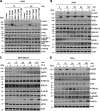
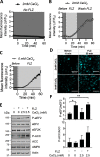
Fluorizoline (FLZ) binds to prohibitin-1 and -2 (PHB1/2), which are pleiotropic scaffold proteins known to affect signaling pathways involved in several intracellular processes. However, it is not yet clear how FLZ exerts its effect. Here, we show that exposure of three different human cancer cell lines to FLZ increases the phosphorylation of key translation factors, particularly of initiation factor 2 (eIF2) and elongation factor 2 (eEF2), modifications that inhibit their activities. FLZ also impaired signaling through mTOR complex 1, which also regulates the translational machinery, e.g. through the eIF4E-binding protein 4E-BP1. In line with these findings, FLZ potently inhibited protein synthesis. We noted that the first phase of this inhibition involves very rapid eEF2 phosphorylation, which is catalyzed by a dedicated Ca2+-dependent protein kinase, eEF2 kinase (eEF2K). We also demonstrate that FLZ induces a swift and marked rise in intracellular Ca2+ levels, likely explaining the effects on eEF2. Disruption of normal Ca2+ homeostasis can also induce endoplasmic reticulum stress, and our results suggest that induction of this stress response contributes to the increased phosphorylation of eIF2, likely because of activation of the eIF2-modifying kinase PKR-like endoplasmic reticulum kinase (PERK). We show that FLZ induces cancer cell death and that this effect involves contributions from the phosphorylation of both eEF2 and eIF2. Our findings provide important new insights into the biological effects of FLZ and thus the roles of PHBs, specifically in regulating Ca2+ levels, cellular protein synthesis, and cell survival.
Keywords: calcium; cancer; cell death; eEF2; eIF2; elongation; endoplasmic reticulum stress (ER stress); eukaryotic initiation factor 2 (eIF2); eukaryotic translation initiation; initiation; prohibitin; protein synthesis; translation elongation factor.
© 2020 Jin et al.
Conflict of interest statement
Conflict of interest—The authors declare that they have no conflicts of interest with the contents of this article.
Figures


Similar articles
-
Carbon monoxide releasing molecule-2 CORM-2 represses global protein synthesis by inhibition of eukaryotic elongation factor eEF2.Int J Biochem Cell Biol. 2013 Feb;45(2):201-12. doi: 10.1016/j.biocel.2012.09.020. Epub 2012 Oct 4. Int J Biochem Cell Biol. 2013. PMID: 23041477
-
Cellular stresses profoundly inhibit protein synthesis and modulate the states of phosphorylation of multiple translation factors.Eur J Biochem. 2002 Jun;269(12):3076-85. doi: 10.1046/j.1432-1033.2002.02992.x. Eur J Biochem. 2002. PMID: 12071973
-
Direct and indirect activation of eukaryotic elongation factor 2 kinase by AMP-activated protein kinase.Cell Signal. 2017 Aug;36:212-221. doi: 10.1016/j.cellsig.2017.05.010. Epub 2017 May 11. Cell Signal. 2017. PMID: 28502587
-
Regulation of protein synthesis by insulin.Biochem Soc Trans. 2006 Apr;34(Pt 2):213-6. doi: 10.1042/BST20060213. Biochem Soc Trans. 2006. PMID: 16545079 Review.
-
Regulation of translation initiation by amino acids in eukaryotic cells.Prog Mol Subcell Biol. 2001;26:155-84. doi: 10.1007/978-3-642-56688-2_6. Prog Mol Subcell Biol. 2001. PMID: 11575165 Review.
Cited by
-
Activation of AMP-activated protein kinase (AMPK) through inhibiting interaction with prohibitins.iScience. 2023 Feb 28;26(4):106293. doi: 10.1016/j.isci.2023.106293. eCollection 2023 Apr 21. iScience. 2023. PMID: 36950117 Free PMC article.
-
The function of prohibitins in mitochondria and the clinical potentials.Cancer Cell Int. 2022 Nov 8;22(1):343. doi: 10.1186/s12935-022-02765-x. Cancer Cell Int. 2022. PMID: 36348375 Free PMC article. Review.
-
SFPH proteins as therapeutic targets for a myriad of diseases.Bioorg Med Chem Lett. 2020 Nov 15;30(22):127600. doi: 10.1016/j.bmcl.2020.127600. Epub 2020 Oct 6. Bioorg Med Chem Lett. 2020. PMID: 33035678 Free PMC article. Review.
-
Prohibitins: A Key Link between Mitochondria and Nervous System Diseases.Oxid Med Cell Longev. 2022 Jul 8;2022:7494863. doi: 10.1155/2022/7494863. eCollection 2022. Oxid Med Cell Longev. 2022. PMID: 35847581 Free PMC article. Review.
-
Fatty acid translocase: a culprit of lipid metabolism dysfunction in disease.Immunometabolism (Cobham). 2022 Aug 15;4(3):e00001. doi: 10.1097/IN9.0000000000000001. eCollection 2022 Jul. Immunometabolism (Cobham). 2022. PMID: 35991116 Free PMC article. Review.
References
Publication types
MeSH terms
Substances
LinkOut - more resources
Full Text Sources
Medical
Miscellaneous

