

Serology characteristics of SARS-CoV-2 infection after exposure and post-symptom onset
- PMID: 32430429
- PMCID: PMC7401320
- DOI: 10.1183/13993003.00763-2020
Serology characteristics of SARS-CoV-2 infection after exposure and post-symptom onset
Abstract
Background: Timely diagnosis of severe acute respiratory syndrome coronavirus 2 (SARS-CoV-2) infection is a prerequisite for treatment and prevention. The serology characteristics and complement diagnosis value of the antibody test to RNA test need to be demonstrated.
Method: Serial sera of 80 patients with PCR-confirmed coronavirus disease 2019 (COVID-19) were collected at the First Affiliated Hospital of Zhejiang University, Hangzhou, China. Total antibody (Ab), IgM and IgG antibodies against SARS-CoV-2 were detected, and the antibody dynamics during the infection were described.
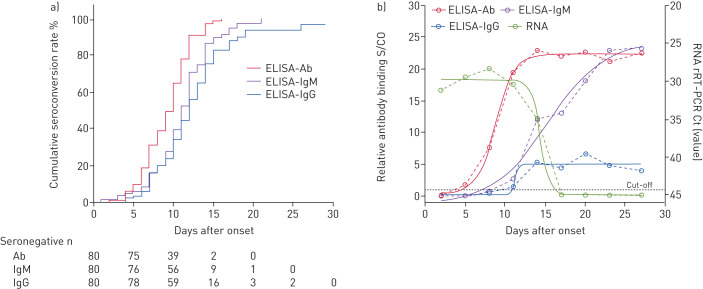
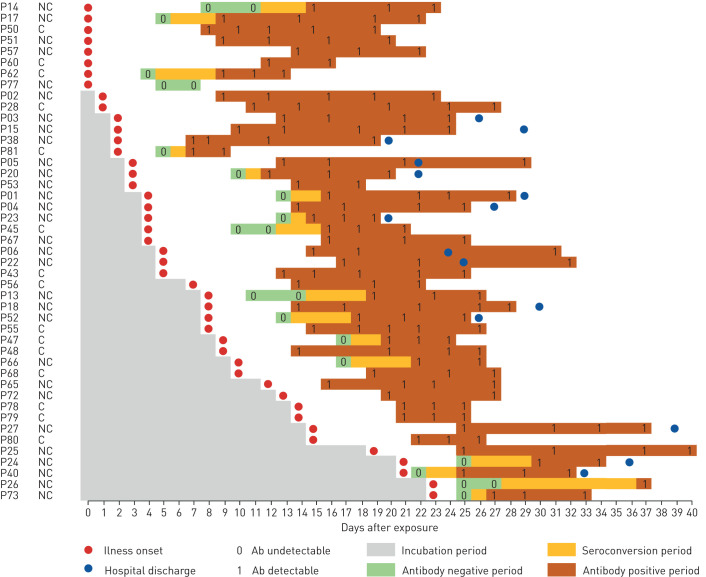
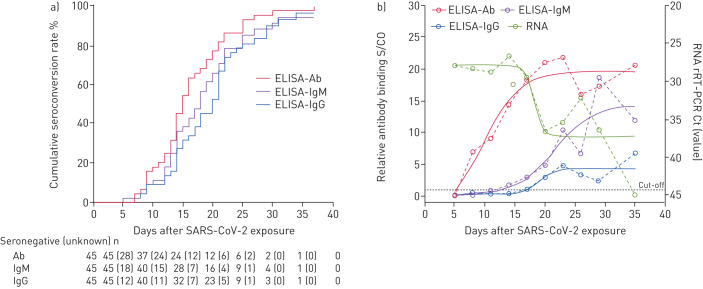
Results: The seroconversion rates for Ab, IgM and IgG were 98.8%, 93.8% and 93.8%, respectively. The first detectible serology marker was Ab, followed by IgM and IgG, with a median seroconversion time of 15, 18 and 20 days post exposure (d.p.e.) or 9, 10 and 12 days post onset (d.p.o.), respectively. The antibody levels increased rapidly beginning at 6 d.p.o. and were accompanied by a decline in viral load. For patients in the early stage of illness (0-7 d.p.o), Ab showed the highest sensitivity (64.1%) compared with IgM and IgG (33.3% for both; p<0.001). The sensitivities of Ab, IgM and IgG increased to 100%, 96.7% and 93.3%, respectively, 2 weeks later. When the same antibody type was detected, no significant difference was observed between enzyme-linked immunosorbent assays and other forms of immunoassays.
Conclusions: A typical acute antibody response is induced during SARS-CoV-2 infection. Serology testing provides an important complement to RNA testing in the later stages of illness for pathogenic-specific diagnosis and helpful information to evaluate the adapted immunity status of patients.
Copyright ©ERS 2020.
Conflict of interest statement
Conflict of interest: Bin Lou has nothing to disclose. Conflict of interest: Ting-Dong Li has nothing to disclose. Conflict of interest: Shu-Fa Zheng has nothing to disclose. Conflict of interest: Ying-Ying Su has nothing to disclose. Conflict of interest: Zhi-Yong Li has nothing to disclose. Conflict of interest: Wei Liu has nothing to disclose. Conflict of interest: Fei Yu has nothing to disclose. Conflict of interest: Sheng-Xiang Ge has nothing to disclose. Conflict of interest: Qian-Da Zou has nothing to disclose. Conflict of interest: Quan Yuan has nothing to disclose. Conflict of interest: Sha Lin has nothing to disclose. Conflict of interest: Cong-Ming Hong has nothing to disclose. Conflict of interest: Xiang-Yang Yao has nothing to disclose. Conflict of interest: Xue-Jie Zhang has nothing to disclose. Conflict of interest: Ding-Hui Wu has nothing to disclose. Conflict of interest: Guo-Liang Zhou has nothing to disclose. Conflict of interest: Wang-Heng Hou has nothing to disclose. Conflict of interest: Ting-Ting Li has nothing to disclose. Conflict of interest: Ya-Li Zhang has nothing to disclose. Conflict of interest: Shi-Yin Zhang has nothing to disclose. Conflict of interest: Jian Fan has nothing to disclose. Conflict of interest: Jun Zhang has nothing to disclose. Conflict of interest: Ning-Shao Xia has nothing to disclose. Conflict of interest: Yu Chen has nothing to disclose.
Figures
Comment in
-
The value of serology testing to manage SARS-CoV-2 infections.Eur Respir J. 2020 Aug 27;56(2):2002411. doi: 10.1183/13993003.02411-2020. Print 2020 Aug. Eur Respir J. 2020. PMID: 32675201 Free PMC article.
References
-
- World Health Organization. Coronavirus disease (COVID-19) outbreak www.who.int/emergencies/diseases/novel-coronavirus-2019. Date last accessed: May 6, 2020.
-
- World Health Organization. Coronavirus disease 2019 (COVID-19) Situation Report -51 www.who.int/docs/default-source/coronaviruse/situation-reports/20200311-.... Date last accessed: March 11, 2020. - PubMed
MeSH terms
LinkOut - more resources
Full Text Sources
Other Literature Sources
Medical
Miscellaneous