. 2020 Jul;19(7):1562-1571.
doi: 10.1158/1535-7163.MCT-19-1036. Epub 2020 May 19.

Pathway-Specific Genome Editing of PI3K/mTOR Tumor Suppressor Genes Reveals that PTEN Loss Contributes to Cetuximab Resistance in Head and Neck Cancer

Affiliations

Pathway-Specific Genome Editing of PI3K/mTOR Tumor Suppressor Genes Reveals that PTEN Loss Contributes to Cetuximab Resistance in Head and Neck Cancer

Hiroki Izumi et al. Mol Cancer Ther. 2020 Jul.

Abstract

Cetuximab, an mAb targeting EGFR, is a standard of care for the treatment for locally advanced or metastatic head and neck squamous cell carcinoma (HNSCC). However, despite overexpression of EGFR in more than 90% of HNSCC lesions, most patients with HNSCC fail to respond to cetuximab treatment. In addition, there are no available biomarkers to predict sensitivity or resistance to cetuximab in the clinic. Here, we sought to advance precision medicine approaches for HNSCC by identifying PI3K/mTOR signaling network-specific cetuximab resistance mechanisms. We first analyzed the frequency of genomic alterations in genes involved in the PI3K/mTOR signaling circuitry in the HNSCC TCGA dataset. Experimentally, we took advantage of CRISPR/Cas9 genome editing approaches to systematically explore the contribution of genomic alterations in each tumor suppressor gene (TSG) controlling the PI3K-mTOR pathway to cetuximab resistance in HNSCC cases that do not exhibit PIK3CA mutations. Remarkably, we found that many HNSCC cases exhibit pathway-specific gene copy number loss of multiple TSGs that normally restrain PI3K/mTOR signaling. Among them, we found that both engineered and endogenous PTEN gene deletions can mediate resistance to cetuximab. Our findings suggest that PTEN gene copy number loss, which is highly prevalent in HNSCC, may result in sustained PI3K/mTOR signaling independent of EGFR, thereby representing a promising mechanistic biomarker predictive of cetuximab resistance in this cancer type. Further prospective studies are needed to investigate the impact of PTEN loss on cetuximab efficacy in the clinic.


Conflict of interest statement

Conflicts of interest: The remaining authors declare no conflicts.

Figures

Figure 1.
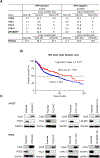
Figure 1.. Genomic alterations in genes involved in PI3K/Akt/mTOR signaling in HNSCC
(A) Frequency of genomic alterations in genes involved in PI3K/Akt/mTOR signaling in the HNSCC TCGA dataset (n = 504), including HPV-positive (n = 95) and negative (n = 409) lesions. (B) Comparison of overall survival between patients with and without copy number loss of tumor suppressor genes (TSGs) in either PTEN, TSC1, TSC2, STK11, or EIF4E-BP1. (C) Isogenic cell panels of HNSCC cell lines, CAL27 and HN12, parental controls and with gene knockout in PTEN, TSC2, STK11, or EIF4E-BP1, as indicated.
Figure 2.
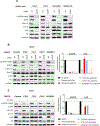
Figure 2.. Effects of knocking out PI3K/mTOR TSGs on the dependency of PI3K/mTOR signaling on EGFR activity in HNSCC cells.
(A) HNSCC cell lines were treated with control non-targeting (NT) or EGFR-siRNA under serum starvation. Cell lysates were analyzed for the indicated protein by western blotting. (B) Parental CAL27, and isogenic cells with the indicated gene knockouts were treated with control non-targeting (NT) or EGFR-siRNA under serum starvation. Cell lysates were analyzed for the indicated proteins by western blotting (Left panel). The band density was analyzed and normalized with control siRNA-treated samples. Data were from triplicate experiments (Right Panel). (C) Parental CAL27, and isogenic cells with indicated gene knockout were serum starved overnight, and then treated with 0.1% DMSO or erlotinib (3 μM) for 1h. Cell lysates were analyzed for the indicated proteins by western blot (left panel). The band density was analyzed and normalized with the vehicle control (0.1% DMSO)-treated samples. Data were from triplicate experiments (right Panel).
Figure 3.
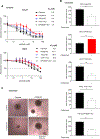
Figure 3.. Effects of PTEN knockout on the response to cetuximab in cell proliferation and orosphere formation assays.
(A) Parental and isogenic CAL27 and HN12 cells seeded in 96-well plates (2000 per well) were treated with the indicated concentrations of erlotinib for 72h. Cell viabilities were normalized with that of the corresponding vehicle control (0.1% DMSO)-treated cells. (B) Parental and isogenic HN12 cells were seeded in 96-well ultra-low attachment culture dishes at 100 cells per well (n = 10), and treated with vehicle control (0.9% NaCl) or cetuximab (10 μg/ml). 10 days after treatment, the size of spheres in each well were determined. (C) Representative spheres obtained from parental and PTEN knockout cells treated with vehicle control or cetuximab (10 μg/ml).
Figure 4.
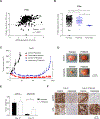
Figure 4.. Effects of PTEN knockout on the response to cetuximab in HNSCC tumor xenografts.
Correlation of PTEN protein expression with PTEN mRNA (A) and PTEN gene copy number (B) in the TCGA dataset. (C) Parental and PTEN knockout CAL27 were transplanted into nude mice, and treated with vehicle control diluent or cetuximab (40 mg/kg), 3 times per week. Cetuximab treatment was continued until 6 weeks (D). Representative tumors treated with or without cetuximab are shown. (E) Tumor weight at the indicated day. Control diluent- and cetuximab-treated tumors were collected 18 days and 74 days after treatment, respectively. (F) Representative immunohistochemical analysis of pEGFR (Y1068) and pS6, as indicated.
Figure 5.
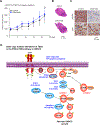
Figure 5.. Resistance to cetuximab in HNSCC tumors with endogenous PTEN loss, and PI3K/mTOR network-based analysis of refractoriness to cetuximab.
(A) UDSCC2 cells were transplanted into nude mice, and treated with vehicle control diluent or cetuximab (40 mg/kg), 3 times per week. (B) Representative tumors treated with vehicle control or cetuximab (HE staining). (C) Representative immunohistochemical analysis of pEGFR (Y1068) and pS6, as indicated. (D), graphic depicting copy number variations in the PI3K/mTOR pathway in HNSCC. Resistance to cetuximab can be specifically conferred by PIK3CA and RAS mutations (from reference 23), as well as from frequent PTEN gene copy loss (red border).

Similar articles

Cited by

References

    1. Siegel RL, Miller KD, Jemal A. Cancer statistics, 2019. CA Cancer J Clin [Internet]. 2019;69:7–34. Available from: http://www.ncbi.nlm.nih.gov/pubmed/30620402 - PubMed
    1. Lui VWY, Hedberg ML, Li H, Vangara BS, Pendleton K, Zeng Y, et al. Frequent Mutation of the PI3K Pathway in Head and Neck Cancer Defi nes Predictive Biomarkers. Cancer Discov. 2013;3:761–9. - PMC - PubMed
    1. Pickering CR, Zhang J, Yoo SY, Bengtsson L, Moorthy S, Neskey DM, et al. Integrative Genomic Characterization of Oral Squamous Cell Carcinoma Identifi es Frequent Somatic Drivers. Cancer Discov. 2013;3:770–81. - PMC - PubMed
    1. Iglesias-Bartolome R, Martin D, Silvio Gutkind J. Exploiting the head and neck cancer oncogenome: Widespread PI3K-mTOR pathway alterations and novel molecular targets. Cancer Discov. 2013;3:722–5. - PMC - PubMed
    1. The Cancer Genome Atlas Network. Comprehensive genomic characterization of head and neck squamous cell carcinomas. Nature. 2015;517:1–7. - PMC - PubMed

Publication types

MeSH terms