Review
. 2020 Jul 2;136(1):50-60.
doi: 10.1182/blood.2019000942.

Genetics of progression from MDS to secondary leukemia

Affiliations
Review

Genetics of progression from MDS to secondary leukemia

Andrew J Menssen et al. Blood. .

Abstract

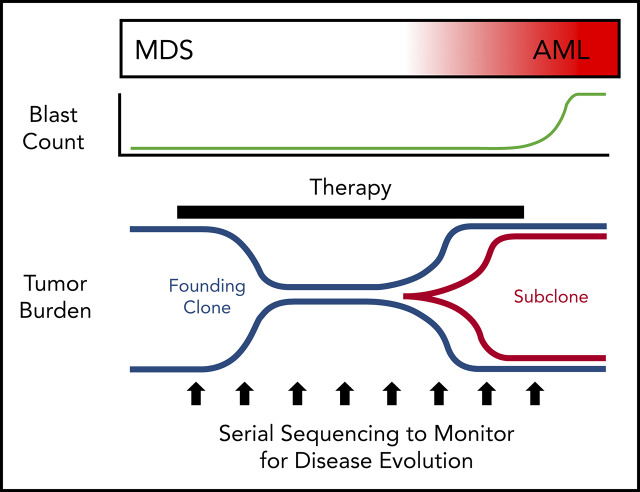
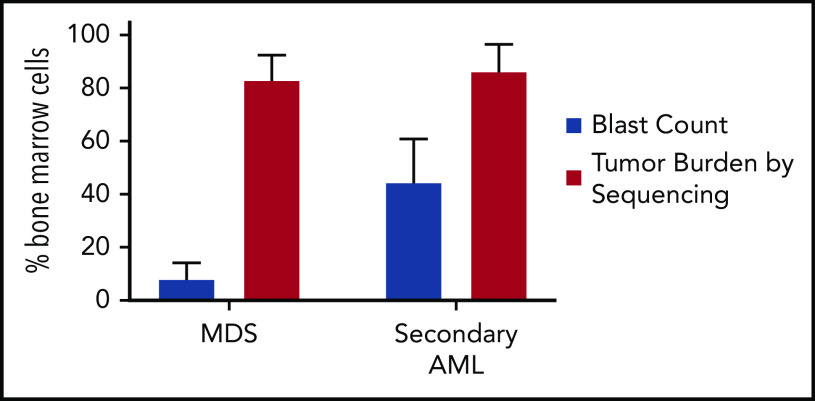
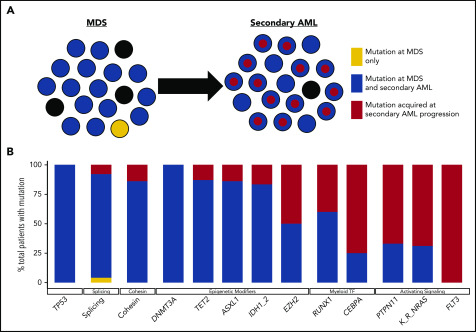
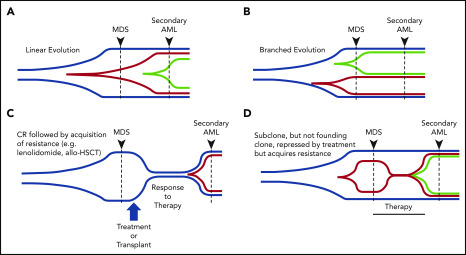
Our understanding of the genetics of acute myeloid leukemia (AML) development from myelodysplastic syndrome (MDS) has advanced significantly as a result of next-generation sequencing technology. Although differences in cell biology and maturation exist between MDS and AML secondary to MDS, these 2 diseases are genetically related. MDS and secondary AML cells harbor mutations in many of the same genes and functional categories, including chromatin modification, DNA methylation, RNA splicing, cohesin complex, transcription factors, cell signaling, and DNA damage, confirming that they are a disease continuum. Differences in the frequency of mutated genes in MDS and secondary AML indicate that the order of mutation acquisition is not random during progression. In almost every case, disease progression is associated with clonal evolution, typically defined by the expansion or emergence of a subclone with a unique set of mutations. Monitoring tumor burden and clonal evolution using sequencing provides advantages over using the blast count, which underestimates tumor burden, and could allow for early detection of disease progression prior to clinical deterioration. In this review, we outline advances in the study of MDS to secondary AML progression, with a focus on the genetics of progression, and discuss the advantages of incorporating molecular genetic data in the diagnosis, classification, and monitoring of MDS to secondary AML progression. Because sequencing is becoming routine in the clinic, ongoing research is needed to define the optimal assay to use in different clinical situations and how the data can be used to improve outcomes for patients with MDS and secondary AML.


Conflict of interest statement

Conflict-of-interest disclosure: The authors declare no competing financial interests.

Figures

None
Graphical abstract
Figure 1.
Figure 1.
Tumor burden is similar at MDS and secondary AML. Tumor burden at MDS and secondary AML (percentage of bone marrow cells) from 8 patients assessed at both time points., Tumor burden was measured by morphology using the blast count percentage and sequencing of total bone marrow cells (ie, percentage of clonal cells based on the mutations’ variant allele frequency). Although the blast count increases significantly from MDS to secondary AML, the percentage of clonal cells based on sequencing is similar at both time points. Data are mean ± standard deviation.
Figure 2.
Figure 2.
Clonal evolution during progression from MDS to secondary AML. Using previously published paired MDS and secondary AML samples from the same patients (N = 60),,,,,, the order of mutation acquisition was inferred by assessing the presence or absence of specific mutations at each sampling. (A) A model for sequential accumulation of mutations during progression from MDS to secondary AML. Black cells are normal at MDS and secondary AML. Mutations in blue are acquired early, define the founding clone, and expand to become the most abundant clone in the marrow at MDS diagnosis. These cells then acquire red mutations, form a subclone, and expand at the time of progression to secondary AML. (B) Percentage of patients with a mutation detectable at MDS only (yellow), secondary AML only (red), or at MDS and persisting during disease progression (blue). Mutations in specific functional categories are enriched in 1 of these patterns, with most TP53, epigenetic modifiers, and spliceosome gene mutations present at MDS (eg, 100% of DNMT3A mutations are blue), whereas mutations in transcription factors (eg, RUNX1, CEBPA) and activating signaling genes (RAS family, PTPN11, FLT3) typically expand or are acquired and emerge at progression (eg, 100% of FLT3 mutations are red). This suggests a typical order of mutation acquisition, with blue mutations being acquired early and present in the majority of marrow cells at MDS diagnosis, followed by the red mutations, which expand or are acquired and expand at progression. Only 1 mutation (shown in yellow) that was detected at MDS was not detected at secondary AML (SRSF2 mutation coding for the P95R substitution). Adapted from Lindsley et al.
Figure 3.
Figure 3.
Patterns of clonal evolution during the progression of MDS to secondary AML. Multiple patterns of subclone expansion are associated with progression from MDS to secondary AML. Subclones (red, green) can be acquired from the founding clone (blue) in a sequential (ie, linear) order (A) or in parallel (ie, branching) (B). Clonal evolution can also be influenced by treatment, including transplant and chemotherapy. (C) Although chemotherapy can suppress the founding clone [eg, lenalidomide in del(5q)-associated MDS], the acquisition of additional mutations (eg, TP53) or cytogenetic abnormalities can occur during disease progression and contribute to subclone expansion. Similar patterns of progression can occur following progression after a transplant. (D) Treatment may also cause subclone clearance while sparing the founding clone (eg, MEK inhibitor repressing a RAS-mutated subclone). Progression can occur when a new subclone emerges carrying additional mutations (green) that drive progression to secondary AML. allo-HSCT, allogeneic hematopoietic stem call transplant; CR, complete remission. Adapted from Nangalia et al.
Figure 4.
Figure 4.
Comparison of next-generation sequencing platforms. The optimal sequencing platform to use for clinical testing is dependent on several variables, include the cost, breadth of sequencing coverage (ie, the number of mutations that can be detected), and the typical sequencing depth obtained (ie, the sensitivity of variant detection). Although WGS provides the greatest breadth, the standard depth of coverage (30-45×) limits detection of variants to those with a VAF typically >10%. WES only provides coverage of coding bases in the genome, but the greater sequencing depth (typically 75-150×) allows for detection of mutations with VAFs as low as 5%. Gene panel sequencing is limited to the most commonly mutated genes but can detect mutations at lower VAFs. A typical 100-gene panel with 1000× coverage depth can detect mutations with VAFs as low as 2%, at a reasonable cost. Finally, error-corrected sequencing provides extremely high-depth coverage (10 000×) along with error correction via unique molecular indexes, together allowing for detection of VAFs < 1%. Error-corrected sequencing and gene panel sequencing approaches offer a large degree of flexibility, because they can be used to validate mutations (ie, those detected by WGS), track mutations, or discover mutations. In addition, these methods are often used without paired normal DNA to detect variants. However, germline DNA is necessary to definitively identify somatic mutations (+/−). Adapted from Jacoby et al.

References

    1. Nimer SD. Myelodysplastic syndromes. Blood. 2008;111(10):4841-4851. - PubMed
    1. Tefferi A, Vardiman JW. Myelodysplastic syndromes. N Engl J Med. 2009;361(19):1872-1885. - PubMed
    1. Swerdlow SH, Campo E, Harris NL, et al. . WHO Classification of Tumours of Haematopoietic and Lymphoid Tissues. 4th ed Lyon, France: International Agency for Research on Cancer; 2008.
    1. Cogle CR, Craig BM, Rollison DE, List AF. Incidence of the myelodysplastic syndromes using a novel claims-based algorithm: high number of uncaptured cases by cancer registries. Blood. 2011;117(26):7121-7125. - PMC - PubMed
    1. Goldberg SL, Chen E, Corral M, et al. . Incidence and clinical complications of myelodysplastic syndromes among United States Medicare beneficiaries. J Clin Oncol. 2010;28(17):2847-2852. - PubMed

Publication types

MeSH terms