Review
. 2020 May 4:11:550.
doi: 10.3389/fphar.2020.00550. eCollection 2020.

Structures Illuminate Cardiac Ion Channel Functions in Health and in Long QT Syndrome

Affiliations
Review

Structures Illuminate Cardiac Ion Channel Functions in Health and in Long QT Syndrome

Kathryn R Brewer et al. Front Pharmacol. .

Abstract

The cardiac action potential is critical to the production of a synchronized heartbeat. This electrical impulse is governed by the intricate activity of cardiac ion channels, among them the cardiac voltage-gated potassium (Kv) channels KCNQ1 and hERG as well as the voltage-gated sodium (Nav) channel encoded by SCN5A. Each channel performs a highly distinct function, despite sharing a common topology and structural components. These three channels are also the primary proteins mutated in congenital long QT syndrome (LQTS), a genetic condition that predisposes to cardiac arrhythmia and sudden cardiac death due to impaired repolarization of the action potential and has a particular proclivity for reentrant ventricular arrhythmias. Recent cryo-electron microscopy structures of human KCNQ1 and hERG, along with the rat homolog of SCN5A and other mammalian sodium channels, provide atomic-level insight into the structure and function of these proteins that advance our understanding of their distinct functions in the cardiac action potential, as well as the molecular basis of LQTS. In this review, the gating, regulation, LQTS mechanisms, and pharmacological properties of KCNQ1, hERG, and SCN5A are discussed in light of these recent structural findings.

Keywords: KCNQ1; SCN5A; cardiac action potential; hERG; long QT syndrome; structural biology.


Figures

Figure 1
Figure 1
Voltage-activated Na+ and K+ currents define the ventricular action potential and QT interval of the ECG. (A) ECG trace. The rapid upstroke of the ventricular action potential gives rise to the QRS complex. The duration of the QT interval is determined by the time of the ventricular repolarization. (B) Trace of the ventricular action potential. The rapidly activating and inactivating INa current drives membrane depolarization. Two K+ currents, IKs and IKr, contribute most to the plateau phase and repolarization phase of the action potential, which reestablishes the membrane resting potential. (C) Time course of INa, IKr, and IKs currents (not drawn to scale). Currents of other ion channels contributing to the action potential (e.g. ICa,L, IKur, and INCX) are not shown for clarity. This figure is inspired by figures in Moss and Kass (2005) and George (2013).
Figure 2
Figure 2
Overall topology of KCNQ1, hERG, and SCN5A channels. (A) KCNQ1 topology. Transmembrane domain alpha helices are labeled S0–S6. PH indicates the pore helix. SF denotes the selectivity filter. S2–S3 indicates the S2–S3 linker. S4–S5 denotes the S4–S5 linker. Cytosolic alpha helices are labeled HA-HD. (B) hERG topology. PAS denotes the Per-ARNT-Sim domain. CNBHD indicates the C-terminal cyclic nucleotide-binding homology domain. (C) SCN5A topology. CTD indicates the C-terminal domain. (D) Top views of the human KCNQ1 (PDB ID: 6UZZ) (Sun and Mackinnon, 2020), human hERG (PDB ID: 5VA1) (Wang and Mackinnon, 2017), and rat SCN5A (PDB ID: 6UZ3) (Jiang et al., 2020) channels, respectively. Outer voltage-sensing domains (VSD) and the central pore domain (PD) are labeled.
Figure 3
Figure 3
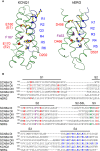
The voltage sensors of KCNQ1, hERG, and SCN5A. (A) Structure of the VSD from human KCNQ1 (left) (PDB: 6UZZ) (Sun and Mackinnon, 2020) and hERG (right) (PDB: 5VA2) (Wang and Mackinnon, 2017) in putative activated conformations. Basic residues on S4 (labeled in blue), acidic residues on S2 and S3 (labeled in red), and the phenylalanine residue in the gating charge transfer center (purple) are shown as sticks. The first four basic residues on S4 (R1–R4) in KCNQ1 and the first three (K1–R3) in hERG are located above the charge transfer center. (B) Multiple sequence alignment of VSDs I-IV of SCN5A with the VSDs of human KCNQ1 and hERG. Basic residues in S4 implicated with voltage sensing are colored blue, and acidic or polar residues in S1–S3 suggested to interact with S4 gating charges are colored red. The conserved aromatic residue at the gating charge transfer center in S2 is colored purple. Another tryptophan residue in S3, conserved in the VSDs of NaV channels and also present in hERG, is colored green.
Figure 4
Figure 4
The selectivity filters of K+ and Na+ channels. (A) Multiple sequence alignment of the SF region of selected K+ (left) and Na+ (right) channels. Conserved amino acids are highlighted in bold. Amino acids belonging to the DEKA signature motif in eukaryotic Na+ channels are colored red. (B) Side and top view of the SF of human KCNQ1 (PDB: 6UZZ) (Sun and Mackinnon, 2020). Two subunits are omitted for clarity in the left plot. (C) Side and top view of the SF of SCN5A (PDB: 6UZ3) (Jiang et al., 2020). Repeat II is omitted for clarity in the left plot.
Figure 5
Figure 5
Structural features of electromechanical coupling in the KCNQ1 and hERG channels. (A) Left: Extracellular view of KCNQ1 and hERG transmembrane segments S0 to S6. Individual subunits are drawn with different colors. KCNQ1 (PDB: 6UZZ) (Sun and Mackinnon, 2020) has a domain-swapped architecture whereas hERG (PDB: 5VA1) (Wang and Mackinnon, 2017) channels are non-domain-swapped. Right: Cartoon representation of a single subunit and its neighboring pore segments (S5 to S6). In KCNQ1, the VSD and PD are bridged by an extended α-helical S4–S5 linker, whereas in hERG, S4 and S5 are connected by only a short helix. (B) Implications for the direction of coupled motions between the VSD and PD based on molecular modeling of KCNQ1 in open and closed conformations (top) and comparison of the open state structure of hERG with the closed state structure of EAG1 (PDB: 5K7L) (Whicher and Mackinnon, 2016) (bottom). In the domain-swapped KCNQ1 channel, the S4 movement is transmitted to the gate through the S4–S5 linker. In hERG and EAG1, the S4 movement is proposed to exert a direct force on the S5–S6 interface to compress or open the channel gate.
Figure 6
Figure 6
Structural mechanisms of NaV channel inactivation. (A) NaV channels transition from an activated open state to a non-conducting inactivated state after depolarization. Inactivation is induced by binding of a C-terminal motif (yellow) to the cytosolic side of the channel leading to pore closure. The cell membrane is indicated with a gray rectangle, with the extracellular (EXT) and intracellular space (INT) labeled. (B) Closed state model of SCN5A (Kroncke et al., 2019) highlighting structural elements involved in fast inactivation. The III-IV linker (cyan) connecting S6III (blue) with VSDIV (green) contains the IFM motif (yellow spheres) which is the key structural element responsible for inactivation. The position of the III-IV linker is constrained by the CTD following S6IV. (C) Comparison of the SCN5A model in (B) with a cryo-EM structural model of rat SCN5A (PDB: 6UZ3)(Jiang et al., 2020) in a putative inactivated state viewed from the intracellular side. The III-IV linker undergoes a large shift in the SCN5A structure and the IFM motif is docked into a pocket surrounded by the S4–S5 linkers and S6 helices of repeats III and IV. (D) Structural states and transitions proposed to be involved in fast inactivation in NaV channels. Left: Structure of a chimeric NaV1.7–NaVPaS channel (Clairfeuille et al., 2019) (PDB: 6NT3) with S4IV in a “down” position and an IFM-like motif unbound. Basic sites R5–R8 bridge to conserved acidic residues on the CTD which facilitates binding of the III-IV linker to S6IV. Middle: Structure of a chimeric NaV1.7–NaVPaS channel (Clairfeuille et al., 2019) (PDB: 6NT4) with S4IV in a ‘up’ position and an IFM-like motif unbound. The electrostatic bridge between S4IV and the CTD is broken possibly increasing the positional dynamics of the CTD and III-IV linker. Right: Structure of SCN5A (PDB: 6UZ3) (Jiang et al., 2020) with S4IV in an ‘up’ position and the IFM motif plugged into the cytosolic cavity between repeats III and IV. Note, that the CTD is missing in the cryo-EM structure. (E) IFM binding pocket residues on S4–S5III, S4–S5IV, S6III, and S6IV of SCN5A (PDB: 6UZ3) (Jiang et al., 2020). The S6IV helix backbone in the front is not shown for clarity. Residues that are important for fast inactivation and those found in various types of myotonia (Pan et al., 2018) are labeled magenta and orange, respectively.
Figure 7
Figure 7
Binding sites of KCNE proteins on the KCNQ1 channel. (A) Left: Mapping of putative KCNE binding sites onto the human KCNQ1 structure (PDB: 6V00) (Sun and Mackinnon, 2020). The position of residues identified to interact with KCNE1 (purple) are indicated by spheres. Right: Cryo-EM structure of human KCNQ1 with CaM and KCNE3 (PDB: 6v00)(Sun and Mackinnon, 2020). (B) KCNQ1/KCNE3 interaction sites. Left: 6V00. Right: KCNQ1/KCNE3 Rosetta model (Kroncke et al., 2016). Interactions sites were calculated with the InterResidues Python script in PYMOL (The PyMOL Molecular Graphics System, Version 2.2 Schrödinger, LLC.). Interaction positions indicated with sticks. (C) Example current traces of KCNQ1 alone or with KCNE proteins. Adapted with permission from (Van Horn et al., 2011).
Figure 8
Figure 8
Binding sites of lipids on the KCNQ1 channel. (A) Mapping of positions that have been implicated in the regulation of KCNQ1 by PUFAs (cyan) and PIP2 (yellow) onto the PIP2-bound KCNQ1 structure (6V01) (Sun and Mackinnon, 2020). Inset: the PIP2 cryo-EM binding site. (B) Left: Effect of the PUFA head group charge on the voltage dependence of KCNQ1 conductance (inspired from results in Liin et al., 2015). Right: PIP2 depletion reduces KCNQ1 ionic currents due to decreased VSD-PD coupling.
Figure 9
Figure 9
Human KCNQ1 structure with deleterious mutation sites indicated. (A) Full KCNQ1 structure (PDB: 6UZZ) (Sun and Mackinnon, 2020). Yellow sites denote locations of a single deleterious mutation, while red indicates sites with multiple mutations identified. Spheres indicate C-alpha positions of mutation sites. Subunit with LQT1 mutations sites mapped is colored green. Inset: of SF and pore helix. (B) KCNQ1 VSD. (C) S4–S5 linker (S4–S5) interaction site close-up. One subunit is colored green and the others in gray, for clarity. The PAG motif (PAG) is indicated with sticks. (D) Top: HC coiled-coil domain. Bottom: HD coiled-coil domain (PDB: 3BJ4) (Wiener et al., 2008). Residue side chains are indicated with sticks.
Figure 10
Figure 10
hERG structure with deleterious mutation sites indicated. (A) Full hERG structure (PDB: 5VA1) (Wang and Mackinnon, 2017). Yellow sites denote locations of a single deleterious mutation, while red indicates sites with multiple mutations identified. Spheres indicate C-alpha positions of mutation sites. Subunit with LQT2 mutations sites mapped is colored green. Inset: close-up of SF and pore helix. (B) hERG VSD. (C). Close-up of the S1/S5 interface. Residues at the interface are indicated with sticks (D) N-terminal PAS (dark gray) and C-terminal CNBHD (light gray) domain interface, cartoon representation with surface representation overlay. One subunit is green and the other gray, for clarity.
Figure 11
Figure 11
Rat SCN5A structure with deleterious mutation sites indicated. (A) Full SCN5A structure (PDB: 6UZ3) (Jiang et al., 2020). Yellow sites denote locations of a single deleterious mutation, while red indicates sites with multiple mutations identified. Spheres indicate C-alpha positions of mutation sites. Side views of individual repeats are shown with 90° rotations between panels. In each panel, one repeat is colored green and LQT3 mutation sites for that repeat are mapped. (B) C-terminal domain with bound III/IV linker (human SCN5A model: [(Kroncke Bm, 2019)]. (C) Putative inactivation gate. IFM motif is indicated with sticks. (D) SCN5A constriction site. S6 helices are shown at full opacity, with the IFM motif indicated with sticks.
Figure 12
Figure 12
Structural features of the drug-binding cavity of the hERG channel pore. (A) Examples of drugs discontinued by the US FDA because of side effects related to hERG inhibition (adapted from Table 1 in (Kalyaanamoorthy and Barakat, 2018)). (B) Internal molecular surface of the central cavity below the SF in hERG (PDB: 5VA1)(Wang and Mackinnon, 2017) (top) and the KV1.2–2.1 chimeric channel (PDB: 2R9R)(Long et al., 2007) (bottom). The surface is colored by the electrostatic potential calculated with the APBS tool in PyMOL (The PyMOL Molecular Graphics System, Version 2.2 Schrödinger, LLC.). Residues related to drug binding by hERG and the corresponding residues in the KV1.2–2.1 structure are shown as sticks. This panel is inspired by Figure 5 in (Wang and Mackinnon, 2017).

Similar articles

Cited by

References

    1. Abbott G. W., Sesti F., Splawski I., Buck M. E., Lehmann M. H., Timothy K. W., et al. (1999). MiRP1 forms IKr potassium channels with HERG and is associated with cardiac arrhythmia. Cell 97, 175–187. 10.1016/S0092-8674(00)80728-X - DOI - PubMed
    1. Abbott G. W., Xu X., Roepke T. K. (2007). Impact of ancillary subunits on ventricular repolarization. J. Electrocardiol. 40, S42–S46. 10.1016/j.jelectrocard.2007.05.021 - DOI - PMC - PubMed
    1. Abbott G. W. (2014). Biology of the KCNQ1 Potassium Channel. New J. Sci. 2014, 26. 10.1155/2014/237431 - DOI
    1. Ackerman M. J. (2005). Genotype-phenotype relationships in congenital long QT syndrome. J. Electrocardiol. 38, 64–68. 10.1016/j.jelectrocard.2005.06.018 - DOI - PubMed
    1. Adler A., Novelli V., Amin A. S., Abiusi E., Care M., Nannenberg E. A., et al. (2020). An International, Multicentered, Evidence-Based Reappraisal of Genes Reported to Cause Congenital Long QT Syndrome. Circulation 141, 418–428. 10.1161/CIRCULATIONAHA.119.043132 - DOI - PMC - PubMed