. 2020 May 5:11:845.
doi: 10.3389/fimmu.2020.00845. eCollection 2020.

A Pauci-Immune Synovial Pathotype Predicts Inadequate Response to TNFα-Blockade in Rheumatoid Arthritis Patients

Affiliations

A Pauci-Immune Synovial Pathotype Predicts Inadequate Response to TNFα-Blockade in Rheumatoid Arthritis Patients

Alessandra Nerviani et al. Front Immunol. .

Abstract

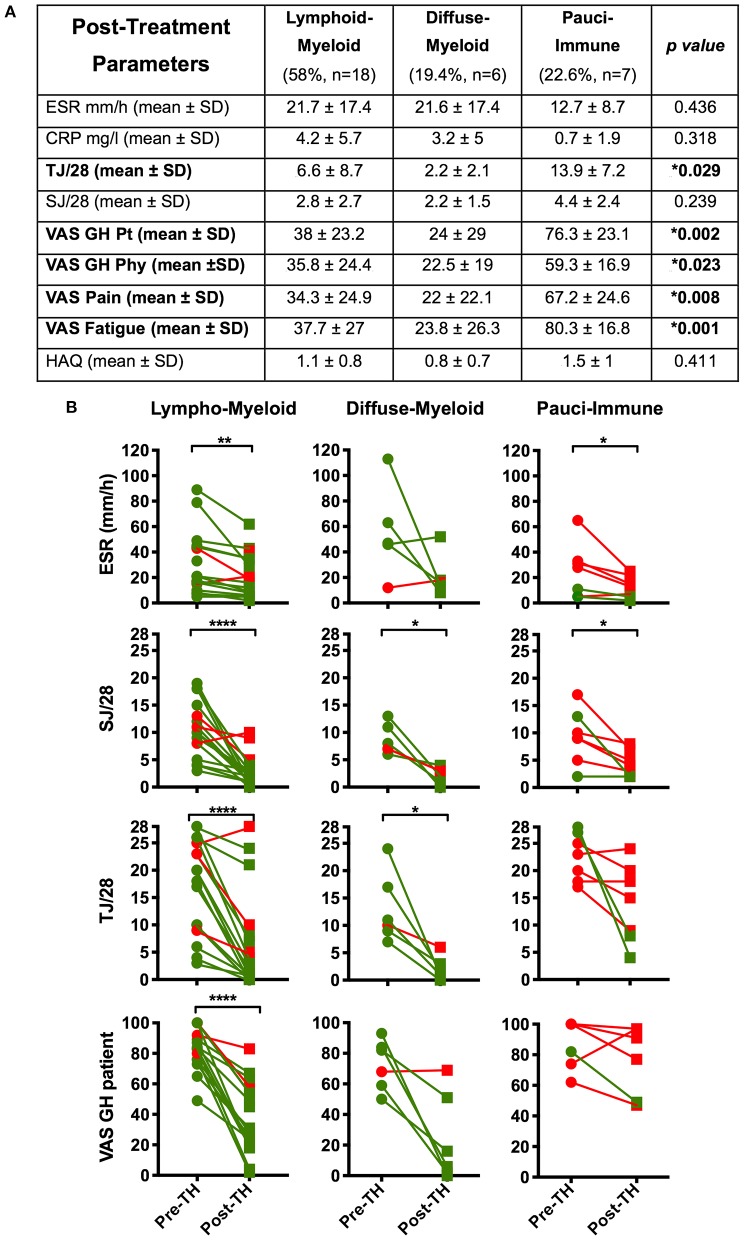
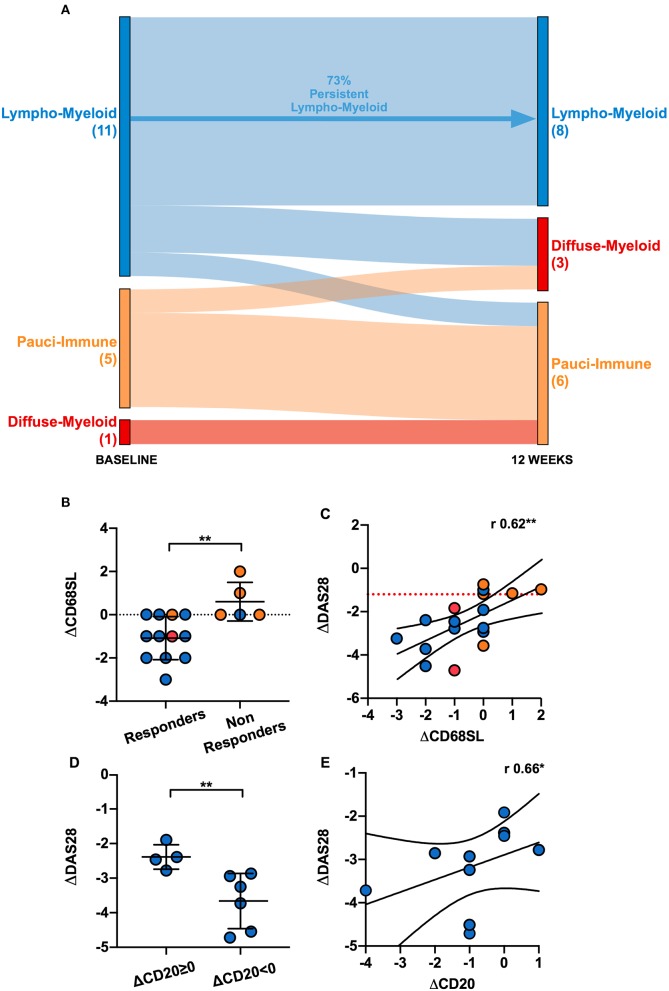
Objectives: To assess whether the histopathological features of the synovium before starting treatment with the TNFi certolizumab-pegol could predict clinical outcome and examine the modulation of histopathology by treatment. Methods: Thirty-seven RA patients fulfilling UK NICE guidelines for biologic therapy were enrolled at Barts Health NHS trust and underwent synovial sampling of an actively inflamed joint using ultrasound-guided needle biopsy before commencing certolizumab-pegol and after 12-weeks. At 12-weeks, patients were categorized as responders if they had a DAS28 fall >1.2. A minimum of 6 samples was collected for histological analysis. Based on H&E and immunohistochemistry (IHC) staining for CD3 (T cells), CD20 (B cells), CD138 (plasma cells), and CD68 (macrophages) patients were categorized into three distinct synovial pathotypes (lympho-myeloid, diffuse-myeloid, and pauci-immune). Results: At baseline, as per inclusion criteria, DAS28 mean was 6.4 ± 0.9. 94.6% of the synovial tissue was retrieved from the wrist or a metacarpophalangeal joint. Histological pathotypes were distributed as follows: 58% lympho-myeloid, 19.4% diffuse-myeloid, and 22.6% pauci-immune. Patients with a pauci-immune pathotype had lower levels of CRP but higher VAS fatigue compared to lympho- and diffuse-myeloid. Based on DAS28 fall >1.2, 67.6% of patients were deemed as responders and 32.4% as non-responders. However, by categorizing patients according to the baseline synovial pathotype, we demonstrated that a significantly higher number of patients with a lympho-myeloid and diffuse-myeloid pathotype in comparison with pauci-immune pathotype [83.3% (15/18), 83.3 % (5/6) vs. 28.6% (2/7), p = 0.022) achieved clinical response to certolizumab-pegol. Furthermore, we observed a significantly higher level of post-treatment tender joint count and VAS scores for pain, fatigue and global health in pauci-immune in comparison with lympho- and diffuse-myeloid patients but no differences in the number of swollen joints, ESR and CRP. Finally, we confirmed a significant fall in the number of CD68+ sublining macrophages post-treatment in responders and a correlation between the reduction in the CD20+ B-cells score and the improvement in the DAS28 at 12-weeks. Conclusions: The analysis of the synovial histopathology may be a helpful tool to identify among clinically indistinguishable patients those with lower probability of response to TNFα-blockade.

Keywords: anti-TNF; certolizumab-pegol; pathotype; rheumatoid arthritis; synovial tissue.


Figures

Figure 1
Figure 1
(A–F) Design of the study and histological characterization of the synovial tissue. (A) Timeline of the study, which included a baseline US-guided needle synovial biopsy at week 0 (37 patients) and a second biopsy of the same joint after 12-weeks of treatment with certolizumab-pegol (28 patients). At the top, representative gray-scale transverse section of an US-guided wrist biopsy showing the needle entering the joint space underneath the IV extensor tendons compartment. (B) Distribution (%) of synovial pathotypes at baseline. (C) Representative images of immunohistochemistry staining of synovial tissue for immune cells markers and classification in three pathotypes: lympho-myeloid, diffuse-myeloid and pauci-immune. Original magnification 4x. (D) Heatmap showing the degree of infiltration of immune cells (CD20, B-cells; CD138, plasma cells; CD3, T-cells; CD68L, macrophages of the lining; CD68SL, macrophages of the sublining) in each pathotype. (E) Distribution (%) of biopsied joints. (F) Histological pathotype according to synovial biopsy site. MCP, metacarpophalangeal. Fisher's test: not significant.
Figure 2
Figure 2
(A–D) Violin plots showing differences in CRP (A), VAS fatigue (0–100) (B), ultrasound (US) Power-Doppler (PD) score (0–3) (C) and US synovial thickening (ST) score measured in gray-scale (0–3) (D) of the biopsied joints between pathotype groups. Median and interquartile ranges are represented by thick and thin dotted lines, respectively. **p < 0.01, *p < 0.05, Kruskal-Wallis with post-hoc multiple comparison on 31 patients.
Figure 3
Figure 3
(A) Table summarizing clinical response rates by pathotypes to certolizumab-pegol at 12-weeks. ΔDAS28 was calculated by subtracting the baseline-DAS28 value from the 12-weeks-DAS28; DAS28 fall > 1.2 defined “responders.” Distribution of response rates was tested by Fisher's exact test while differences in ΔDAS28 by Kruskal-Wallis with Dunn's test. SD, standard deviation. (B) Comparison of pre- (pre-TH) and post-treatment (post-TH) DAS28 by pathotype. ***p < 0.001, **p < 0.01, Kruskal-Wallis with post-hoc Dunn's multiple comparison test on 31 patients. Red dotted line represents DAS28 5.1 (“high disease activity”); green dotted line represents DAS28 3.2 (“low disease activity”).
Figure 4
Figure 4
(A) Table summarizing the comparison by pathotype of the patients' clinical features at 12-weeks post-treatment (*Kruskal-Wallis with Dunn's correction). Significantly different variables are in bold. (B) Comparison of pre- (pre-TH) and post-treatment (post-TH) individual parameters of the DAS28 by pathotype. p values were calculated with Wilcoxon matched-pairs rank test (31 patients); ****p < 0.0001, ***p < 0.001, **p < 0.01, *p < 0.05. Green dots and line: “responders”; red dots and lines: “non-responders”. SD, Standard Deviation; ESR, erythrocyte sedimentation rate; CRP, C- Reactive Protein; TJ, Tender Joints; SJ, Swollen Joints; VAS, Visual Analog Scale (0–100); GH, Global Health; pt, patient; phy, physician; tir, tiredness; HAQ, Health Assessment Questionnaire.
Figure 5
Figure 5
(A) Sankey diagram representing the shift of pathotypes from pre- to post-treatment of the 17 patients who had gradable tissue both at baseline and 12-weeks. (B) Comparison of the delta (Δ) CD68 sublining (SL) score between responders and non-responders. ΔCD68SL is the difference in the CD68SL semi-quantitative score (0–4) between post- and pre-treatment. Mean and standard deviation shown. **p < 0.01 (Mann-Whitney). (C) Correlation plot showing ΔDAS28[12−weeks−baseline] and ΔCD68SL[12−weeks−baseline]; r Spearman coefficient of correlation, **p < 0.01. (D) Comparison of ΔDAS28 between patients with same/higher (ΔCD20≥0) or reduced CD20+ B-cells score (ΔCD20 < 0) post treatment. **p < 0.01 (Mann-Whitney, mean and standard deviation shown). (E) Correlation plot showing ΔDAS28[12−weeks−baseline] and ΔCD20[12−weeks−baseline]. r Spearman coefficient of correlation, **p < 0.01. Only responder lympho-myeloid patients were analyzed in (D,E) (10 patients). (B–E) Individual dots are color-coded by pathotype (blue, lympho-myeloid; red, diffuse-myeloid; orange, pauci-immune).

Similar articles

Cited by

References

    1. Safiri S, Kolahi AA, Hoy D, Smith E, Bettampadi D, Mansournia MA, et al. . Global, regional and national burden of rheumatoid arthritis 1990-2017: a systematic analysis of the global burden of disease study 2017. Ann Rheum Dis. (2019) 78:1463–71. 10.1136/annrheumdis-2019-215920 - DOI - PubMed
    1. Salliot C, Finckh A, Katchamart W, Lu Y, Sun Y, Bombardier C, et al. Indirect comparisons of the efficacy of biological antirheumatic agents in rheumatoid arthritis in patients with an inadequate response to conventional disease-modifying antirheumatic drugs or to an anti-tumour necrosis factor agent: a meta-analysis. Ann Rheum Dis. (2011) 70:266–71. 10.1136/ard.2010.132134 - DOI - PubMed
    1. Cuppen BVJ, Welsing PMJ, Sprengers JJ, Bijlsma JWJ, Marijnissen ACA, van Laar JM, et al. . Personalized biological treatment for rheumatoid arthritis: a systematic review with a focus on clinical applicability. Rheumatology. (2016) 55:826–39. 10.1093/rheumatology/kev421 - DOI - PubMed
    1. Machold KP, Stamm TA, Nell VPK, Pflugbeil S, Aletaha D, Steiner G, et al. . Very recent onset rheumatoid arthritis: clinical and serological patient characteristics associated with radiographic progression over the first years of disease. Rheumatology. (2007) 46:342–9. 10.1093/rheumatology/kel237 - DOI - PubMed
    1. Pitzalis C, Kelly S, Humby F. New learnings on the pathophysiology of RA from synovial biopsies. Curr Opin Rheumatol. (2013) 25:334–44. 10.1097/BOR.0b013e32835fd8eb - DOI - PubMed

Publication types

MeSH terms