. 2020 Feb 5;13(5):974-990.
doi: 10.1111/eva.12914. eCollection 2020 May.

Spatial genetic structure in a crustacean herbivore highlights the need for local considerations in Baltic Sea biodiversity management

Affiliations

Spatial genetic structure in a crustacean herbivore highlights the need for local considerations in Baltic Sea biodiversity management

Pierre De Wit et al. Evol Appl. .

Abstract

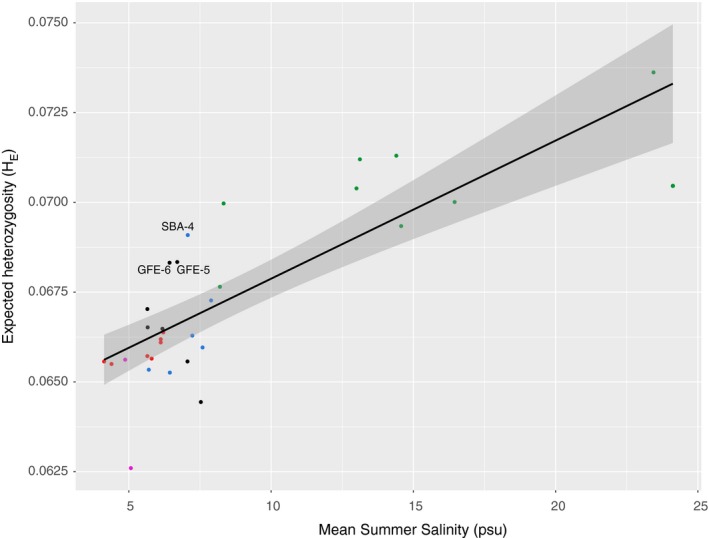
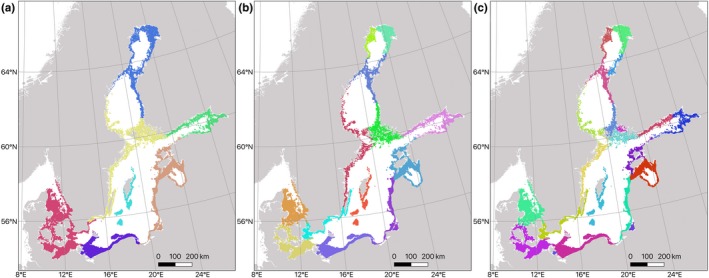
Incorporating species' eco-evolutionary responses to human-caused disturbances remains a challenge in marine management efforts. A prerequisite is knowledge of geographic structure and scale of genetic diversity and connectivity-the so-called seascape genetic patterns. The Baltic Sea is an excellent model system for studies linking seascape genetics with effects of anthropogenic stress. However, seascape genetic patterns in this area are only described for a few species and are completely unknown for invertebrate herbivores, which constitute a critical part of the ecosystem. This information is crucial for sustainable management, particularly under future scenarios of rapid environmental change. Here, we investigate the population genetic structure among 31 locations throughout the Baltic Sea, of which 45% were located in marine protected areas, in one of the most important herbivores of this region, the isopod crustacean Idotea balthica, using an array of 33,774 genome-wide SNP markers derived from 2b-RAD sequencing. In addition, we generate a biophysical connectivity matrix for I. balthica from a combination of oceanographic current models and estimated life history traits. We find population structure on scales of hundreds of kilometers across the Baltic Sea, where genomic patterns in most cases closely match biophysical connectivity, indicating passive transport with oceanographic currents as an important mean of dispersal in this species. We also find a reduced genetic diversity in terms of heterozygosity along the main salinity gradient of the Baltic Sea, suggesting periods of low population size. Our results provide crucial information for the management of a key ecosystem species under expected changes in temperature and salinity following global climate change in a marine coastal area.

Keywords: Baltic Sea; Idotea balthica; connectivity; marine protected areas; seascape genetics.


Figures

Figure 1
Figure 1
Map of the study area (the Baltic Sea), with collecting locations marked with dots colored by region
Figure 2
Figure 2
Expected heterozygosity (H E) as a function of salinity in the Baltic Sea (p = 8.5E‐08), with dots colored by region
Figure 3
Figure 3
Constrained ordination plot of identity‐by‐state distances among all I. balthica individuals used in this study
Figure 4
Figure 4
(a) Admixture plot at K = 3. (b) Pie charts of admixture coefficients inferred by conStruct (K = 3), plotted on a map of the Baltic Sea
Figure 5
Figure 5
(a) Admixture plot at K = 12. (b, c) Spatially inferred genetic structure. (b) Admixture coefficients interpolated geographically, with population clusters in different color scales (K = 12). Admixture coefficients are illustrated in different color scales, approaching 1 in dark shades, and lower scores in progressively lighter ones. Regions with steep color gradients can be thought of as areas with dispersal barriers, separating genetically divergent populations; (c) within‐deme effective genetic diversity q (on the log10 scale), a parameter that reflects the expected genetic differences among two individuals collected at the same site, extrapolated geographically, with higher than mean diversity in red and lower in blue
Figure 6
Figure 6
Biophysical connectivity matrix among the sites used in this study, based on a multigenerational iteration of the particle tracking model
Figure 7
Figure 7
Connectivity barrier inference based on the biophysical model of dispersal, clustering areas of high connectivity marked as different colors. Threshold for barrier identification ranges from low dispersal probability between regions (0.001) in panel (a) intermediate (0.002) in panel (b), and high (0.003) in panel (c)
Figure 8
Figure 8
Pairwise F ST as a function of log10 mean connectivity. Two separate correlations are found for pairwise comparisons involving Swedish Bothnian Sea (SBO) samples (yellow triangles; p < 2E‐16; R 2 = 0.76) and pairwise comparisons among all other samples (blue dots; p < 2E‐16; R 2 = 0.44)

References

    1. Ardehed, A. , Johansson, D. , Sundqvist, L. , Schagerström, E. , Zagrodzka, Z. , Kovaltchouk, N. A. , … Johannesson, K. (2016). Divergence within and among seaweed siblings (Fucus vesiculosus and F. radicans) in the Baltic Sea. PLoS ONE, 11, e0161266. - PMC - PubMed
    1. Barth, J. M. I. , Villegas‐Ríos, D. , Freitas, C. , Moland, E. , Star, B. , André, C. , … Jentoft, S. (2019). Disentangling structural genomic and behavioural barriers in a sea of connectivity. Molecular Ecology, 28, 1394–1411. 10.1111/mec.15010 - DOI - PMC - PubMed
    1. Bell, T. M. , & Sotka, E. E. (2012). Local adaptation in adult feeding preference and juvenile performance in the generalist herbivore Idotea balthica . Oecologia, 170, 383–393. 10.1007/s00442-012-2302-3 - DOI - PubMed
    1. Berg, P. R. , Jentoft, S. , Star, B. , Ring, K. H. , Knutsen, H. , Lien, S. , … André, C. (2015). Adaptation to low salinity promotes genomic divergence in Atlantic cod (Gadus morhua L.). Genome Biology and Evolution, 7, 1644–1663. 10.1093/gbe/evv093 - DOI - PMC - PubMed
    1. Bierne, N. , Welch, J. , Loire, E. , Bonhomme, F. , & David, P. (2011). The coupling hypothesis: Why genome scans may fail to map local adaptation genes. Molecular Ecology, 20, 2044–2072. 10.1111/j.1365-294X.2011.05080.x - DOI - PubMed

LinkOut - more resources