. 2020 Feb 27;13(5):1037-1054.
doi: 10.1111/eva.12919. eCollection 2020 May.

Genotyping-by-sequencing illuminates high levels of divergence among sympatric forms of coregonines in the Laurentian Great Lakes

Affiliations

Genotyping-by-sequencing illuminates high levels of divergence among sympatric forms of coregonines in the Laurentian Great Lakes

Amanda S Ackiss et al. Evol Appl. .

Abstract

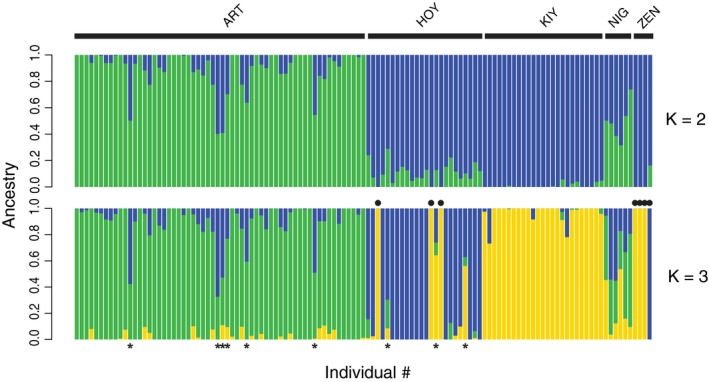
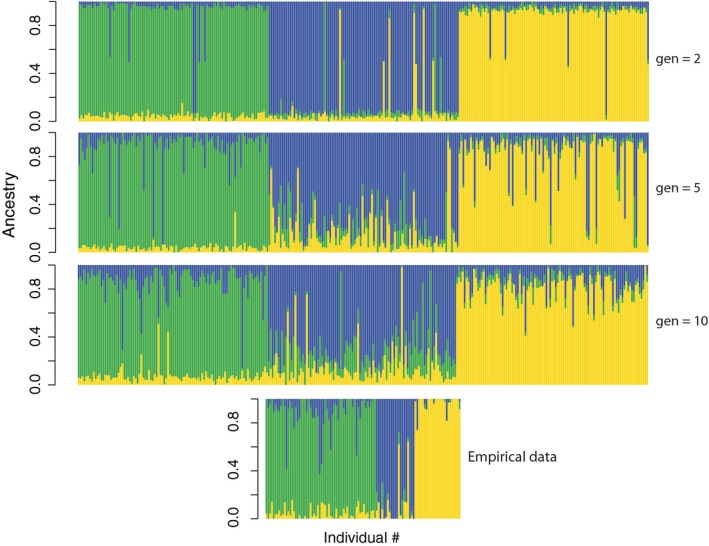
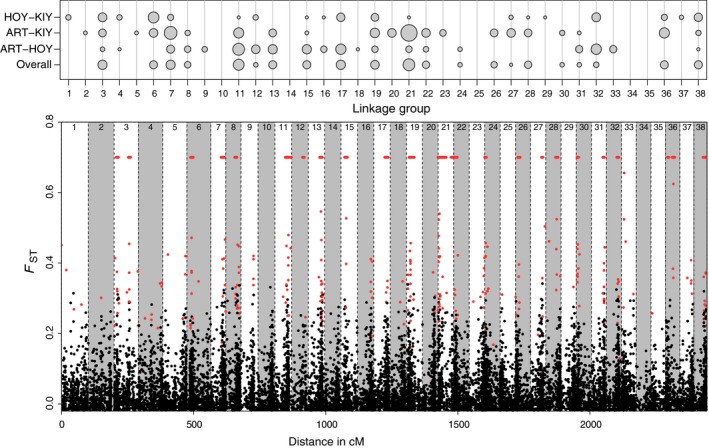
Effective resource management depends on our ability to partition diversity into biologically meaningful units. Recent evolutionary divergence, however, can often lead to ambiguity in morphological and genetic differentiation, complicating the delineation of valid conservation units. Such is the case with the "coregonine problem," where recent postglacial radiations of coregonines into lacustrine habitats resulted in the evolution of numerous species flocks, often with ambiguous taxonomy. The application of genomics methods is beginning to shed light on this problem and the evolutionary mechanisms underlying divergence in these ecologically and economically important fishes. Here, we used restriction site-associated DNA (RAD) sequencing to examine genetic diversity and differentiation among sympatric forms in the Coregonus artedi complex in the Apostle Islands of Lake Superior, the largest lake in the Laurentian Great Lakes. Using 29,068 SNPs, we were able to clearly distinguish among the three most common forms for the first time, as well as identify putative hybrids and potentially misidentified specimens. Population assignment rates for these forms using our RAD data were 93%-100% with the only mis-assignments arising from putative hybrids, an improvement from 62% to 77% using microsatellites. Estimates of pairwise differentiation (F ST: 0.045-0.056) were large given the detection of hybrids, suggesting that reduced fitness of hybrid individuals may be a potential mechanism for the maintenance of differentiation. We also used a newly built C. artedi linkage map to look for islands of genetic divergence among forms and found widespread differentiation across the genome, a pattern indicative of long-term drift, suggesting that these forms have been reproductively isolated for a substantial amount of time. The results of this study provide valuable information that can be applied to develop well-informed management strategies and stress the importance of re-evaluating conservation units with genomic tools to ensure they accurately reflect species diversity.

Keywords: RAD sequencing; adaptive divergence; conservation units; coregonines; genomic islands of divergence; hybridization; population genomics; species complex.


Conflict of interest statement

None declared.

Figures

Figure 1
Figure 1
Map of sample sites in the Apostle Islands. INSET (upper right): Location of the Apostle Islands, gray box, within Lake Superior. INSET (lower right): Photos of the three most common cisco forms found in Lake Superior from Eshenroder et al. (2016), used with permission from the author
Figure 2
Figure 2
Principal components analysis with RAD (a) and microsatellite (b) data. The percentage of variance explained by each principal component (PC) is labeled on the x‐ and y‐axes
Figure 3
Figure 3
Genetic lineages in Apostle Islands ciscoes estimated with ADMIXTURE. Each vertical bar represents a single individual and is colored by the proportion of ancestry (Q) assigned to each genetic lineage (K). In the K = 3 plot (bottom), filled circles represent putatively misidentified individuals within forms (with Q‐scores of 100% to other forms) and asterisks represent putative hybrids based on a Q‐score threshold of less than 70%
Figure 4
Figure 4
Levels of genetic admixture in three simulated populations after 2, 5, and 10 generations (gen) of stepping‐stone migration. Simulations were run with random mating of 1,000 females and 1,000 males in each population using 8,000 biallelic loci, and preliminary conditions that produced a similar level of differentiation observed in our RAD dataset among forms (F ST ≈ 0.05; 1,000 generations with an island migration rate of 0.001). Each ADMIXTURE plot represents a random subset of 50 males and 50 females from each population. Empirical data were reduced to a dataset of 8,000 randomly selected, neutral loci that could be placed on the linkage map and run in ADMIXTURE for comparison to simulated data
Figure 5
Figure 5
Genetic differentiation across the genome visualized with a bubble plot (top) and plot with the overall F ST of each marker (bottom). The size of each bubble in the bubble plot represents the number of genomic windows that were significantly differentiated from the rest of the genome according to kernel smoothing analysis for each form comparison. The “overall” designation is overall F ST across the dataset. Each dot in the graph of differentiation across the genome represents a marker, and red lines denote significantly differentiated windows. Red dots are loci that were found to be putatively under divergent selection in either Bayescan or PCAdapt. Linkage groups are separated by dashed lines. Form abbreviations are in Table 1. See Figures [Link], [Link], [Link], [Link] for visualizations of genetic differentiation for each chromosome and form comparison
Figure 6
Figure 6
Investigation of genetic differentiation on linkage group Cart21, the linkage group with the most significantly differentiated windows. (a) Genetic differentiation (overall F ST) at 351 loci that were placed on Cart21 in the cisco linkage map. The top ten loci with the highest F ST are colored red. Red lines denote significantly differentiated windows. (b) Recombination distance on cisco linkage group Cart21 (y‐axis) versus physical distance on Atlantic salmon chromosome Ssa05 (x‐axis). (c) Genetic differentiation (overall F ST) at 152 loci from Cart21 that successfully aligned to Ssa05, the syntenic chromosome in Atlantic salmon. Six of the top ten loci from panel a aligned to Ssa05 and are colored red. Blue lines indicate the position of genes on Ssa05. (d) Allele frequencies of the loci with the highest F ST from Cart21. Loci are ordered from highest F ST (bottom) to lowest. Form abbreviations are found in Table 1

References

    1. Ackiss, A. , Larson, W. , & Stott, W. (2020), Data from: Genotyping‐by‐sequencing illuminates high levels of divergence among sympatric forms of coregonines in the Laurentian Great Lakes Dryad Dataset, 10.5061/dryad.cjsxksn2m - DOI - PMC - PubMed
    1. Alexander, D. H. , Novembre, J. , & Lange, K. (2009). Fast model‐based estimation of ancestry in unrelated individuals. Genome Research, 19(9), 1655–1664. 10.1101/gr.094052.109 - DOI - PMC - PubMed
    1. Ali, O. A. , O'Rourke, S. M. , Amish, S. J. , Meek, M. H. , Luikart, G. , Jeffres, C. , & Miller, M. R. (2016). RAD capture (rapture): Flexible and efficient sequence‐based genotyping. Genetics, 202(2), 389–400. 10.1534/genetics.115.183665 - DOI - PMC - PubMed
    1. Allendorf, F. W. , Hohenlohe, P. A. , & Luikart, G. (2010). Genomics and the future of conservation genetics. Nature Reviews Genetics, 11(10), 697 10.1038/nrg2844 - DOI - PubMed
    1. Allendorf, F. , & Luikart, G. (2007). Conservation and the genetics of populations. Oxford, UK:Blackwell Publishing Ltd.

LinkOut - more resources