. 2020 May 5:10:544.
doi: 10.3389/fonc.2020.00544. eCollection 2020.

Anti-CS1 × Anti-CD3 Bispecific Antibody (BiAb)-Armed Anti-CD3 Activated T Cells (CS1-BATs) Kill CS1+ Myeloma Cells and Release Type-1 Cytokines

Affiliations

Anti-CS1 × Anti-CD3 Bispecific Antibody (BiAb)-Armed Anti-CD3 Activated T Cells (CS1-BATs) Kill CS1+ Myeloma Cells and Release Type-1 Cytokines

Lawrence G Lum et al. Front Oncol. .

Abstract

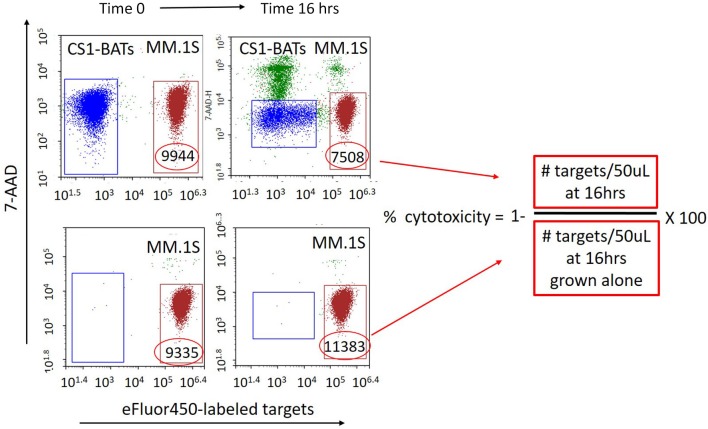
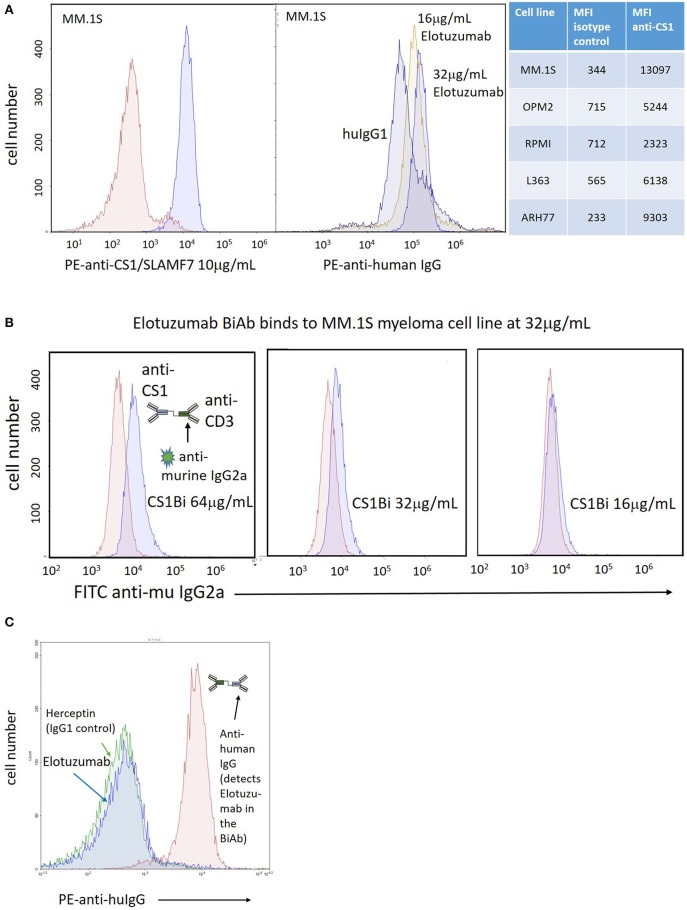
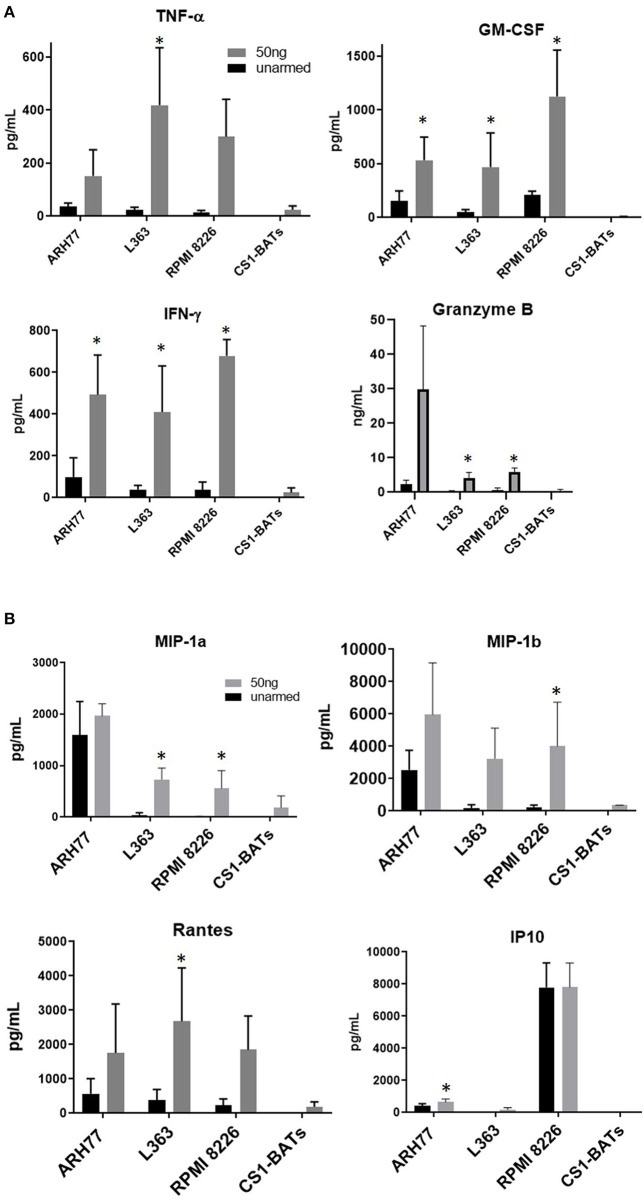
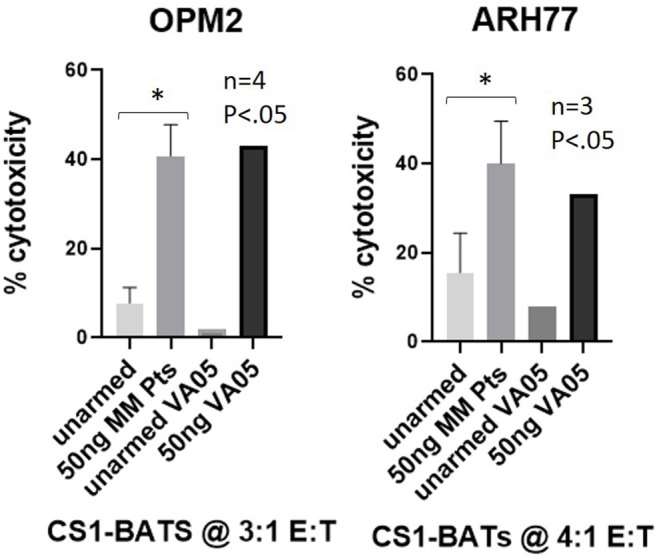
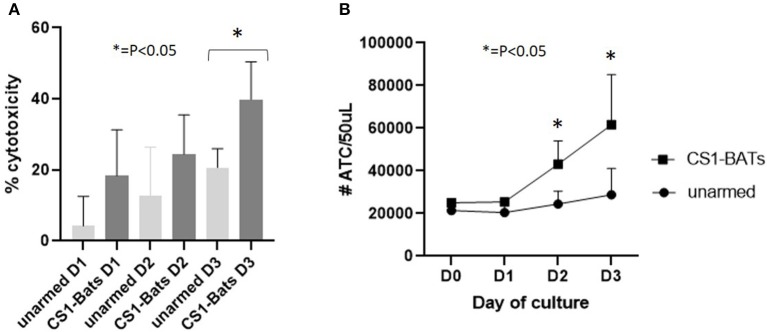
Background: Multiple myeloma (MM) remains incurable despite significant advances in chemotherapy, targeted therapies, and immunotherapy. Bispecific antibody (BiAb)-armed activated T cells (BATs) have been developed for targeting and treatment of solid and hematologic malignancies. BATs are serial killers of tumor cells, secrete Th1 cytokines, and induce adaptive cellular and humoral immune responses in patients (pts). This study provides preclinical data using bispecific anti-CS1 (elotuzumab) × anti-CD3 (OKT3) antibody (CS1Bi)-armed activated T cells (CS1- BATs) that provide a strong rationale for applying CS1-BATs to pts with MM. Methods: CS1-BATs and unarmed activated T cells (ATC) were incubated with MM cell targets at various effector to target ratios (E:T) in a quantitative flow cytometry-based assay to determine the degree of cell loss relative to target cells incubated without ATC. ATC from up to 8 normal donors were armed with various concentrations of CS1 BiAb and tested against 5 myeloma cells lines for CS1-BATs-mediated killing and release of Th1 cytokines, chemokines and granzyme B. Results: CS1-BATs from normal donors killed each of 5 MM cell lines proportional to E:T ratios ranging between 1:1 and 10:1 and arming concentrations of 12.5 to 50 ng/million ATC, which was accompanied by release of Th1 cytokines, chemokines and granzyme B. CS1-BATs prepared from MM pts' peripheral blood mononuclear cells (PBMC) showed increasing cytotoxicity and T cell expansion over time against ARH77 MM cells. The optimal arming dose of CS1Bi is 50 ng/106 ATC. Conclusions: These data demonstrate the therapeutic potential of CS1-BATs-mediated cytotoxicity and Th1 cytokines release at low E:T and support advancing their clinical development in pts with MM.

Keywords: cytotoxicity; OKT3; activated T cells; bispecific antibody; chemokines; cytokines; elotuzumab; multiple myeloma.


Figures

Figure 1
Figure 1
Quantitative flow cytometry-based assay for measuring specific cytotoxicity against multiple myeloma and other non-adherent cell targets. eFlour450-labeled cell targets are cultured alone or in the presence of either BATs or unarmed ATC for 16 h (or longer). The absolute number of target and effector cells in a fixed volume (50 μL) of the test culture is measured upon initial mixing and at a later time point(s) from the same culture. The number of target cells cultured alone is used as a reference for calculating cytotoxicity as a result of co-culturing with ATC. The number of surviving target cells (eFluor450 positive/7-AAD negative) per fixed volume is used to calculate the percent cytotoxicity as [1− (# live targets in ATC co-cultures divided by the number of live targets in parallel cultures grown without ATC)] × 100. Numbers within the gates represent the # of live target cells/50 μL at each time point. Top left: BATs plus eFluor450-labeled targets at Time 0. Bottom left: eFluor450-labeled targets alone at Time 0. Top right: BATs + eFluor450-labeled targets at Time 16 h. Bottom right: eFluor450-labeled targets alone at Time 16 h. In this example, cytotoxicity of CS1-BATs against MM.1S myeloma cells is [1-(7508)/11383)] × 100% = 34% at 1:1 E:T.
Figure 2
Figure 2
SDS-PAGE of CS1Bi heteroconjugation product. Lane 1: molecular weight markers; Lane 2: CS1Bi product containing unconjugated monomers, heterodimer, and multimers forms; Lane 3: OKT3; Lane 4: elotuzumab. M, monomers; H, heterodimers; Ms, multimers.
Figure 3
Figure 3
Expression of CS-1 on MM cell lines. (A) Left panel: Right peak shows binding of PE-anti-CS1 (Abcam, 95827; clone 162) at 10 μg/mL and 0.4 million MM.1S cells after incubation in 100 μL phosphate buffered saline (PBS)/0.2% bovine serum albumin for 20' at 4°C; Left peak shows binding of PE-isotype control. Right panel: Right peaks show relative binding of Elo to MM.1S cells incubated at 16 μg/mL and 32 μg/mL relative to 32 μg/mL human IgG1 (left peak), stained with PE-anti-human IgG (Biolegend, 409304; clone HP6017). The relative binding of the Abcam PE-anti-CS1 vs. isotype control for 5 MM cell lines is shown in the table to the right of the histogram panels. (B) Arming titration of CS1-BATs against MM.1S MM cells. Each panel shows binding of CS1Bi by FITC anti-murine IgG2a at either 16, 32, or 64 μg/mL CS1Bi/0.4 million ATC after incubation in 100 μL phosphate buffered saline (PBS)/0.2% bovine serum albumin for 20' at 4°C. The histograms are overlaid against staining of MM.1S by 8, 16, or 32 μg/mL OKT3, respectively, which represents the relative amount of OKT3 in the CS1Bi product. (C) Binding of CS1Bi to ATC. CS1Bi was incubated at 500 ng/mL/0.4 million ATC in 100 μL for 20' at 4°C followed by staining with PE-anti-human IgG. Right peak shows the binding to Elo in the bound BiAb. The left peaks show background binding of ATC incubated with Elo or Herceptin (both human IgG1 isotype) at 2 μg/mL/0.4 million ATC.
Figure 4
Figure 4
(A) Cytotoxicity of differentially armed BATs. Normal donor ATC were unarmed (UN) or armed with 12.5, 25, or 50 ng/106 ATC and tested against RPMI (Left panel; 1 to 1.5 E:T, n = 5), ARH77 (Middle panel; 1.5 to 2.1 E:T, n = 5) and L363 (Right panel; 1 to 1.5 E:T, n = 3) cells in a 16 h cytotoxicity assay. The difference between armed and unarmed ATC (UN) was significant (p < 0.05) for 50 and 25 ng/106 ATC for all three cell lines, as well as for 12.5 ng/106 ATC for ARH77 and L363 cells. *P < 0.05. Arming at 50 and 25 ng/106 ATC was significantly different than 12.5 ng/106 for ARH77 cells. (B) Cytotoxicity of CS1-BATs against MM.1S and OPM2 MM cells. Unarmed (UN) BATs or BATs armed with 50 ng/106 ATC were incubated for 16 h with MM.1S cells (Left panel; 0.8 to 1.1 E:T, n = 4) and with OPM2 cells (Right panel; 0.7 to 1.36 E:T, n = 7; and 3.1 to 3.6 E:T, n = 3). MM.1S were highly sensitive to CS1-BATs at 1:1 E:T. OPM2 cells were relatively resistant at 1:1 E:T, with increased cytotoxicity at 3:1 E:T. (*P < 0.05). (C) ATC were armed with CS1Bi (50 ng/106 ATC), elotuzumab (25 ng/106 ATC), or OKT3 (25 ng/106 ATC) and tested for cytotoxicity against L363 and ARH77 cells at 1:1 to 2:1 E:T in a 16 h flow-based assay. CS1-BATs showed significantly greater killing (*P < 0.05) than either unarmed, elotuzumab-armed, or OKT3-armed ATC.
Figure 5
Figure 5
Cytotoxicity of CS1Bi-armed PBMC from normal donors. PBMC and ATC from 3 normal donors were armed with 50 ng/million cells and co-cultured with ARH77 and L363 cells for 16 h at 2:1 E:T. Each donor is represented by a pair of connected dots showing the results of unarmed vs. armed cells. (A) CS1Bi-armed PBMC vs. ATC for ARH77 cells. (B) CS1Bi-armed PBMC vs. ATC for L363 cells (*P < 0.05).
Figure 6
Figure 6
Co-culture of CS1 BATs with L363 cells in the presence of elotuzumab. ATC from 3 normal donors were armed with 50 ng CS1Bi and co-cultured with L363 at an E:T of 1:1 (*P < 0.05).
Figure 7
Figure 7
Cytokine production upon engagement of CS1- BATs. Cell-free supernatants from 16 h co-cultures of multiple myeloma cell lines with unarmed ATC, CS1 BATs armed with 50 ng/106 ATC at 1:1 E:T (RPMI, 1.1 to 1.5 E:T; L363, 1.1 to 1.5 E:T) or 2:1 E:T (ARH77, 1.1 to 1.8 E:T) (n = 4 donors), or CS1-BATs cultured alone (n = 3 donors) were analyzed for production of cytokines, granzyme B, and chemokines. (A) Average levels of IFN-γ, TNF-α, GM-CSF (pg/ml), and granzyme B (ng/mL) (n = 4 donors) are summarized in the 4 panels. (B) Chemokine production by CS1-BATs. The levels of type-1 chemokines (MIP1-a, MIP1-b, Rantes, and IP10) present in the same supernatants as in (A) are shown for each of the cell lines tested (pg/mL). *P < 0.05.
Figure 8
Figure 8
Cytotoxicity of MM pt-derived CS1-BATs. Cryopreserved PBMC from 2 MM pts from WSU and 2 pts from UVA were used to prepare ATC by activation with OKT3 and expansion in IL2-supplemented media for up to 14 days. ATC were armed with CS1Bi at 50 ng/106 ATC and co-cultured with OPM2 (n = 4) at 2.8–3.6 E:T and ARH77 (n = 3) cells at 3.5–4.0 E:T for 16 h. CS1-BATs from a normal donor VA05 (3.2–3.8 E:T) were included as a positive control for each cell line. The level of cytotoxicity of the pt samples was comparable to that of the normal donor performed in parallel (*P < 0.05).
Figure 9
Figure 9
Continuous cell killing and effector cell expansion of MM pt CS1-BATs. CS1-BATs from 3 MM pts were co-cultured with ARH77 target cells at 1:1 E:T (1.1 to 1.5) for 3 days. Duplicate samples for BATs, unarmed ATC, and ARH77 cells grown alone were analyzed for each day of culture to determine relative cytotoxicity and number of ATC for each day of culture. (A) Cytotoxicity increased on each successive day, and was statistically different for CS1-BATs vs. unarmed ATC on day 3. (B) A similar trend was observed for the total number of ATC present, with the number in CS1-BATs-treated wells significantly higher at days 2 and 3 (*P < 0.05).

References

    1. Lahuerta JJ, Paiva B, Vidriales MB, Cordon L, Cedena MT, Puig N, et al. . Depth of response in multiple myeloma: a pooled analysis of three PETHEMA/GEM clinical trials. J Clin Oncol. (2017) 35:2900–10. 10.1200/JCO.2016.69.2517 - DOI - PMC - PubMed
    1. Ho CC, Liao WY, Wang CY, Lu YH, Huang HY, Chen HY, et al. . TREM-1 expression in tumor-associated macrophages and clinical outcome in lung cancer. Am J Respir Crit Care Med. (2008) 177:763–70. 10.1164/rccm.200704-641OC - DOI - PubMed
    1. Collins SM, Bakan CE, Swartzel GD, Hofmeister CC, Efebera YA, Kwon H, et al. . Elotuzumab directly enhances NK cell cytotoxicity against myeloma via CS1 ligation: evidence for augmented NK cell function complementing ADCC. Cancer Immunol Immunother. (2013) 62:1841–9. 10.1007/s00262-013-1493-8 - DOI - PMC - PubMed
    1. van de Donk NW, Moreau P, Plesner T, Palumbo A, Gay F, Laubach JP, et al. . Clinical efficacy and management of monoclonal antibodies targeting CD38 and SLAMF7 in multiple myeloma. Blood. (2016) 127:681–95. 10.1182/blood-2015-10-646810 - DOI - PubMed
    1. Lum LG, Thakur A, Al-Kadhimi Z, Colvin GA, Cummings FJ, Legare RD, et al. . Targeted T-cell therapy in stage IV breast cancer: a phase I clinical trial. Clin Cancer Res. (2015) 21:2305–14. 10.1158/1078-0432.CCR-14-2280 - DOI - PMC - PubMed