. 2020 May 5:10:707.
doi: 10.3389/fonc.2020.00707. eCollection 2020.

Construction and Validation of an Autophagy-Related Prognostic Risk Signature for Survival Predicting in Clear Cell Renal Cell Carcinoma Patients

Affiliations

Construction and Validation of an Autophagy-Related Prognostic Risk Signature for Survival Predicting in Clear Cell Renal Cell Carcinoma Patients

Huiying Yang et al. Front Oncol. .

Abstract

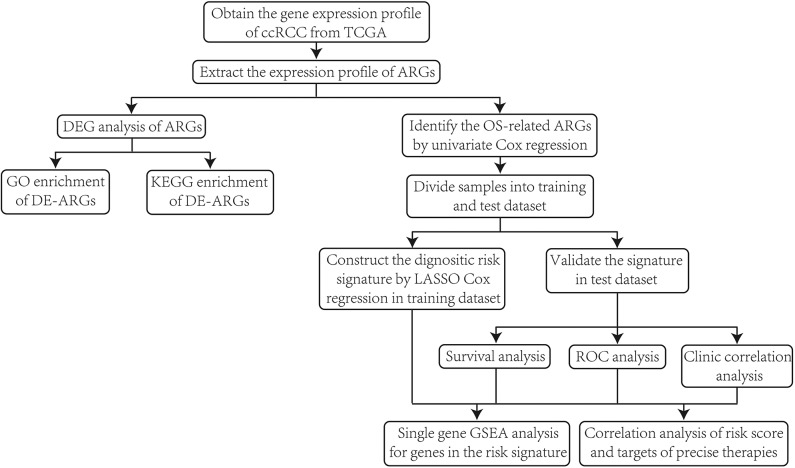
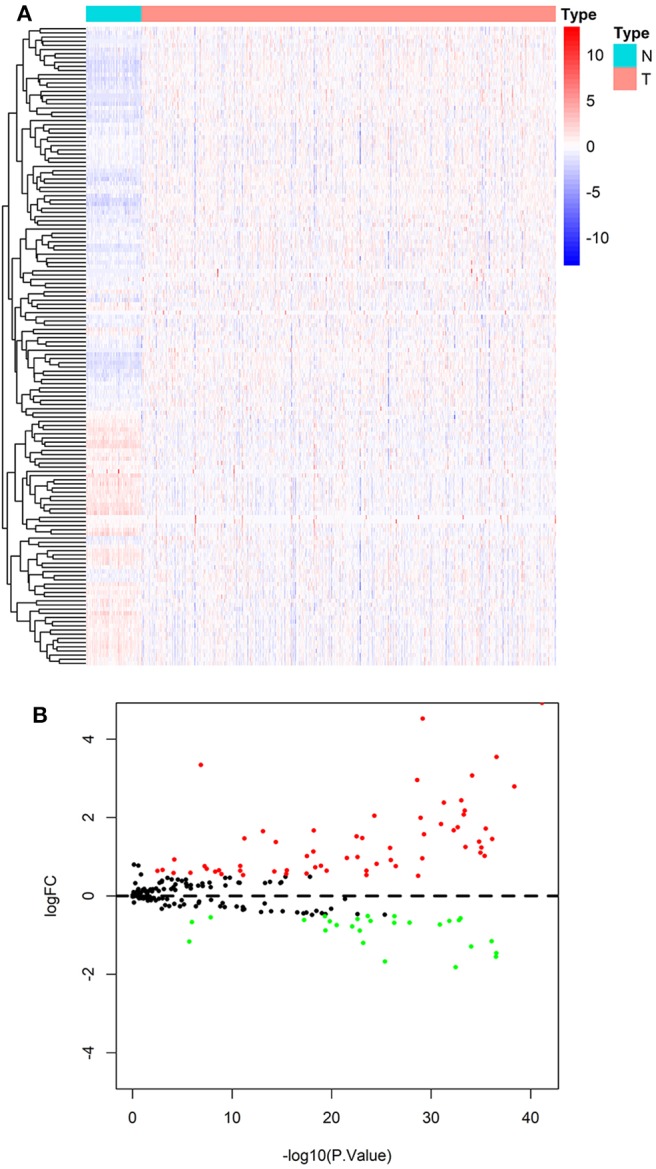
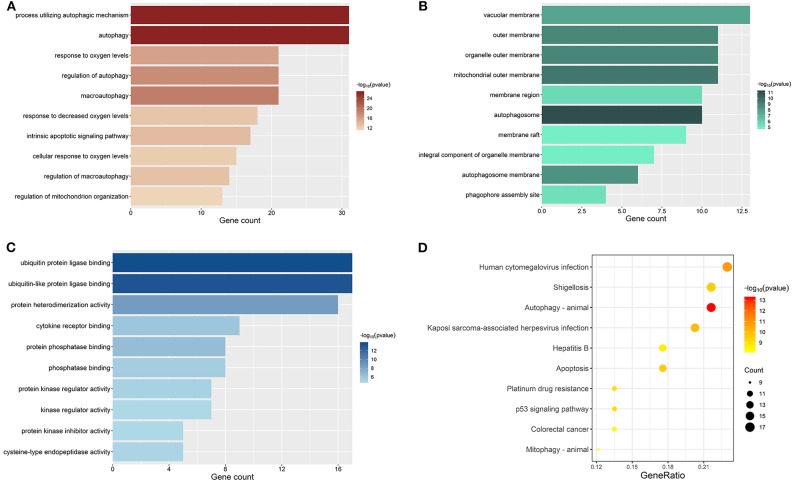
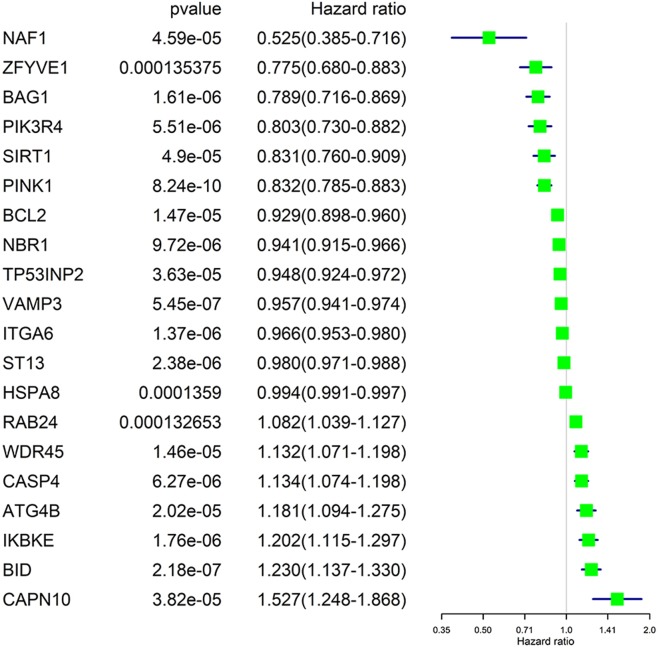
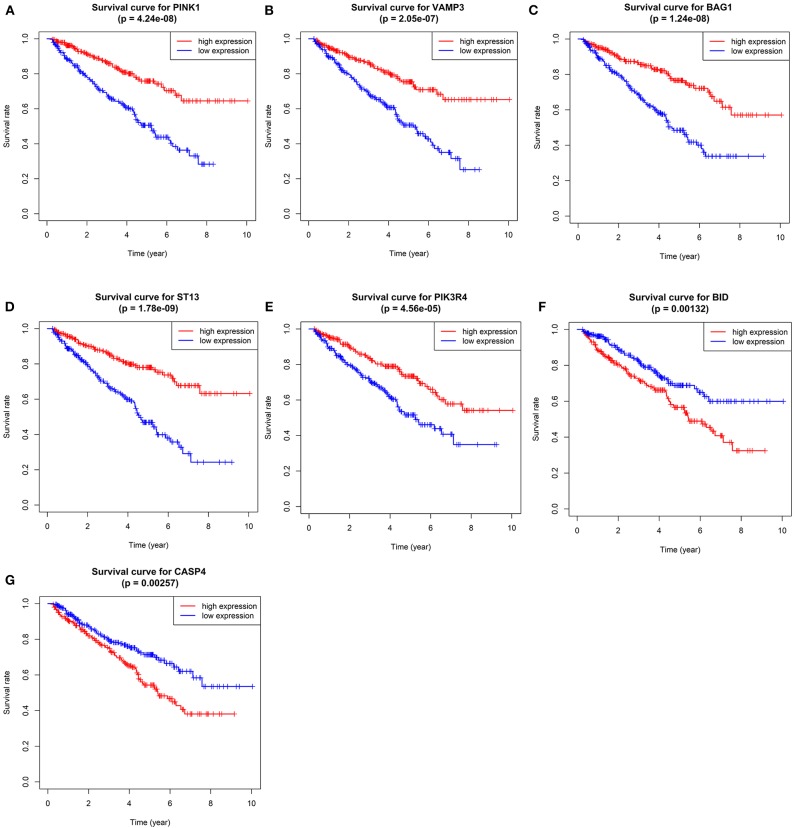
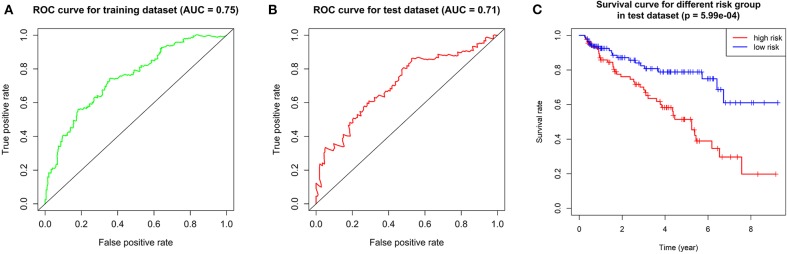
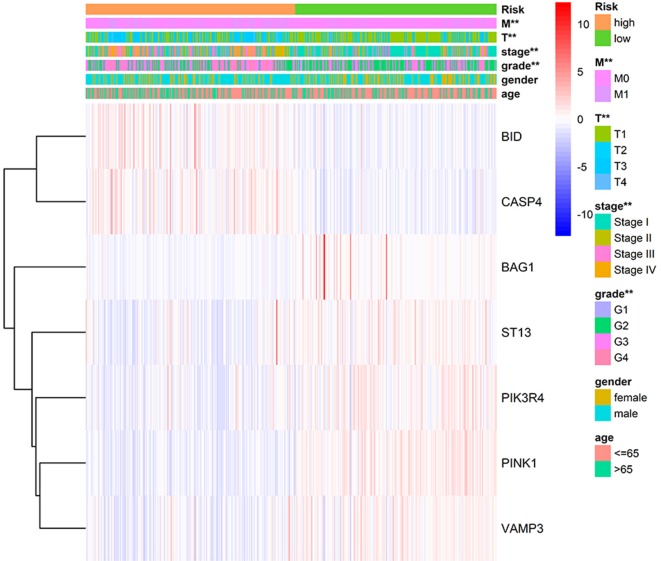
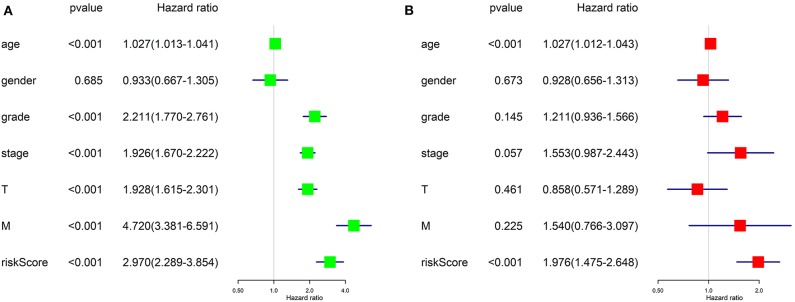
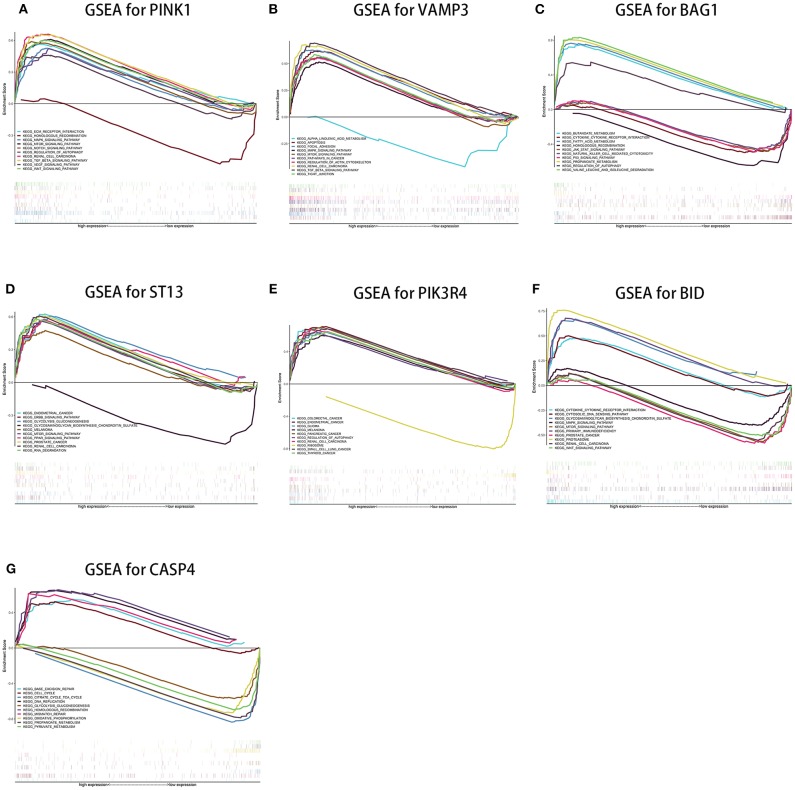
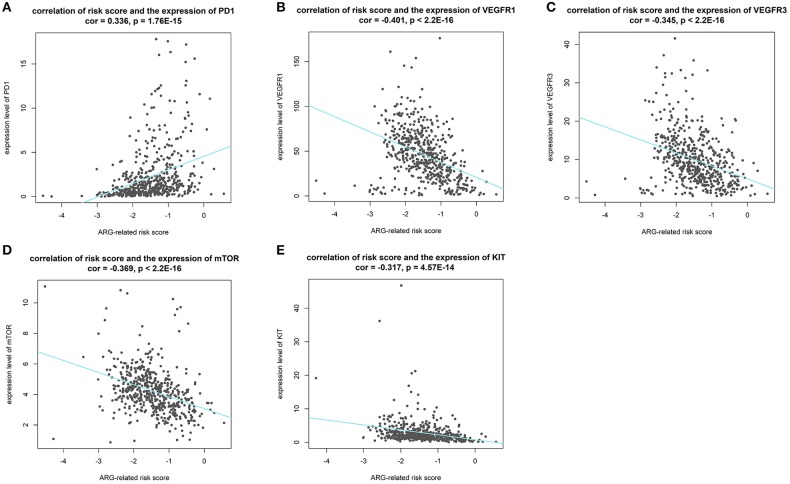
Background: Clear cell renal cell carcinoma (ccRCC) is a common type of malignant tumors in urinary system. Evaluating the prognostic outcome at the time of initial diagnosis is essential for patients. Autophagy is known to play a significant role in tumors. Here, we attempted to construct an autophagy-related prognostic risk signature based on the expression profile of autophagy-related genes (ARGs) for predicting the long-term outcome and effect of precise treatments for ccRCC patients. Methods: We obtained the expression profile of ccRCC from the cancer genome atlas (TCGA) database and extract the portion of ARGs. We conducted differentially expressed analysis on ARGs and then performed enrichment analyses to confirm the anomalous autophagy-related biological functions. Then, we performed univariate Cox regression to screen out overall survival (OS)-related ARGs. With these genes, we established an autophagy-related risk signature by least absolute shrinkage and selection operator (LASSO) Cox regression. We validated the reliability of the risk signature with receiver operating characteristic (ROC) analysis, survival analysis, clinic correlation analysis, and Cox regression. Then we analyzed the function of each gene in the signature by single-gene gene set enrichment analysis (GSEA). Finally, we analyzed the correlation between our risk score and expression level of several targets of immunotherapy and targeted therapy. Results: We established a seven-gene prognostic risk signature, according to which we could divide patients into high or low risk groups and predict their outcomes. ROC analysis and survival analysis validated the reliability of the signature. Clinic correlation analysis found that the risk group is significantly correlated with severity of ccRCC. Multivariate Cox regression revealed that the risk score could act as an independent predictor for the prognosis of ccRCC patients. Correlation analysis between risk score and targets of precise treatments showed that our risk signature could predict the effects of precise treatment powerfully. Conclusion: Our study provided a brand new autophagy-related seven-gene prognostic risk signature, which could perform as a prognostic indicator for ccRCC. Meanwhile, our study provides a novel sight to understand the role of autophagy and suggest therapeutic strategies in the category of precise treatment in ccRCC.

Keywords: TCGA; autophagy-related genes; clear cell renal cell carcinoma; effect prediction of precise treatments; least absolute shrinkage and selection operator (LASSO) Cox regression; overall survival; prognostic outcome; prognostic risk signature.


Figures

Figure 1
Figure 1
The flow chart of the overall procedures.
Figure 2
Figure 2
Result of differentially expressed analysis on ARGs. (A) A heatmap of DE-ARGs. Each line represents a DE-ARG and each row means a sample. The expression levels of genes are displayed with colors in each cell (red for high and blue for low). (B) A volcano plot of the logFC and statistical significance of all ARGs. Red plots represent up-regulated DE-ARGs and green ones represent down-regulated ones. Black plots are genes didn't reach the criteria of DEGs.
Figure 3
Figure 3
Results of enrichment analyses of DE-ARGs. The color represents the statistical significance of the term. The length indicates the counts of enriched genes. (A) Top 10 significant GO-BP terms. (B) Top 10 significant GO-MF terms. (C) Top 10 significant GO-CC terms. (D) Top 10 significant KEGG signal pathways.
Figure 4
Figure 4
Significance and Hazard ratio values of OS-related ARGs in univariate Cox regression.
Figure 5
Figure 5
Kaplan–Meier overall survival (OS) curves for ccRCC patients assigned to groups of high and low expression level of based on the seven genes, respectively. (A–G shows the results of PINK1, VAMP3, BAG1, ST13, PIK3R4, BID, and CASP4, respectively).
Figure 6
Figure 6
Validation of the prognostic gene signature. (A) ROC curve showing the predictive efficiency of the risk signature in training dataset. (B) Kaplan–Meier overall survival (OS) curve for patients in test dataset assigned to groups of high risk and low risk based on our signature. (C) ROC curve showing the predictive efficiency of the risk signature in test dataset.
Figure 7
Figure 7
Correlation of risk group and clinical traits.
Figure 8
Figure 8
Results of Cox regression for risk factors for ccRCC. (A) Result of Univariate Cox regression. (B) Result of multivariate Cox regression.
Figure 9
Figure 9
Results of single-gene GSEA of seven genes in our risk signature in ccRCC. (A–G shows the results of PINK1, VAMP3, BAG1, ST13, PIK3R4, BID, and CASP4, respectively).
Figure 10
Figure 10
Results of correlation analysis between our risk score and expression level of targets of precise treatment in ccRCC. (A–E shows the results of PD-1, VEGFR1, VEGFR3, mTOR, KIT, respectively).

Similar articles

Cited by

References

    1. Hsieh JJ, Purdue MP, Signoretti S, Swanton C, Albiges L, Schmidinger M, et al. . Renal cell carcinoma. Nat Rev Dis Primers. (2017) 3:17009. 10.1038/nrdp.2017.9 - DOI - PMC - PubMed
    1. Ljungberg B, Bensalah K, Canfield S, Dabestani S, Hofmann F, Hora M, et al. . EAU guidelines on renal cell carcinoma: 2014 update. Eur Urol. (2015) 67:913–24. 10.1016/j.eururo.2015.01.005 - DOI - PubMed
    1. Humphrey PA, Moch H, Cubilla AL, Ulbright TM, Reuter VE. The 2016 WHO classification of tumours of the urinary system and male genital organs-part B: prostate and bladder tumours. Eur Urol. (2016) 70:106–19. 10.1016/j.eururo.2016.02.028 - DOI - PubMed
    1. Motzer RJ, Jonasch E, Agarwal N, Bhayani S, Bro WP, Chang SS, et al. . Kidney cancer, version 2.2017, NCCN clinical practice guidelines in oncology. J Natl Compr Canc Netw. (2017) 15:804–34. 10.6004/jnccn.2017.0100 - DOI - PubMed
    1. Shen C, Liu J, Wang J, Zhong X, Dong D, Yang X, et al. . Development and validation of a prognostic immune-associated gene signature in clear cell renal cell carcinoma. Int Immunopharmacol. (2020) 81:106274. 10.1016/j.intimp.2020.106274 - DOI - PubMed

LinkOut - more resources