

Microfluidic Biofabrication of 3D Multicellular Spheroids by Modulation of Non-geometrical Parameters
- PMID: 32432090
- PMCID: PMC7214796
- DOI: 10.3389/fbioe.2020.00366
Microfluidic Biofabrication of 3D Multicellular Spheroids by Modulation of Non-geometrical Parameters
Abstract
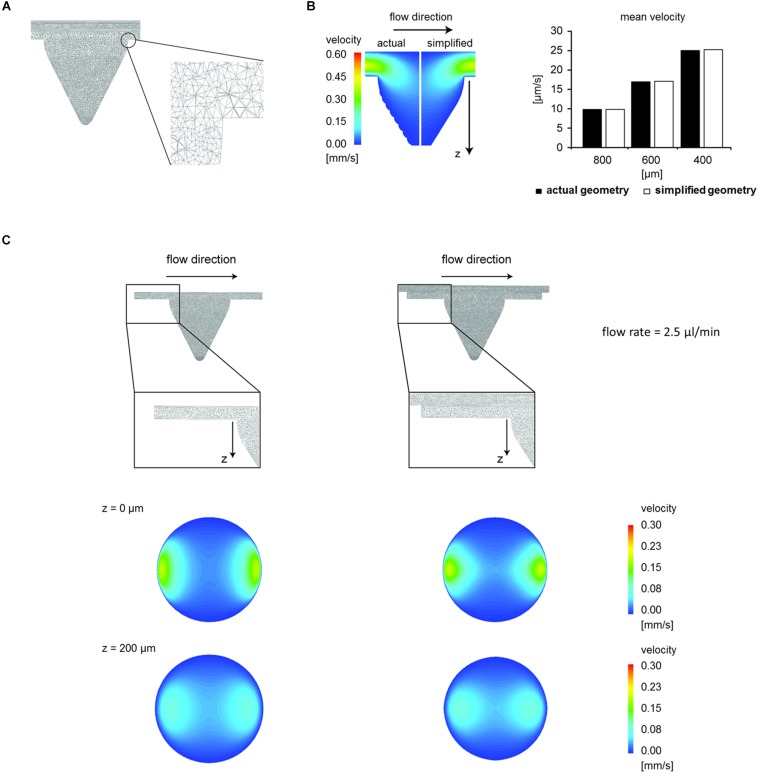
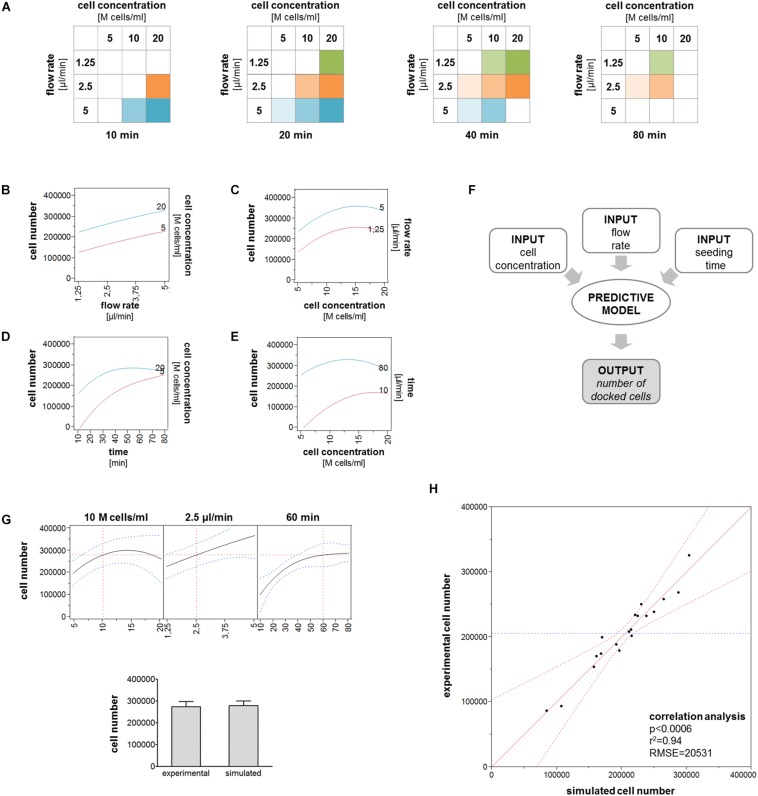
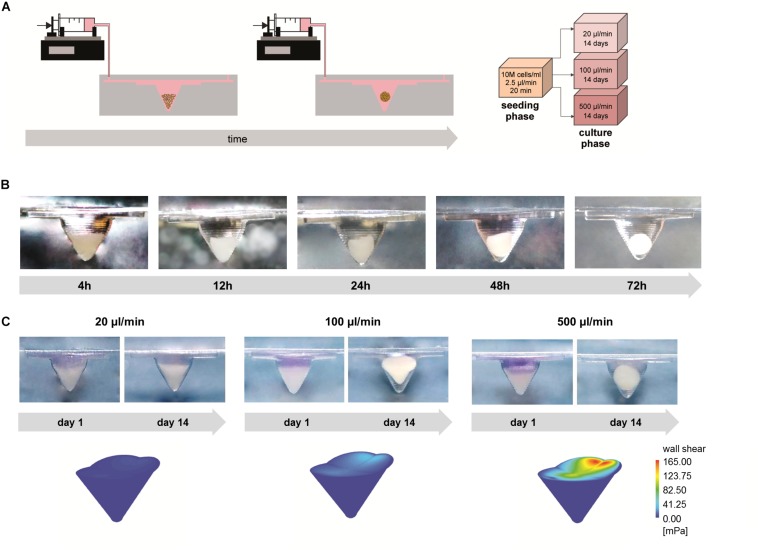
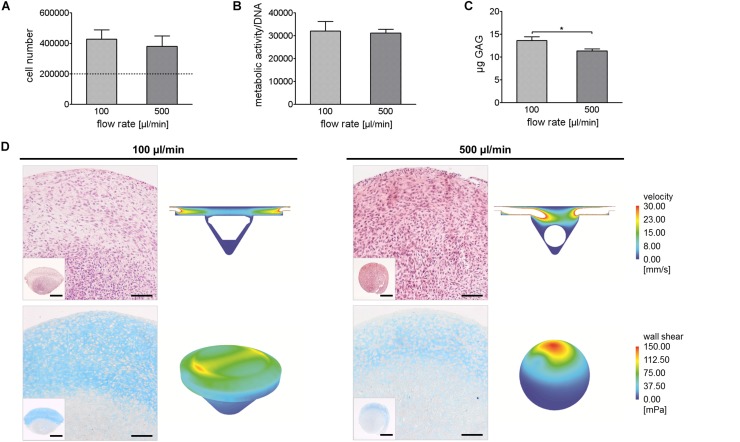
Three-dimensional (3D) cell spheroids are being increasingly applied in many research fields due to their enhanced biological functions as compared to conventional two-dimensional (2D) cultures. 3D cell spheroids can replicate tissue functions, which enables their use both as in vitro models and as building blocks in tissue biofabrication approaches. In this study, we developed a perfusable microfluidic platform suitable for robust and reproducible 3D cell spheroid formation and tissue maturation. The geometry of the device was optimized through computational fluid dynamic (CFD) simulations to improve cell trapping. Experimental data were used in turn to generate a model able to predict the number of trapped cells as a function of cell concentration, flow rate, and seeding time. We demonstrated that tuning non-geometrical parameters it is possible to control the size and shape of 3D cell spheroids generated using articular chondrocytes (ACs) as cellular model. After seeding, cells were cultured under perfusion at different flow rates (20, 100, and 500 μl/min), which induced the formation of conical and spherical spheroids. Wall shear stress values on cell spheroids, computed by CFD simulations, increased accordingly to the flow rate while remaining under the chondroprotective threshold in all configurations. The effect of flow rate on cell number, metabolic activity, and tissue-specific matrix deposition was evaluated and correlated with fluid velocity and shear stress distribution. The obtained results demonstrated that our device represents a helpful tool to generate stable 3D cell spheroids which can find application both to develop advanced in vitro models for the study of physio-pathological tissue maturation mechanisms and to obtain building blocks for the biofabrication of macrotissues.
Keywords: 3D culture; fluid dynamic; microfluidic; pellet culture; spheroid.
Copyright © 2020 Lopa, Piraino, Talò, Mainardi, Bersini, Pierro, Zagra, Rasponi and Moretti.
Figures


Similar articles
-
Spheroid Engineering in Microfluidic Devices.ACS Omega. 2023 Jan 18;8(4):3630-3649. doi: 10.1021/acsomega.2c06052. eCollection 2023 Jan 31. ACS Omega. 2023. PMID: 36743071 Free PMC article. Review.
-
Microfluidic device for enhancement and analysis of osteoblast differentiation in three-dimensional cell cultures.J Biol Eng. 2023 Dec 14;17(1):77. doi: 10.1186/s13036-023-00395-z. J Biol Eng. 2023. PMID: 38098075 Free PMC article.
-
Design and fabrication of a liver-on-a-chip platform for convenient, highly efficient, and safe in situ perfusion culture of 3D hepatic spheroids.Lab Chip. 2018 Aug 21;18(17):2547-2562. doi: 10.1039/c8lc00333e. Lab Chip. 2018. PMID: 30019731
-
Detachably assembled microfluidic device for perfusion culture and post-culture analysis of a spheroid array.Biotechnol J. 2014 Jul;9(7):971-9. doi: 10.1002/biot.201300559. Epub 2014 Jun 12. Biotechnol J. 2014. PMID: 24802801
-
Cell spheroids as a versatile research platform: formation mechanisms, high throughput production, characterization and applications.Biofabrication. 2021 Apr 8;13(3). doi: 10.1088/1758-5090/abe6f2. Biofabrication. 2021. PMID: 33592595 Review.
Cited by
-
One-Step Generation and Purification of Cell-Encapsulated Hydrogel Microsphere With an Easily Assembled Microfluidic Device.Front Bioeng Biotechnol. 2022 Jan 28;9:816089. doi: 10.3389/fbioe.2021.816089. eCollection 2021. Front Bioeng Biotechnol. 2022. PMID: 35155414 Free PMC article.
-
Computational methods for biofabrication in tissue engineering and regenerative medicine - a literature review.Comput Struct Biotechnol J. 2024 Jan 2;23:601-616. doi: 10.1016/j.csbj.2023.12.035. eCollection 2024 Dec. Comput Struct Biotechnol J. 2024. PMID: 38283852 Free PMC article. Review.
-
Spheroid Engineering in Microfluidic Devices.ACS Omega. 2023 Jan 18;8(4):3630-3649. doi: 10.1021/acsomega.2c06052. eCollection 2023 Jan 31. ACS Omega. 2023. PMID: 36743071 Free PMC article. Review.
-
Spheroids formation in large drops suspended in superhydrophobic paper cones.Biomicrofluidics. 2024 Apr 5;18(2):024107. doi: 10.1063/5.0197807. eCollection 2024 Mar. Biomicrofluidics. 2024. PMID: 38606014 Free PMC article.
-
Strategies for Constructing Tissue-Engineered Fat for Soft Tissue Regeneration.Tissue Eng Regen Med. 2024 Apr;21(3):395-408. doi: 10.1007/s13770-023-00607-z. Epub 2023 Nov 30. Tissue Eng Regen Med. 2024. PMID: 38032533 Free PMC article. Review.
References
LinkOut - more resources
Full Text Sources
Miscellaneous