. 2020 May 5:8:289.
doi: 10.3389/fcell.2020.00289. eCollection 2020.

H3K4me1 Distribution Predicts Transcription State and Poising at Promoters

Affiliations

H3K4me1 Distribution Predicts Transcription State and Poising at Promoters

Sunhee Bae et al. Front Cell Dev Biol. .

Abstract

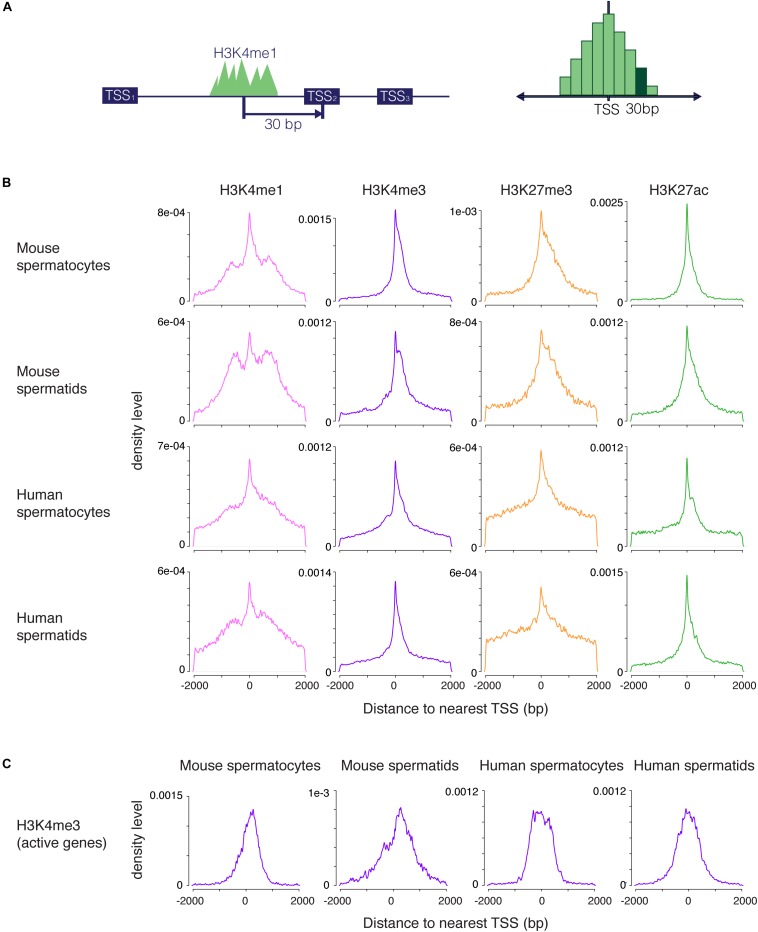
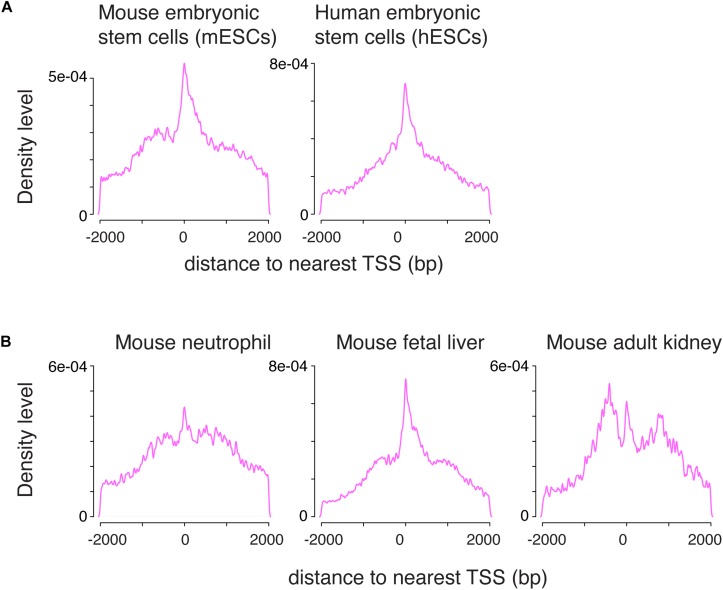
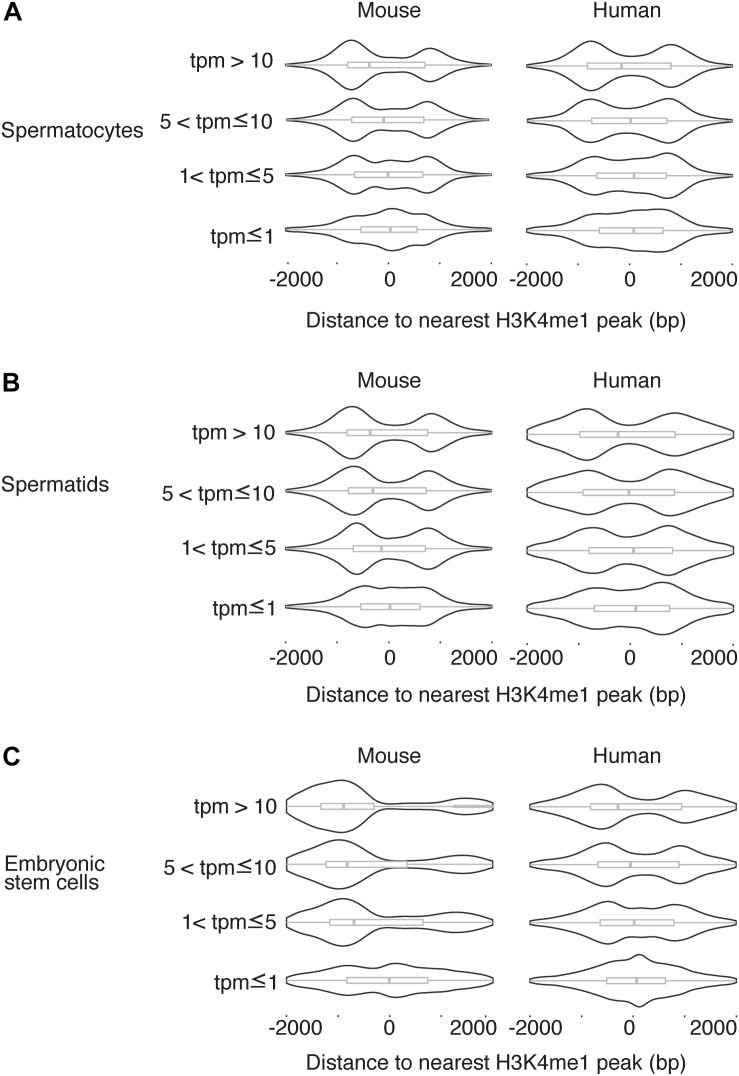
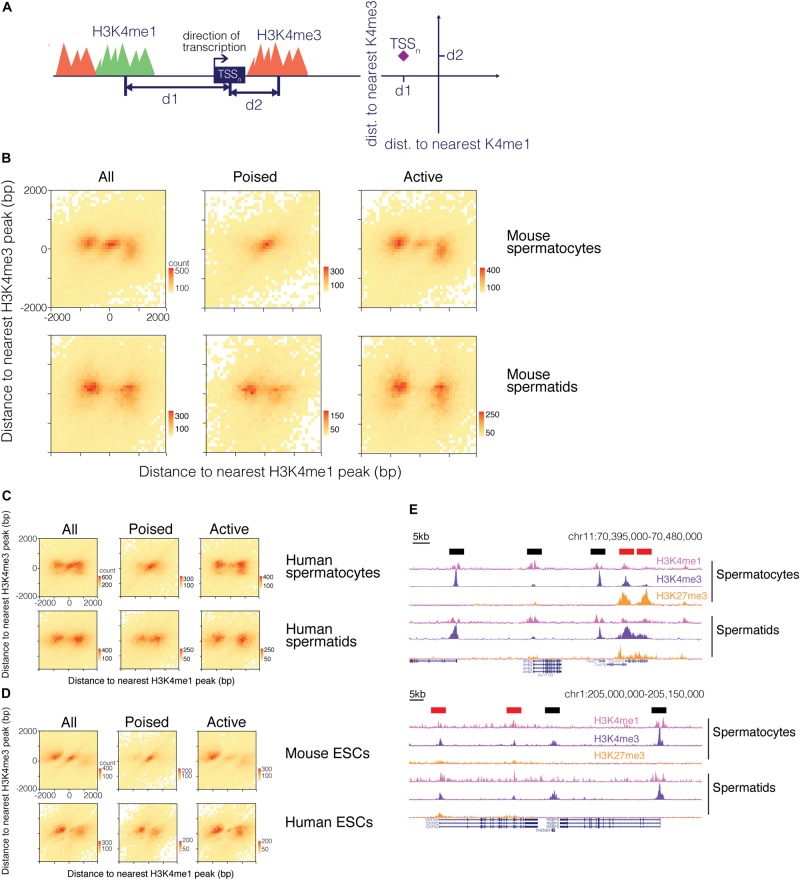
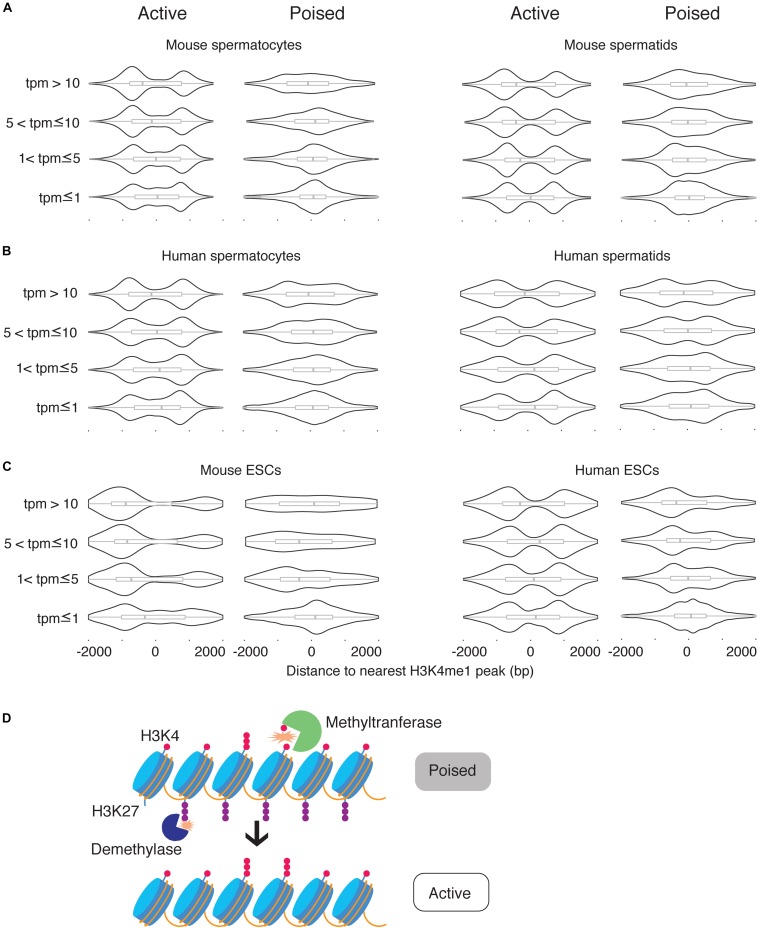
Monomethylation on lysine 4 of histone H3 (H3K4me1) is commonly associated with distal enhancers, but H3K4me1 is also present at promoter regions proximal to transcription start sites. To assess a possible role for H3K4me1 in dictating gene regulatory states at promoters, we examined H3K4me1 peak density around promoters in human and mouse germ cells using an analytic strategy that allowed us to assess relationships between different epigenetic marks on a promoter-by-promoter basis. We found that H3K4me1 exhibits either a bimodal pattern at active promoters, where it flanks H3K4me3, or a unimodal pattern at poised promoters, where it coincides with both H3K4me3 and H3K27me3. This pattern is correlated with gene expression level, but is more strongly linked to a poised chromatin state, defined by the simultaneous presence of H3K4me3 and H3K27me3, than to transcriptional activity. The pattern is especially prominent in germ cells, but is also present in other cell types, including embryonic stem cells and differentiated somatic cells. We propose that H3K4me1 is a key feature of the poised epigenetic state, and suggest possible roles for this mark in epigenetic memory.

Keywords: bivalent; germ cell; histone; pluripotency; poised; promoter; spermatogenesis; stem cell.


Figures

FIGURE 1
FIGURE 1
Distribution of H3K4me1, H3K4me3, H3K27me3, and H3K27ac peaks near promoters. (A) Scheme for generating density plots. For each peak, the distance from the peak center to its nearest transcription start site (TSS) was obtained, and a density distribution was calculated from the distance values. (B) Density plots for four histone modifications in mouse and human male germ cells at two stages of spermatogenesis. All four marks have a unimodal set of peaks centered at the TSS, but only H3K4me1 has an additional bimodal peak density displaced from the TSS. (C) Density distribution of H3K4me3 peaks at highly transcribed (tpm > 10) TSS. The density plots do not exhibit profiles that indicate nucleosome clearing. bp, base pairs.
FIGURE 2
FIGURE 2
The combination of unimodal and bimodal H3K4me1 distributions is observed across various cell types. (A) Density distribution in mouse and human embryonic stem cells. A mixed unimodal and bimodal pattern of H3K4me1 is present, similar to germ cells. (B) Density distribution in mouse neutrophils, fetal liver, and adult kidney. The mix of unimodal and bimodal distributions is observed in all three cell types, but relative prominence of the unimodal H3K4me1 distribution varies. bp, base pairs.
FIGURE 3
FIGURE 3
H3K4me1 distribution pattern is correlated to expression level. Distribution of H3K4me1 with respect to the TSS in mouse and human pachytene spermatocytes (A), round spermatids (B), and embryonic stem cells (C), classified by transcript level. Box plots enclosed within the violin plots show the median (vertical line), interquartile range (box) and total range within the plot boundaries (horizontal line) for the distance between the H3K4me1 peak and TSS. In all cell types, TSS with lower expression are associated with H3K4me1 peak densities directly overlapping the TSS, while TSS with higher expression are associated with H3K4me1 peak densities that flank the TSS. Comparisons across the four categories of transcript levels were significant at a threshold of p < 0.05 by the Kruskal-Wallis test for all mouse cell types (spermatocyte p = 2.395e-5, spermatid p = 4.368e-6, ESC p < 2.2 e-16) and for human spermatocytes (p = 1.915e-6). Comparisons in human spermatids and human ESCs were not significant (p > 0.05). bp, base pairs. tpm, transcripts per million.
FIGURE 4
FIGURE 4
H3K4me1 distribution around H3K4me3 predicts the epigenetic state of promoters. (A) Scheme for mapping TSS with respect to both H3K4me1 and H3K4me3 marks. For each TSS, distances to its nearest H3K4me1 peak and its nearest H3K4me3 peak were calculated, and the TSS were classified based on distances to the two histone modifications. (B) Heatmap of TSS distribution in mouse pachytene spermatocytes and round spermatids. Most TSS were concentrated at either the center of the heatmap or both sides of the center group to form “wings”. The center cluster and the wings separate when the TSS are grouped based on poising. (C) Heatmap of TSS distribution in human germ cells. (D) Heatmap of TSS distribution in mouse and human embryonic stem cells. (E) ChIP-seq signal tracks at poised and active promoters in mouse (top) and human (bottom) germ cells. H3K4me1 signal at active promoters (black bars above signal tracks) flanks H3K4me3 signal while H3K4me1 signal at poised promoters (red bars above signal tracks) exhibits a unimodal profile. bp, base pairs.
FIGURE 5
FIGURE 5
H3K4me1 peak profile correlates best with epigenetic poising at promoters. (A) Distribution of H3K4me1 with respect to the TSS at active promoters and poised promoters in mouse spermatocytes and spermatids, classified by expression level. (B) Distribution of H3K4me1 in human spermatocytes and spermatids, classified by expression levels. (C) Distribution of H3K4me1 in mouse and human ESCs. Box plots enclosed within the violin plots show the median (vertical line), interquartile range (box) and total range within the plot boundaries (horizontal line) for the distance between the H3K4me1 peak and TSS. All comparisons between active promoters and poised promoters were significant (p < 0.05) by the Kruskal-Wallis test. (D) Model for the role of H3K4 monomethylation in activation of poised promoters. Preexisting H3K4me1 is further methylated to H3K4me3, while H3K27me3 is removed from the promoter region.

References

    1. Alabert C., Barth T. K., Reverón-Gómez N., Sidoli S., Schmidt A., Jensen O. N., et al. (2015). Two distinct modes for propagation of histone PTMs across the cell cycle. Genes Dev. 29 585–590. 10.1101/gad.256354.114 - DOI - PMC - PubMed
    1. Andersson R., Sandelin A., Danko C. G. (2015). A unified architecture of transcriptional regulatory elements. Trends Genet. 31 426–433. 10.1016/j.tig.2015.05.007 - DOI - PubMed
    1. Azuara V., Perry P., Sauer S., Spivakov M., Jørgensen H. F., John R. M., et al. (2006). Chromatin signatures of pluripotent cell lines. Nat. Cell Biol. 8 532–538. 10.1038/ncb1403 - DOI - PubMed
    1. Barski A., Cuddapah S., Cui K., Roh T.-Y., Schones D. E., Wang Z., et al. (2007). High-resolution profiling of histone methylations in the human genome. Cell 129 823–837. 10.1016/j.cell.2007.05.009 - DOI - PubMed
    1. Bellvé A. R. (1993). Purification, culture, and fractionation of spermatogenic cells. Methods Enzymol. 225 84–113. 10.1016/0076-6879(93)25009-q - DOI - PubMed